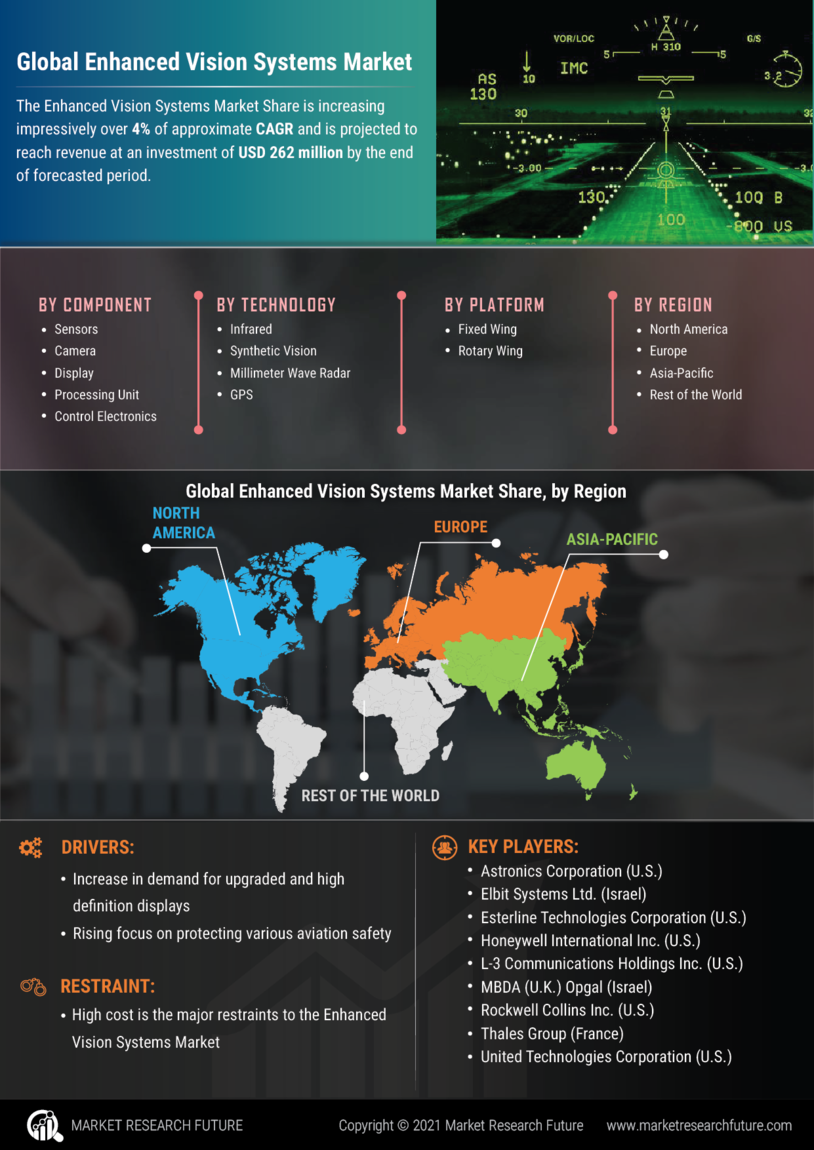
ID: MRFR/SEM/2172-HCR | February, 2021 | Region : Global
Market Overview
The world of technology is changing rapidly, and enhanced vision systems concept has recently come up with various technologies to provide safer approaches and landings procedures. Upgraded vision systems are assisting in upscaling different situational awareness, not only during the process of take-off, various approaches, and landing procedures but also during various ground maneuvering. This is one of the main and primary benefits of revolutionized vision systems. It also provides in assisting navigational aid to the main pilots, and hence it assists in reducing the total number of accidents. Global Enhanced Vision Systems provides better situational awareness assists in safer operations to dodge any mishaps. An upgraded and enhanced vision system also particularly allows pilots to conduct at various remote locations with incompetent airport facilities. For regular improvements of components, there is a rigorous amount of financial investment which is directly involved with a prolonged clearance process. These are various major market restraints that are causing restraints in the development of Enhanced Vision Systems Market.
The Enhanced Vision Systems Market Share is increasing impressively over 4% of approximate CAGR and is projected to reach revenue at an investment of USD 262 million by the end of forecasted period.
COVID 19 Impacts and effects
COVID 19 has impacted the Enhanced Vision Systems Market. Due to lockdown, the flights got canceled all over the world, which has seriously impacted the Enhanced Vision Systems Market Size. The major component like display unit is the most critical component of the enhanced and modernized flight vision system as it shows advanced infrared imagery and various graphical depiction of valuable data which is collected from different onboard sensors. It is basically found in the main pilot’s direct line of actual sight in the form of different types of head-up displays, various head-down displays, and various head-mounted displays. During the pandemic, there are plenty of factors such as a primary focus on achieving different reliable airline operations and increasing demand for several private and business jets is included. The global pandemic leads to several challenges to the Enhanced Vision Systems Market Size sector; it is affected all over the world. Major strategic developments are taking place. MNC are investing more because of the increasing demand from consumers across the globe.
Market Dynamics
Technology Analysis
By Division by Structure
The global enhanced vision systems market has been divided on the basis of modern technology, basic component, modern platform, and basic regional division. The department of components segment consists of modern sensors, bigger and larger processing units, modern and enhanced control electronics, advanced cameras, and modern display. Basic Enhanced vision systems use sensors like latest and advanced infrared or radar to give a better and exact view of the outside world.
On the basis of Geographic Segmentation:
Division by Service
The extremely high cost has been responsible for slower increase of the global enhanced vision systems market growth over the projected period. Besides, the current pandemic COVID-19 has adversely impacted the enhanced vision systems market industry as there has been a slowdown. Top manufacturers suspended the wide manufacturing operations
Market Segmentation
Division by Application
There are plenty of factors like better situational awareness and increasing demand for better and high definition displays that are accelerating the growth of the enhanced vision systems market. All across the globe, for example, North America, Europe, Asia Pacific, Middle East & Africa, and Latin America, the Enhanced Vision System market is spreading related to enhanced flight vision system market during the estimated period.
Division by Region
The worldwide market for enhanced vision systems market is projected to increase at a considerable rate. The various geographical analysis of enhanced vision systems market Asia-Pacific is projected to dominate the increasingly enhanced vision systems market during the estimated period due to the presence of bigger global players in the region.
Regional Analysis
This increased growth can be basically attributed to the presence of large companies or OEMs (original equipment manufacturers), such as HALBIT Avionics Private Ltd (India) and Samtel Group Limited (India), demand for risen safety and reliable airline modern operations, and increasing and fluctuating weather conditions in the region
Competitive Landscape
The Enhanced Vision System market players for are concentrating on up-gradation of advanced components; there is a frequent significant high amount of financial investment involved in the process.
Recent Developments
Report Overview
TABLE OF CONTENTS
1 MARKET INTRODUCTION
1.1 INTRODUCTION
1.2 SCOPE OF STUDY
1.2.1 RESEARCH OBJECTIVE
1.2.2 ASSUMPTIONS
1.2.3 LIMITATIONS
1.3 MARKET STRUCTURE
2 RESEARCH METHODOLOGY
2.1 RESEARCH TYPE
2.2 PRIMARY RESEARCH
2.3 SECONDARY RESEARCH
2.4 FORECAST MODEL
2.4.1 MARKET DATA COLLECTION, ANALYSIS & FORECAST
2.4.2 MARKET SIZE ESTIMATION
3 MARKET DYNAMICS
3.1 INTRODUCTION
3.2 MARKET DRIVERS
3.3 MARKET CHALLENGES
3.4 MARKET OPPORTUNITIES
3.5 MARKET RESTRAINTS
4 EXECUTIVE SUMMARY
5. MARKET FACTOR ANALYSIS
5.1 PORTER’S FIVE FORCES ANALYSIS
5.2 SUPPLY CHAIN ANALYSIS
6 ENHANCED VISION SYSTEMS MARKET, BY SEGMENTS
6.1 INTRODUCTION
6.2 MARKET STATISTICS
6.2.1 BY COMPONENT
6.2.1.1 CAMERA
6.2.1.2 SENSORS
6.2.1.3 DISPLAY
6.2.1.4 PROCESSING UNIT
6.2.1.5 CONTROL ELECTRONICS
6.2.2 BY TECHNOLOGY
6.2.2.1 INFRARED
6.2.2.2 SYNTHETIC VISION
6.2.2.3 MILLIMETER WAVE RADAR
6.2.2.4 GLOBAL POSITIONING SYSTEM
6.2.3 BY PLATFORM
6.2.3.1 FIXED WING
6.2.3.2 ROTARY WING
6.2.3 BY REGION
6.2.3.1 NORTH AMERICA
6.2.3.2 EUROPE
6.2.3.3 ASIA-PACIFIC
6.2.3.4 REST OF THE WORLD
7 COMPETITIVE ANALYSIS
7.1 MARKET SHARE ANALYSIS
7.2 COMPANY PROFILES
7.2.1 ASTRONICS CORPORATION (U.S.)
7.2.2 ELBIT SYSTEMS LTD. (ISRAEL)
7.2.3 ESTERLINE TECHNOLOGIES CORPORATION (U.S.)
7.2.4 HONEYWELL INTERNATIONAL, INC. (U.S.)
7.2.5 L-3 COMMUNICATIONS HOLDINGS, INC. (U.S.)
7.2.6 MBDA (U.K.)
7.2.7 OPGAL (ISRAEL)
7.2.8 ROCKWELL COLLINS, INC. (U.S.)
7.2.9 THALES GROUP (FRANCE)
7.2.10 UNITED TECHNOLOGIES CORPORATION (U.S.)
7.2.11 OTHERS
LIST OF TABLES
TABLE 1 ENHANCED VISION SYSTEMS MARKET, BY COMPONENT
TABLE 2 ENHANCED VISION SYSTEMS MARKET, BY TECHNOLOGY
TABLE 3 ENHANCED VISION SYSTEMS MARKET, BY PLATFORM
TABLE 4 ENHANCED VISION SYSTEMS MARKET, BY REGIONS
TABLE 5 NORTH AMERICA ENHANCED VISION SYSTEMS MARKET, BY COMPONENT
TABLE 6 NORTH AMERICA ENHANCED VISION SYSTEMS MARKET, BY TECHNOLOGY
TABLE 7 NORTH AMERICA ENHANCED VISION SYSTEMS MARKET, BY PLATFORM
TABLE 8 U.S. ENHANCED VISION SYSTEMS MARKET, BY COMPONENT
TABLE 9 U.S. ENHANCED VISION SYSTEMS MARKET, BY TECHNOLOGY
TABLE 10 U.S. ENHANCED VISION SYSTEMS MARKET, BY PLATFORM
TABLE 11 CANADA ENHANCED VISION SYSTEMS MARKET, BY COMPONENT
TABLE 12 CANADA ENHANCED VISION SYSTEMS MARKET, BY TECHNOLOGY
TABLE 13 CANADA ENHANCED VISION SYSTEMS MARKET, BY PLATFORM
TABLE 14 GERMANY ENHANCED VISION SYSTEMS MARKET, BY COMPONENT
TABLE 15 GERMANY ENHANCED VISION SYSTEMS MARKET, BY TECHNOLOGY
TABLE 16 GERMANY ENHANCED VISION SYSTEMS MARKET, BY PLATFORM
TABLE 17 U.K. ENHANCED VISION SYSTEMS MARKET, BY COMPONENT
TABLE 18 U.K. ENHANCED VISION SYSTEMS MARKET, BY TECHNOLOGY
TABLE 19 U.K. ENHANCED VISION SYSTEMS MARKET, BY PLATFORM
TABLE 20 EUROPE ENHANCED VISION SYSTEMS MARKET, BY COMPONENT
TABLE 21 EUROPE ENHANCED VISION SYSTEMS MARKET, BY TECHNOLOGY
TABLE 22 EUROPE ENHANCED VISION SYSTEMS MARKET, BY PLATFORM
TABLE 23 FRANCE ENHANCED VISION SYSTEMS MARKET, BY COMPONENT
TABLE 24 FRANCE ENHANCED VISION SYSTEMS MARKET, BY TECHNOLOGY
TABLE 25 FRANCE ENHANCED VISION SYSTEMS MARKET, BY PLATFORM
TABLE 26 ASIA-PACIFIC ENHANCED VISION SYSTEMS MARKET, BY COMPONENT
TABLE 27 ASIA-PACIFIC ENHANCED VISION SYSTEMS MARKET, BY TECHNOLOGY
TABLE 28 ASIA-PACIFIC ENHANCED VISION SYSTEMS MARKET, BY PLATFORM
TABLE 29 REST OF THE WORLD ENHANCED VISION SYSTEMS MARKET, BY COMPONENT
TABLE 30 REST OF THE WORLD ENHANCED VISION SYSTEMS MARKET, BY TECHNOLOGY
TABLE 31 REST OF THE WORLD ENHANCED VISION SYSTEMS MARKET, BY PLATFORM
LIST OF FIGURES
FIGURE 1 RESEARCH TYPE
FIGURE 2 ENHANCED VISION SYSTEMS MARKET, BY COMPONENT (%)
FIGURE 3 ENHANCED VISION SYSTEMS MARKET, BY TECHNOLOGY (%)
FIGURE 4 ENHANCED VISION SYSTEMS MARKET, BY PLATFORM (%)
FIGURE 5 ENHANCED VISION SYSTEMS MARKET, BY REGIONS (%)
FIGURE 6 NORTH AMERICA ENHANCED VISION SYSTEMS MARKET, BY COMPONENT (%)
FIGURE 7 NORTH AMERICA ENHANCED VISION SYSTEMS MARKET, BY TECHNOLOGY (%)
FIGURE 8 NORTH AMERICA ENHANCED VISION SYSTEMS MARKET, BY PLATFORM (%)
FIGURE 9 EUROPE ENHANCED VISION SYSTEMS MARKET, BY COMPONENT (%)
FIGURE 10 EUROPE ENHANCED VISION SYSTEMS MARKET, BY TECHNOLOGY (%)
FIGURE 11 EUROPE ENHANCED VISION SYSTEMS MARKET, BY PLATFORM (%)
FIGURE 12 ASIA-PACIFIC ENHANCED VISION SYSTEMS MARKET, BY COMPONENT (%)
FIGURE 13 ASIA-PACIFIC ENHANCED VISION SYSTEMS MARKET, BY TECHNOLOGY (%)
FIGURE 14 ASIA PACIFIC ENHANCED VISION SYSTEMS MARKET, BY PLATFORM (%)
FIGURE 15 REST OF THE WORLD ENHANCED VISION SYSTEMS MARKET, BY COMPONENT (%)
FIGURE 16 REST OF THE WORLD ENHANCED VISION SYSTEMS MARKET, BY TECHNOLOGY (%)
FIGURE 17 REST OF THE WORLD ENHANCED VISION SYSTEMS MARKET, BY PLATFORM (%)