×
Hero Background
English
Chinese
French
Japanese
Korean
German
Spanish

Enhanced Oil Recovery Market Trends

ID: MRFR/EnP/4444-HCR
100 Pages
Anshula Mandaokar
October 2025

Enhanced Oil Recovery Market Research Report By Technology (Gas Injection, Thermal Recovery, Chemical Injection, Microbial Enhanced Oil Recovery, Combined Cycle Recovery), By Application (Onshore, Offshore, Brownfield, Greenfield), By Technique (Water Flooding, Polymer Flooding, In-Situ Combustion, Steam Injection), By End Use (Oil Gas Industry, Energy Sector, Petrochemical Industry) and By Regional (North America, Europe, South America, Asia Pacific, Middle East and Africa) - Forecast to 2035

Share:
Download PDF ×

We do not share your information with anyone. However, we may send you emails based on your report interest from time to time. You may contact us at any time to opt-out.

Enhanced Oil Recovery Market Infographic
Purchase Options

Market Trends

Key Emerging Trends in the Enhanced Oil Recovery Market

The EOR industry has gone through significant changes lately because of innovative advancement and the basic to streamline oil extraction from mature fields. Novel strategies like warm cycles, substance infusions, and gas infusions are progressively being embraced to upgrade the adequacy of oil recuperation, explicitly in repositories where ordinary methods have become deficient. Carbon catch and capacity (CCS) advances are among the naturally ideal and manageable EOR techniques that the oil and gas industry is by and by underscoring. By sequestering carbon dioxide underground and infusing caught CO2 into oil supplies for oil recuperation, these cycles increment oil creation while limiting ecological effect. Progressively, information examination and artificial intelligence are being executed in the EOR area to streamline repository the executives, figure creation drifts, and further develop navigation. By utilizing artificial intelligence calculations to break down tremendous supply information looking for designs, EOR procedures can be carried out with more prominent accuracy and effectiveness. Joint efforts among oil organizations, innovation suppliers, and examination foundations are getting some forward movement in the EOR market. This pattern encourages the trading of information, assets, and aptitude, eventually bringing about the execution of cutting-edge innovations and the improvement of more effective EOR arrangements. As regular oil saves lessen, districts with significant oil holds, including the Center East, North America, and segments of Asia, are seeing a development in the worldwide EOR market. These locales are expanding homegrown oil creation through the speculation of industry members and state-run administrations in EOR research, which is used to extricate remaining assets effectively. Ecological worries, administrative systems, cost-adequacy, and monetary reasonability are hindrances that the EOR market should survive. Boundless reception of trend setting innovations is every now and again impeded by the significant speculations that are frequently required. Hardships emerge within the sight of lower oil costs, and thorough adherence is important to administrative structures and ecological worries, like those relating to synthetics and seismicity. Supportability, mechanical headway, and unions are reshaping the oil recuperation industry. As well as tending to cost, guidelines, and ecological effect, local market elements, high level EOR procedures, information examination, and man-made reasoning are upgrading oil extraction.

Author
Anshula Mandaokar
Team Lead - Research

Anshula Mandaokar holds an academic degree in Chemical Engineering and has been contributing to the field for more than 5 years. She has expertise in Market Research and Business Consulting and serves as a Team Lead for a reputed Market Research firm under the Chemicals and Materials domain spectrum. She has worked on multiple projects, generating explicit results in a quick turnaround time. Her understanding of data interpretation justifies her role as a leader.

Leave a Comment

FAQs

What is the projected market valuation of the Enhanced Oil Recovery Market by 2035?

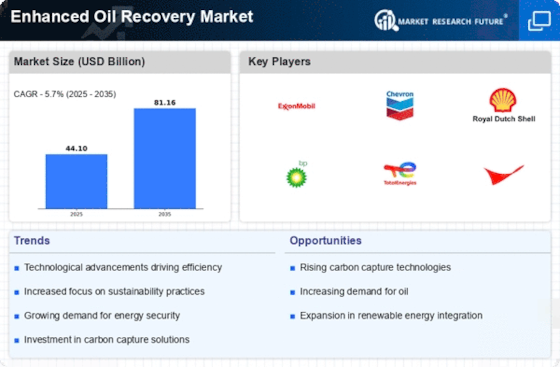
The Enhanced Oil Recovery Market is projected to reach a valuation of 81.16 USD Billion by 2035.

What was the market valuation of the Enhanced Oil Recovery Market in 2024?

In 2024, the Enhanced Oil Recovery Market was valued at 44.1 USD Billion.

What is the expected CAGR for the Enhanced Oil Recovery Market during the forecast period 2025 - 2035?

The expected CAGR for the Enhanced Oil Recovery Market during the forecast period 2025 - 2035 is 5.7%.

Which technology segment is projected to have the highest valuation by 2035?

The Thermal Recovery segment is projected to reach a valuation of 23.45 USD Billion by 2035.

What are the projected valuations for the Onshore application segment by 2035?

The Onshore application segment is projected to reach a valuation of 28.0 USD Billion by 2035.

Which technique is expected to show significant growth in the Enhanced Oil Recovery Market?

Water Flooding is expected to show significant growth, with a projected valuation of 28.0 USD Billion by 2035.

Market Summary

As per MRFR analysis, the Enhanced Oil Recovery Market Size was estimated at 44.1 USD Billion in 2024. The Enhanced Oil Recovery industry is projected to grow from 46.61 USD Billion in 2025 to 81.16 USD Billion by 2035, exhibiting a compound annual growth rate (CAGR) of 5.7 during the forecast period 2025 - 2035.

Key Market Trends & Highlights

The Enhanced Oil Recovery Market is poised for growth driven by technological advancements and increasing energy demand.

  • Technological advancements are reshaping the Enhanced Oil Recovery Market landscape, particularly in North America, which remains the largest market.
  • The Asia-Pacific region is emerging as the fastest-growing area, driven by rising energy needs and investment in innovative recovery techniques.
  • Gas injection continues to dominate the market, while thermal recovery is gaining traction as the fastest-growing segment.
  • Key market drivers include increasing energy demand and regulatory support, which are crucial for the development of aging oil fields.

Market Size & Forecast

2024 Market Size 44.1 (USD Billion)
2035 Market Size 81.16 (USD Billion)
CAGR (2025 - 2035) 5.7%
Largest Regional Market Share in 2024 North America

Major Players

<p>ExxonMobil (US), Chevron (US), Royal Dutch Shell (GB), BP (GB), TotalEnergies (FR), ConocoPhillips (US), Eni (IT), Occidental Petroleum (US), Suncor Energy (CA)</p>

Market Trends

The Enhanced Oil Recovery Market is currently experiencing a transformative phase, driven by the increasing demand for oil and the necessity to maximize extraction from existing fields. This market encompasses various techniques aimed at improving the recovery of crude oil from reservoirs, which are becoming more challenging to exploit. As conventional oil sources dwindle, the focus shifts towards innovative methods that enhance production efficiency. The integration of advanced technologies, such as carbon dioxide injection and thermal recovery, appears to be reshaping the landscape of oil extraction. Furthermore, environmental considerations are influencing the adoption of these methods, as stakeholders seek to balance profitability with sustainability. In addition, the Enhanced Oil Recovery Market is likely to witness a surge in investment as companies aim to optimize their operations and reduce costs. The collaboration between industry players and research institutions may foster the development of novel techniques that enhance recovery rates. This collaborative approach could lead to breakthroughs that not only improve extraction efficiency but also address environmental concerns. Overall, the Enhanced Oil Recovery Market is poised for growth, driven by technological advancements and a commitment to sustainable practices.

Technological Advancements

The Enhanced Oil Recovery Market is increasingly influenced by technological innovations that enhance extraction processes. Techniques such as gas injection, thermal recovery, and microbial methods are gaining traction, as they promise improved efficiency and higher recovery rates. These advancements not only optimize production but also reduce operational costs, making them attractive to industry stakeholders.

Sustainability Focus

There is a growing emphasis on sustainability within the Enhanced Oil Recovery Market. Companies are exploring methods that minimize environmental impact while maximizing oil recovery. This trend reflects a broader commitment to responsible resource management, as stakeholders recognize the importance of aligning profitability with ecological considerations.

Investment in Research and Development

Investment in research and development is becoming a critical trend in the Enhanced Oil Recovery Market. Companies are increasingly allocating resources to explore innovative techniques and improve existing methods. This focus on R&D is expected to yield new solutions that enhance recovery efficiency and address the challenges posed by aging oil fields.

Enhanced Oil Recovery Market Market Drivers

Aging Oil Fields

The prevalence of aging oil fields is a significant driver for the Enhanced Oil Recovery Market. Many oil fields around the world are reaching the end of their productive life, with conventional extraction methods yielding diminishing returns. Enhanced oil recovery techniques are increasingly viewed as essential to revitalizing these mature fields. It is estimated that enhanced oil recovery can potentially recover an additional 30 to 60% of the original oil in place, making it a viable solution for operators facing declining production rates. As companies seek to maximize the value of their existing assets, the demand for enhanced recovery solutions is expected to rise, further propelling market growth.

Increasing Energy Demand

The Enhanced Oil Recovery Market is experiencing a surge in demand for energy, driven by the growing global population and industrialization. As economies expand, the need for oil and gas increases, prompting companies to seek methods to maximize extraction from existing fields. Enhanced oil recovery techniques, such as thermal recovery and gas injection, are becoming essential to meet this demand. According to recent estimates, the global energy consumption is projected to rise by approximately 30% by 2040, necessitating innovative solutions in oil recovery. This trend indicates a robust market for enhanced oil recovery technologies, as they enable operators to extract additional resources from mature fields, thereby extending their productive life and contributing to energy security.

Technological Innovations

Technological advancements play a pivotal role in shaping the Enhanced Oil Recovery Market. Innovations such as advanced seismic imaging, real-time data analytics, and improved drilling techniques are enhancing the efficiency and effectiveness of recovery processes. For instance, the integration of artificial intelligence and machine learning in reservoir management is optimizing production strategies and reducing operational costs. The market for enhanced oil recovery technologies is expected to witness substantial growth, with investments in R&D projected to reach billions of dollars in the coming years. These innovations not only improve recovery rates but also minimize environmental impacts, aligning with the industry's shift towards more sustainable practices.

Environmental Considerations

Environmental concerns are becoming increasingly influential in the Enhanced Oil Recovery Market. As the world shifts towards more sustainable energy practices, enhanced oil recovery methods that minimize environmental impact are gaining traction. Techniques such as CO2 injection not only enhance oil recovery but also contribute to carbon sequestration efforts, addressing climate change challenges. The market is witnessing a growing preference for technologies that reduce water usage and lower greenhouse gas emissions. This shift is likely to drive innovation in enhanced oil recovery methods, as companies strive to meet both regulatory requirements and consumer expectations for environmentally responsible practices. The integration of sustainability into recovery strategies is expected to shape the future landscape of the industry.

Regulatory Support and Policies

The Enhanced Oil Recovery Market benefits from supportive regulatory frameworks and policies aimed at promoting energy independence and sustainability. Governments are increasingly recognizing the importance of enhanced oil recovery as a means to optimize domestic oil production and reduce reliance on imports. Incentives such as tax breaks, grants, and subsidies for companies investing in enhanced recovery technologies are becoming more common. This regulatory support is likely to stimulate market growth, as it encourages investment in innovative recovery methods. Furthermore, policies aimed at reducing carbon emissions may drive the adoption of enhanced oil recovery techniques that capture and store CO2, thereby aligning with global climate goals.

Market Segment Insights

By Technology: Gas Injection (Largest) vs. Thermal Recovery (Fastest-Growing)

<p>In the Enhanced Oil Recovery Market, the technology segments exhibit varied market share distribution, with Gas Injection leading as the largest segment. This method dominates due to its efficiency in extracting additional oil from mature wells. Thermal Recovery follows, with significant contributions to the market as oil operators optimize the extraction process through this technology. Other segments such as Chemical Injection and Microbial Enhanced Oil Recovery Market trail behind, showcasing the growing diversity in oil recovery techniques.</p>

<p>Gas Injection (Dominant) vs. Thermal Recovery (Emerging)</p>

<p>Gas Injection stands out as the dominant technology in the Enhanced Oil Recovery Market due to its established effectiveness in maximizing oil output from existing wells. This method utilizes gases, particularly natural gas and CO2, to maintain reservoir pressure and enhance oil flow. Conversely, Thermal Recovery is emerging swiftly, capturing attention for its ability to mobilize viscous crude oil through heat application. This technique is gaining traction, especially in heavy oil fields, as efficient thermal processes continue to evolve, making it an increasingly attractive option for operators looking to improve yield in challenging reservoir conditions.</p>

By Application: Onshore (Largest) vs. Offshore (Fastest-Growing)

<p>The Enhanced Oil Recovery Market (EOR) market is significantly influenced by the application segments of onshore and offshore operations. Currently, onshore applications hold the largest market share, driven by extensive existing infrastructure and favorable government policies promoting oil recovery techniques. This segment's dominance is supported by a higher number of operational fields and technological advancements that enhance efficiency and production rates, resulting in an increased focus on onshore recovery methods amongst industry players. In contrast, offshore applications are emerging as the fastest-growing segment within the EOR market. This growth is attributed to the increasing exploration of untapped offshore reserves and the rising demand for energy in global markets. Developments in offshore technology and techniques, combined with a shift towards sustainable energy practices, are driving innovation and investment in this area, making it a pivotal focus for oil companies aiming to maximize production from challenging environments.</p>

<p>Application Type: Onshore (Dominant) vs. Offshore (Emerging)</p>

<p>Onshore Enhanced Oil Recovery Market (EOR) methods have established themselves as the dominant application type due to their economic viability and operational flexibility. The vast majority of EOR projects are focused inland, allowing for relatively easy access and lower operational risks. This segment is characterized by diverse techniques such as thermal recovery and gas injection, which are well-suited to existing infrastructure. Conversely, offshore EOR operations are emerging as a dynamic segment, primarily driven by advancements in subsea technology and the pursuit of new oil fields in deeper waters. Offshore EOR presents unique challenges due to harsher environmental conditions and requires substantial capital investment; however, the potential for high yield production fuels interest and growth in this sector.</p>

By Technique: Water Flooding (Largest) vs. Steam Injection (Fastest-Growing)

<p>In the Enhanced Oil Recovery Market, Water Flooding holds the largest market share, thanks to its maturity and effectiveness in extracting oil from reservoir formations. This technique has been widely adopted due to its cost efficiency and demonstrated results in increasing recovery rates. Conversely, Steam Injection is gaining traction as one of the fastest-growing methods in this segment, driven by improvements in technology and a shift towards more efficient recovery processes. The ability to reduce viscosity and enhance oil flow gives Steam Injection a competitive edge in addressing challenging reservoir conditions. The growth in the Enhanced Oil Recovery Market segment is attributed to increasing global energy demands and the need for more efficient recovery methods in mature oil fields. Technological advancements and innovative approaches in well stimulation are enabling operators to extract more oil from existing resources, thereby driving the adoption of various techniques. The emphasis on reducing environmental footprints and optimizing resource usage further propels the market for effective Enhanced Oil Recovery Market methods, especially those like Steam Injection that showcase promising efficiencies and outputs.</p>

<p>Technique: Water Flooding (Dominant) vs. Polymer Flooding (Emerging)</p>

<p>Water Flooding stands out as the dominant technique in the Enhanced Oil Recovery Market, characterized by its simplicity and reliability in improving oil recovery rates. This process involves injecting water into oil reservoirs to maintain pressure and displace oil towards production wells. Its widespread application is backed by decades of successful implementation in various geological settings. On the other hand, Polymer Flooding is emerging as a novel technique that enhances the efficiency of water flooding by introducing polymers to increase the viscosity of the injected water. This allows for better displacement of oil and reduces water permeability in the formation, leading to improved oil recovery. As operators seek innovative solutions to boost production from depleting fields, Polymer Flooding is poised to gain significance in complementing traditional methods.</p>

By End Use: Oil Gas Industry (Largest) vs. Energy Sector (Fastest-Growing)

<p>In the Enhanced Oil Recovery Market (EOR) market, the Oil Gas Industry remains the largest segment, driving a significant portion of the demand due to its established infrastructure and ongoing investments in recovery techniques. The Energy Sector, while smaller in market share, is emerging rapidly as a critical component due to the increasing focus on sustainable and efficient energy solutions. These segments demonstrate a dynamic interaction as they adapt to market needs and technological advancements. Growth trends show that the Oil Gas Industry is leveraging enhanced recovery methods to maximize output from existing fields, but the Energy Sector is catching up with innovations supporting renewable resources. Factors such as regulatory changes, advancements in technology, and increasing energy demands are fostering a competitive environment. The shift towards decarbonization and environmentally friendly practices within the Energy Sector is accelerating its growth, making it a key player in the EOR landscape.</p>

<p>Oil Gas Industry (Dominant) vs. Energy Sector (Emerging)</p>

<p>The Oil Gas Industry is characterized by its extensive experience and established processes in enhanced oil recovery techniques such as gas injection and thermal recovery. This segment has a dominant position due to its legacy operations and significant investment in recovery technologies. Organizations within this sector are continuously optimizing their operations to ensure maximum efficiency and sustainability. In contrast, the Energy Sector represents an emerging force driven by technological advancements and regulatory support for greener solutions. This segment is increasingly incorporating EOR methods to enhance production from renewable sources and supports the transition towards a more sustainable energy landscape. The interplay between these two sectors highlights the need for innovation while ensuring economic viability in the oil and energy markets.</p>

Get more detailed insights about Enhanced Oil Recovery Market Research Report – Forecast to 2035

Regional Insights

North America : Leading Innovation and Production

North America is the largest market for Enhanced Oil Recovery Market (EOR), holding approximately 45% of the global market share. The region benefits from advanced technology, significant investments in R&D, and a favorable regulatory environment that encourages innovation. The demand for EOR is driven by the need to maximize oil recovery from mature fields and the increasing focus on energy security and sustainability. The United States is the primary player in this market, with Texas and California leading in EOR projects. Major companies like ExxonMobil, Chevron, and Occidental Petroleum are heavily involved, leveraging cutting-edge techniques such as CO2 injection and thermal recovery. The competitive landscape is robust, with a mix of established players and emerging firms focusing on sustainable practices and efficiency improvements.

Europe : Growing Focus on Sustainability

Europe is witnessing a growing interest in Enhanced Oil Recovery Market (EOR), accounting for approximately 25% of the global market share. The region's demand is driven by the need to enhance oil recovery from aging fields and the push for energy independence. Regulatory frameworks are increasingly supportive of EOR technologies, particularly those that align with environmental sustainability goals, such as carbon capture and storage. Leading countries in this market include the United Kingdom, Norway, and the Netherlands, where companies like BP and TotalEnergies are actively engaged in EOR projects. The competitive landscape is characterized by collaborations between oil companies and technology providers to innovate and implement efficient EOR methods. The focus on reducing carbon footprints is shaping the future of EOR in Europe.

Asia-Pacific : Emerging Market Potential

Asia-Pacific is rapidly emerging as a significant player in the Enhanced Oil Recovery Market (EOR) market, holding about 20% of the global market share. The region's growth is fueled by increasing energy demands, particularly in countries like China and India, where the focus is on maximizing output from existing oil fields. Government initiatives and investments in technology are also driving the adoption of EOR techniques. Key players in this region include major oil companies such as Eni and Sinopec, which are exploring various EOR methods, including chemical flooding and gas injection. The competitive landscape is evolving, with both state-owned and private enterprises investing in EOR technologies to enhance production efficiency. The region's diverse geological formations present unique challenges and opportunities for EOR implementation.

Middle East and Africa : Resource-Rich Opportunities

The Middle East and Africa region holds approximately 10% of The Enhanced Oil Recovery Market share, driven by its vast oil reserves and the need to optimize production from mature fields. Countries like Saudi Arabia and the UAE are leading the charge, implementing EOR techniques to maintain their oil output levels amidst declining production rates. Regulatory support for EOR initiatives is also increasing, promoting sustainable practices in oil extraction. Saudi Arabia, with its advanced oil infrastructure, is at the forefront of EOR technologies, employing methods such as thermal recovery and CO2 injection. The competitive landscape features both national oil companies and international players, including BP and TotalEnergies, collaborating on EOR projects. The region's focus on maximizing recovery while addressing environmental concerns is shaping its EOR strategies.

Key Players and Competitive Insights

The Enhanced Oil Recovery Market is currently characterized by a dynamic competitive landscape, driven by the increasing demand for oil and the necessity to optimize existing reserves. Key players such as ExxonMobil (US), Chevron (US), and Royal Dutch Shell (GB) are actively engaged in enhancing their operational efficiencies and technological capabilities. These companies are focusing on innovation and strategic partnerships to bolster their market positions. For instance, ExxonMobil (US) has been investing heavily in advanced recovery techniques, which not only improve extraction rates but also align with sustainability goals. This collective emphasis on technological advancement and strategic positioning among major players shapes a competitive environment that is both collaborative and competitive, as companies seek to leverage their strengths while addressing the challenges of resource depletion and environmental concerns.

In terms of business tactics, companies are increasingly localizing their operations and optimizing supply chains to enhance efficiency and reduce costs. The Enhanced Oil Recovery Market appears moderately fragmented, with a mix of large multinational corporations and smaller specialized firms. The influence of key players is substantial, as they not only set industry standards but also drive innovation through research and development initiatives. This competitive structure allows for a variety of approaches to oil recovery, with each company bringing unique strategies to the table.

In August 2025, Chevron (US) announced a significant partnership with a leading technology firm to develop AI-driven solutions for enhanced oil recovery processes. This strategic move is expected to streamline operations and improve recovery rates, showcasing Chevron's commitment to integrating cutting-edge technology into its operations. The collaboration may also position Chevron as a leader in the digital transformation of the oil recovery sector, potentially setting new benchmarks for efficiency and sustainability.

In September 2025, Royal Dutch Shell (GB) unveiled a new initiative aimed at reducing carbon emissions associated with enhanced oil recovery. This initiative involves the implementation of carbon capture and storage technologies at several of its facilities. By prioritizing sustainability, Shell not only addresses regulatory pressures but also aligns with the growing demand for environmentally responsible practices in the energy sector. This strategic focus on sustainability could enhance Shell's reputation and market share in an increasingly eco-conscious marketplace.

In October 2025, TotalEnergies (FR) launched a pilot project utilizing bio-based solvents in enhanced oil recovery operations. This innovative approach aims to reduce the environmental impact of traditional recovery methods while maintaining efficiency. The pilot project reflects TotalEnergies' commitment to sustainability and innovation, potentially setting a precedent for future practices in the industry. Such initiatives may influence competitors to adopt similar strategies, thereby reshaping the competitive landscape.

As of October 2025, the Enhanced Oil Recovery Market is witnessing trends that emphasize digitalization, sustainability, and the integration of artificial intelligence. Strategic alliances are becoming increasingly important, as companies recognize the value of collaboration in addressing complex challenges. The competitive differentiation is likely to evolve from traditional price-based competition to a focus on innovation, technological advancement, and supply chain reliability. This shift suggests that companies that prioritize these aspects will be better positioned to thrive in the future.

Key Companies in the Enhanced Oil Recovery Market market include

Industry Developments

The  Enhanced Oil Recovery Market has seen significant developments recently, particularly with companies like ExxonMobil, Chevron, and BP increasingly investing in innovative technologies to optimize oil extraction methods.  EOG Resources and ConocoPhillips have been focusing on sustainability efforts as environmental regulations tighten ly.  Furthermore, TotalEnergies and Halliburton have collaborated on several projects aimed at enhancing the efficiency of oil recovery processes.  Recent mergers and acquisitions within the sector, including movements involving companies like Schlumberger and Weatherford International, have reshaped market dynamics and increased competitive capabilities.  Additionally, Petrobras is pursuing partnerships that leverage advanced technologies and expertise to boost production rates.  The overall market valuation continues to grow as major players adapt to shifting energy demands and invest in research and development.  This growth is expected to positively impact the operational capabilities and strategies of key firms, ensuring they remain competitive within the evolving energy landscape.

Future Outlook

Enhanced Oil Recovery Market Future Outlook

<p>The Enhanced Oil Recovery Market is projected to grow at a 5.7% CAGR from 2024 to 2035, driven by technological advancements, increasing oil demand, and environmental regulations.</p>

New opportunities lie in:

  • <p>Investment in carbon capture and storage technologies</p>
  • <p>Development of advanced polymer flooding techniques</p>
  • <p>Expansion of digital oilfield solutions for real-time monitoring</p>

<p>By 2035, the Enhanced Oil Recovery Market is expected to be robust, driven by innovation and strategic investments.</p>

Market Segmentation

Enhanced Oil Recovery Market End Use Outlook

  • Oil Gas Industry
  • Energy Sector
  • Petrochemical Industry

Enhanced Oil Recovery Market Technique Outlook

  • Water Flooding
  • Polymer Flooding
  • In-Situ Combustion
  • Steam Injection

Enhanced Oil Recovery Market Technology Outlook

  • Gas Injection
  • Thermal Recovery
  • Chemical Injection
  • Microbial Enhanced Oil Recovery
  • Combined Cycle Recovery

Enhanced Oil Recovery Market Application Outlook

  • Onshore
  • Offshore
  • Brownfield
  • Greenfield

Report Scope

MARKET SIZE 202444.1(USD Billion)
MARKET SIZE 202546.61(USD Billion)
MARKET SIZE 203581.16(USD Billion)
COMPOUND ANNUAL GROWTH RATE (CAGR)5.7% (2024 - 2035)
REPORT COVERAGERevenue Forecast, Competitive Landscape, Growth Factors, and Trends
BASE YEAR2024
Market Forecast Period2025 - 2035
Historical Data2019 - 2024
Market Forecast UnitsUSD Billion
Key Companies ProfiledMarket analysis in progress
Segments CoveredMarket segmentation analysis in progress
Key Market OpportunitiesIntegration of advanced technologies enhances efficiency in the Enhanced Oil Recovery Market.
Key Market DynamicsTechnological advancements and regulatory shifts drive innovation and competition in the Enhanced Oil Recovery Market.
Countries CoveredNorth America, Europe, APAC, South America, MEA

FAQs

What is the projected market valuation of the Enhanced Oil Recovery Market by 2035?

The Enhanced Oil Recovery Market is projected to reach a valuation of 81.16 USD Billion by 2035.

What was the market valuation of the Enhanced Oil Recovery Market in 2024?

In 2024, the Enhanced Oil Recovery Market was valued at 44.1 USD Billion.

What is the expected CAGR for the Enhanced Oil Recovery Market during the forecast period 2025 - 2035?

The expected CAGR for the Enhanced Oil Recovery Market during the forecast period 2025 - 2035 is 5.7%.

Which technology segment is projected to have the highest valuation by 2035?

The Thermal Recovery segment is projected to reach a valuation of 23.45 USD Billion by 2035.

What are the projected valuations for the Onshore application segment by 2035?

The Onshore application segment is projected to reach a valuation of 28.0 USD Billion by 2035.

Which technique is expected to show significant growth in the Enhanced Oil Recovery Market?

Water Flooding is expected to show significant growth, with a projected valuation of 28.0 USD Billion by 2035.

  1. SECTION I: EXECUTIVE SUMMARY AND KEY HIGHLIGHTS
    1. EXECUTIVE SUMMARY
      1. Market Overview
      2. Key Findings
      3. Market Segmentation
      4. Competitive Landscape
      5. Challenges and Opportunities
      6. Future Outlook
  2. SECTION II: SCOPING, METHODOLOGY AND MARKET STRUCTURE
    1. MARKET INTRODUCTION
      1. Definition
      2. Scope of the study
    2. RESEARCH METHODOLOGY
      1. Overview
      2. Data Mining
      3. Secondary Research
      4. Primary Research
      5. Forecasting Model
      6. Market Size Estimation
      7. Data Triangulation
      8. Validation
  3. SECTION III: QUALITATIVE ANALYSIS
    1. MARKET DYNAMICS
      1. Overview
      2. Drivers
      3. Restraints
      4. Opportunities
    2. MARKET FACTOR ANALYSIS
      1. Value chain Analysis
      2. Porter's Five Forces Analysis
      3. COVID-19 Impact Analysis
  4. SECTION IV: QUANTITATIVE ANALYSIS
    1. Energy & Power, BY Technology (USD Billion)
      1. Gas Injection
      2. Thermal Recovery
      3. Chemical Injection
      4. Microbial Enhanced Oil Recovery
      5. Combined Cycle Recovery
    2. Energy & Power, BY Application (USD Billion)
      1. Onshore
      2. Offshore
      3. Brownfield
      4. Greenfield
    3. Energy & Power, BY Technique (USD Billion)
      1. Water Flooding
      2. Polymer Flooding
      3. In-Situ Combustion
      4. Steam Injection
    4. Energy & Power, BY End Use (USD Billion)
      1. Oil Gas Industry
      2. Energy Sector
      3. Petrochemical Industry
    5. Energy & Power, BY Region (USD Billion)
      1. North America
      2. Europe
      3. APAC
      4. South America
      5. MEA
  5. SECTION V: COMPETITIVE ANALYSIS
    1. Competitive Landscape
      1. Overview
      2. Competitive Analysis
      3. Market share Analysis
      4. Major Growth Strategy in the Energy & Power
      5. Competitive Benchmarking
      6. Leading Players in Terms of Number of Developments in the Energy & Power
      7. Key developments and growth strategies
      8. Major Players Financial Matrix
    2. Company Profiles
      1. ExxonMobil (US)
      2. Chevron (US)
      3. Royal Dutch Shell (GB)
      4. BP (GB)
      5. TotalEnergies (FR)
      6. ConocoPhillips (US)
      7. Eni (IT)
      8. Occidental Petroleum (US)
      9. Suncor Energy (CA)
    3. Appendix
      1. References
      2. Related Reports
  6. LIST OF FIGURES
    1. MARKET SYNOPSIS
    2. NORTH AMERICA MARKET ANALYSIS
    3. US MARKET ANALYSIS BY TECHNOLOGY
    4. US MARKET ANALYSIS BY APPLICATION
    5. US MARKET ANALYSIS BY TECHNIQUE
    6. US MARKET ANALYSIS BY END USE
    7. CANADA MARKET ANALYSIS BY TECHNOLOGY
    8. CANADA MARKET ANALYSIS BY APPLICATION
    9. CANADA MARKET ANALYSIS BY TECHNIQUE
    10. CANADA MARKET ANALYSIS BY END USE
    11. EUROPE MARKET ANALYSIS
    12. GERMANY MARKET ANALYSIS BY TECHNOLOGY
    13. GERMANY MARKET ANALYSIS BY APPLICATION
    14. GERMANY MARKET ANALYSIS BY TECHNIQUE
    15. GERMANY MARKET ANALYSIS BY END USE
    16. UK MARKET ANALYSIS BY TECHNOLOGY
    17. UK MARKET ANALYSIS BY APPLICATION
    18. UK MARKET ANALYSIS BY TECHNIQUE
    19. UK MARKET ANALYSIS BY END USE
    20. FRANCE MARKET ANALYSIS BY TECHNOLOGY
    21. FRANCE MARKET ANALYSIS BY APPLICATION
    22. FRANCE MARKET ANALYSIS BY TECHNIQUE
    23. FRANCE MARKET ANALYSIS BY END USE
    24. RUSSIA MARKET ANALYSIS BY TECHNOLOGY
    25. RUSSIA MARKET ANALYSIS BY APPLICATION
    26. RUSSIA MARKET ANALYSIS BY TECHNIQUE
    27. RUSSIA MARKET ANALYSIS BY END USE
    28. ITALY MARKET ANALYSIS BY TECHNOLOGY
    29. ITALY MARKET ANALYSIS BY APPLICATION
    30. ITALY MARKET ANALYSIS BY TECHNIQUE
    31. ITALY MARKET ANALYSIS BY END USE
    32. SPAIN MARKET ANALYSIS BY TECHNOLOGY
    33. SPAIN MARKET ANALYSIS BY APPLICATION
    34. SPAIN MARKET ANALYSIS BY TECHNIQUE
    35. SPAIN MARKET ANALYSIS BY END USE
    36. REST OF EUROPE MARKET ANALYSIS BY TECHNOLOGY
    37. REST OF EUROPE MARKET ANALYSIS BY APPLICATION
    38. REST OF EUROPE MARKET ANALYSIS BY TECHNIQUE
    39. REST OF EUROPE MARKET ANALYSIS BY END USE
    40. APAC MARKET ANALYSIS
    41. CHINA MARKET ANALYSIS BY TECHNOLOGY
    42. CHINA MARKET ANALYSIS BY APPLICATION
    43. CHINA MARKET ANALYSIS BY TECHNIQUE
    44. CHINA MARKET ANALYSIS BY END USE
    45. INDIA MARKET ANALYSIS BY TECHNOLOGY
    46. INDIA MARKET ANALYSIS BY APPLICATION
    47. INDIA MARKET ANALYSIS BY TECHNIQUE
    48. INDIA MARKET ANALYSIS BY END USE
    49. JAPAN MARKET ANALYSIS BY TECHNOLOGY
    50. JAPAN MARKET ANALYSIS BY APPLICATION
    51. JAPAN MARKET ANALYSIS BY TECHNIQUE
    52. JAPAN MARKET ANALYSIS BY END USE
    53. SOUTH KOREA MARKET ANALYSIS BY TECHNOLOGY
    54. SOUTH KOREA MARKET ANALYSIS BY APPLICATION
    55. SOUTH KOREA MARKET ANALYSIS BY TECHNIQUE
    56. SOUTH KOREA MARKET ANALYSIS BY END USE
    57. MALAYSIA MARKET ANALYSIS BY TECHNOLOGY
    58. MALAYSIA MARKET ANALYSIS BY APPLICATION
    59. MALAYSIA MARKET ANALYSIS BY TECHNIQUE
    60. MALAYSIA MARKET ANALYSIS BY END USE
    61. THAILAND MARKET ANALYSIS BY TECHNOLOGY
    62. THAILAND MARKET ANALYSIS BY APPLICATION
    63. THAILAND MARKET ANALYSIS BY TECHNIQUE
    64. THAILAND MARKET ANALYSIS BY END USE
    65. INDONESIA MARKET ANALYSIS BY TECHNOLOGY
    66. INDONESIA MARKET ANALYSIS BY APPLICATION
    67. INDONESIA MARKET ANALYSIS BY TECHNIQUE
    68. INDONESIA MARKET ANALYSIS BY END USE
    69. REST OF APAC MARKET ANALYSIS BY TECHNOLOGY
    70. REST OF APAC MARKET ANALYSIS BY APPLICATION
    71. REST OF APAC MARKET ANALYSIS BY TECHNIQUE
    72. REST OF APAC MARKET ANALYSIS BY END USE
    73. SOUTH AMERICA MARKET ANALYSIS
    74. BRAZIL MARKET ANALYSIS BY TECHNOLOGY
    75. BRAZIL MARKET ANALYSIS BY APPLICATION
    76. BRAZIL MARKET ANALYSIS BY TECHNIQUE
    77. BRAZIL MARKET ANALYSIS BY END USE
    78. MEXICO MARKET ANALYSIS BY TECHNOLOGY
    79. MEXICO MARKET ANALYSIS BY APPLICATION
    80. MEXICO MARKET ANALYSIS BY TECHNIQUE
    81. MEXICO MARKET ANALYSIS BY END USE
    82. ARGENTINA MARKET ANALYSIS BY TECHNOLOGY
    83. ARGENTINA MARKET ANALYSIS BY APPLICATION
    84. ARGENTINA MARKET ANALYSIS BY TECHNIQUE
    85. ARGENTINA MARKET ANALYSIS BY END USE
    86. REST OF SOUTH AMERICA MARKET ANALYSIS BY TECHNOLOGY
    87. REST OF SOUTH AMERICA MARKET ANALYSIS BY APPLICATION
    88. REST OF SOUTH AMERICA MARKET ANALYSIS BY TECHNIQUE
    89. REST OF SOUTH AMERICA MARKET ANALYSIS BY END USE
    90. MEA MARKET ANALYSIS
    91. GCC COUNTRIES MARKET ANALYSIS BY TECHNOLOGY
    92. GCC COUNTRIES MARKET ANALYSIS BY APPLICATION
    93. GCC COUNTRIES MARKET ANALYSIS BY TECHNIQUE
    94. GCC COUNTRIES MARKET ANALYSIS BY END USE
    95. SOUTH AFRICA MARKET ANALYSIS BY TECHNOLOGY
    96. SOUTH AFRICA MARKET ANALYSIS BY APPLICATION
    97. SOUTH AFRICA MARKET ANALYSIS BY TECHNIQUE
    98. SOUTH AFRICA MARKET ANALYSIS BY END USE
    99. REST OF MEA MARKET ANALYSIS BY TECHNOLOGY
    100. REST OF MEA MARKET ANALYSIS BY APPLICATION
    101. REST OF MEA MARKET ANALYSIS BY TECHNIQUE
    102. REST OF MEA MARKET ANALYSIS BY END USE
    103. KEY BUYING CRITERIA OF ENERGY & POWER
    104. RESEARCH PROCESS OF MRFR
    105. DRO ANALYSIS OF ENERGY & POWER
    106. DRIVERS IMPACT ANALYSIS: ENERGY & POWER
    107. RESTRAINTS IMPACT ANALYSIS: ENERGY & POWER
    108. SUPPLY / VALUE CHAIN: ENERGY & POWER
    109. ENERGY & POWER, BY TECHNOLOGY, 2024 (% SHARE)
    110. ENERGY & POWER, BY TECHNOLOGY, 2024 TO 2035 (USD Billion)
    111. ENERGY & POWER, BY APPLICATION, 2024 (% SHARE)
    112. ENERGY & POWER, BY APPLICATION, 2024 TO 2035 (USD Billion)
    113. ENERGY & POWER, BY TECHNIQUE, 2024 (% SHARE)
    114. ENERGY & POWER, BY TECHNIQUE, 2024 TO 2035 (USD Billion)
    115. ENERGY & POWER, BY END USE, 2024 (% SHARE)
    116. ENERGY & POWER, BY END USE, 2024 TO 2035 (USD Billion)
    117. BENCHMARKING OF MAJOR COMPETITORS
  7. LIST OF TABLES
    1. LIST OF ASSUMPTIONS
    2. North America MARKET SIZE ESTIMATES; FORECAST
      1. BY TECHNOLOGY, 2025-2035 (USD Billion)
      2. BY APPLICATION, 2025-2035 (USD Billion)
      3. BY TECHNIQUE, 2025-2035 (USD Billion)
      4. BY END USE, 2025-2035 (USD Billion)
    3. US MARKET SIZE ESTIMATES; FORECAST
      1. BY TECHNOLOGY, 2025-2035 (USD Billion)
      2. BY APPLICATION, 2025-2035 (USD Billion)
      3. BY TECHNIQUE, 2025-2035 (USD Billion)
      4. BY END USE, 2025-2035 (USD Billion)
    4. Canada MARKET SIZE ESTIMATES; FORECAST
      1. BY TECHNOLOGY, 2025-2035 (USD Billion)
      2. BY APPLICATION, 2025-2035 (USD Billion)
      3. BY TECHNIQUE, 2025-2035 (USD Billion)
      4. BY END USE, 2025-2035 (USD Billion)
    5. Europe MARKET SIZE ESTIMATES; FORECAST
      1. BY TECHNOLOGY, 2025-2035 (USD Billion)
      2. BY APPLICATION, 2025-2035 (USD Billion)
      3. BY TECHNIQUE, 2025-2035 (USD Billion)
      4. BY END USE, 2025-2035 (USD Billion)
    6. Germany MARKET SIZE ESTIMATES; FORECAST
      1. BY TECHNOLOGY, 2025-2035 (USD Billion)
      2. BY APPLICATION, 2025-2035 (USD Billion)
      3. BY TECHNIQUE, 2025-2035 (USD Billion)
      4. BY END USE, 2025-2035 (USD Billion)
    7. UK MARKET SIZE ESTIMATES; FORECAST
      1. BY TECHNOLOGY, 2025-2035 (USD Billion)
      2. BY APPLICATION, 2025-2035 (USD Billion)
      3. BY TECHNIQUE, 2025-2035 (USD Billion)
      4. BY END USE, 2025-2035 (USD Billion)
    8. France MARKET SIZE ESTIMATES; FORECAST
      1. BY TECHNOLOGY, 2025-2035 (USD Billion)
      2. BY APPLICATION, 2025-2035 (USD Billion)
      3. BY TECHNIQUE, 2025-2035 (USD Billion)
      4. BY END USE, 2025-2035 (USD Billion)
    9. Russia MARKET SIZE ESTIMATES; FORECAST
      1. BY TECHNOLOGY, 2025-2035 (USD Billion)
      2. BY APPLICATION, 2025-2035 (USD Billion)
      3. BY TECHNIQUE, 2025-2035 (USD Billion)
      4. BY END USE, 2025-2035 (USD Billion)
    10. Italy MARKET SIZE ESTIMATES; FORECAST
      1. BY TECHNOLOGY, 2025-2035 (USD Billion)
      2. BY APPLICATION, 2025-2035 (USD Billion)
      3. BY TECHNIQUE, 2025-2035 (USD Billion)
      4. BY END USE, 2025-2035 (USD Billion)
    11. Spain MARKET SIZE ESTIMATES; FORECAST
      1. BY TECHNOLOGY, 2025-2035 (USD Billion)
      2. BY APPLICATION, 2025-2035 (USD Billion)
      3. BY TECHNIQUE, 2025-2035 (USD Billion)
      4. BY END USE, 2025-2035 (USD Billion)
    12. Rest of Europe MARKET SIZE ESTIMATES; FORECAST
      1. BY TECHNOLOGY, 2025-2035 (USD Billion)
      2. BY APPLICATION, 2025-2035 (USD Billion)
      3. BY TECHNIQUE, 2025-2035 (USD Billion)
      4. BY END USE, 2025-2035 (USD Billion)
    13. APAC MARKET SIZE ESTIMATES; FORECAST
      1. BY TECHNOLOGY, 2025-2035 (USD Billion)
      2. BY APPLICATION, 2025-2035 (USD Billion)
      3. BY TECHNIQUE, 2025-2035 (USD Billion)
      4. BY END USE, 2025-2035 (USD Billion)
    14. China MARKET SIZE ESTIMATES; FORECAST
      1. BY TECHNOLOGY, 2025-2035 (USD Billion)
      2. BY APPLICATION, 2025-2035 (USD Billion)
      3. BY TECHNIQUE, 2025-2035 (USD Billion)
      4. BY END USE, 2025-2035 (USD Billion)
    15. India MARKET SIZE ESTIMATES; FORECAST
      1. BY TECHNOLOGY, 2025-2035 (USD Billion)
      2. BY APPLICATION, 2025-2035 (USD Billion)
      3. BY TECHNIQUE, 2025-2035 (USD Billion)
      4. BY END USE, 2025-2035 (USD Billion)
    16. Japan MARKET SIZE ESTIMATES; FORECAST
      1. BY TECHNOLOGY, 2025-2035 (USD Billion)
      2. BY APPLICATION, 2025-2035 (USD Billion)
      3. BY TECHNIQUE, 2025-2035 (USD Billion)
      4. BY END USE, 2025-2035 (USD Billion)
    17. South Korea MARKET SIZE ESTIMATES; FORECAST
      1. BY TECHNOLOGY, 2025-2035 (USD Billion)
      2. BY APPLICATION, 2025-2035 (USD Billion)
      3. BY TECHNIQUE, 2025-2035 (USD Billion)
      4. BY END USE, 2025-2035 (USD Billion)
    18. Malaysia MARKET SIZE ESTIMATES; FORECAST
      1. BY TECHNOLOGY, 2025-2035 (USD Billion)
      2. BY APPLICATION, 2025-2035 (USD Billion)
      3. BY TECHNIQUE, 2025-2035 (USD Billion)
      4. BY END USE, 2025-2035 (USD Billion)
    19. Thailand MARKET SIZE ESTIMATES; FORECAST
      1. BY TECHNOLOGY, 2025-2035 (USD Billion)
      2. BY APPLICATION, 2025-2035 (USD Billion)
      3. BY TECHNIQUE, 2025-2035 (USD Billion)
      4. BY END USE, 2025-2035 (USD Billion)
    20. Indonesia MARKET SIZE ESTIMATES; FORECAST
      1. BY TECHNOLOGY, 2025-2035 (USD Billion)
      2. BY APPLICATION, 2025-2035 (USD Billion)
      3. BY TECHNIQUE, 2025-2035 (USD Billion)
      4. BY END USE, 2025-2035 (USD Billion)
    21. Rest of APAC MARKET SIZE ESTIMATES; FORECAST
      1. BY TECHNOLOGY, 2025-2035 (USD Billion)
      2. BY APPLICATION, 2025-2035 (USD Billion)
      3. BY TECHNIQUE, 2025-2035 (USD Billion)
      4. BY END USE, 2025-2035 (USD Billion)
    22. South America MARKET SIZE ESTIMATES; FORECAST
      1. BY TECHNOLOGY, 2025-2035 (USD Billion)
      2. BY APPLICATION, 2025-2035 (USD Billion)
      3. BY TECHNIQUE, 2025-2035 (USD Billion)
      4. BY END USE, 2025-2035 (USD Billion)
    23. Brazil MARKET SIZE ESTIMATES; FORECAST
      1. BY TECHNOLOGY, 2025-2035 (USD Billion)
      2. BY APPLICATION, 2025-2035 (USD Billion)
      3. BY TECHNIQUE, 2025-2035 (USD Billion)
      4. BY END USE, 2025-2035 (USD Billion)
    24. Mexico MARKET SIZE ESTIMATES; FORECAST
      1. BY TECHNOLOGY, 2025-2035 (USD Billion)
      2. BY APPLICATION, 2025-2035 (USD Billion)
      3. BY TECHNIQUE, 2025-2035 (USD Billion)
      4. BY END USE, 2025-2035 (USD Billion)
    25. Argentina MARKET SIZE ESTIMATES; FORECAST
      1. BY TECHNOLOGY, 2025-2035 (USD Billion)
      2. BY APPLICATION, 2025-2035 (USD Billion)
      3. BY TECHNIQUE, 2025-2035 (USD Billion)
      4. BY END USE, 2025-2035 (USD Billion)
    26. Rest of South America MARKET SIZE ESTIMATES; FORECAST
      1. BY TECHNOLOGY, 2025-2035 (USD Billion)
      2. BY APPLICATION, 2025-2035 (USD Billion)
      3. BY TECHNIQUE, 2025-2035 (USD Billion)
      4. BY END USE, 2025-2035 (USD Billion)
    27. MEA MARKET SIZE ESTIMATES; FORECAST
      1. BY TECHNOLOGY, 2025-2035 (USD Billion)
      2. BY APPLICATION, 2025-2035 (USD Billion)
      3. BY TECHNIQUE, 2025-2035 (USD Billion)
      4. BY END USE, 2025-2035 (USD Billion)
    28. GCC Countries MARKET SIZE ESTIMATES; FORECAST
      1. BY TECHNOLOGY, 2025-2035 (USD Billion)
      2. BY APPLICATION, 2025-2035 (USD Billion)
      3. BY TECHNIQUE, 2025-2035 (USD Billion)
      4. BY END USE, 2025-2035 (USD Billion)
    29. South Africa MARKET SIZE ESTIMATES; FORECAST
      1. BY TECHNOLOGY, 2025-2035 (USD Billion)
      2. BY APPLICATION, 2025-2035 (USD Billion)
      3. BY TECHNIQUE, 2025-2035 (USD Billion)
      4. BY END USE, 2025-2035 (USD Billion)
    30. Rest of MEA MARKET SIZE ESTIMATES; FORECAST
      1. BY TECHNOLOGY, 2025-2035 (USD Billion)
      2. BY APPLICATION, 2025-2035 (USD Billion)
      3. BY TECHNIQUE, 2025-2035 (USD Billion)
      4. BY END USE, 2025-2035 (USD Billion)
    31. PRODUCT LAUNCH/PRODUCT DEVELOPMENT/APPROVAL
    32. ACQUISITION/PARTNERSHIP

Enhanced Oil Recovery Market Segmentation

Enhanced Oil Recovery Market By Technology (USD Billion, 2019-2032)

Gas Injection

Thermal Recovery

Chemical Injection

Microbial Enhanced Oil Recovery

Combined Cycle Recovery

Enhanced Oil Recovery Market By Application (USD Billion, 2019-2032)

Onshore

Offshore

Brownfield

Greenfield

Enhanced Oil Recovery Market By Technique (USD Billion, 2019-2032)

Water Flooding

Polymer Flooding

In-Situ Combustion

Steam Injection

Enhanced Oil Recovery Market By End Use (USD Billion, 2019-2032)

Oil Gas Industry

Energy Sector

Petrochemical Industry

Enhanced Oil Recovery Market By Regional (USD Billion, 2019-2032)

North America

Europe

South America

Asia Pacific

Middle East and Africa

Enhanced Oil Recovery Market Regional Outlook (USD Billion, 2019-2032)

North America Outlook (USD Billion, 2019-2032)

North America Enhanced Oil Recovery Market by Technology Type

Gas Injection

Thermal Recovery

Chemical Injection

Microbial Enhanced Oil Recovery

Combined Cycle Recovery

North America Enhanced Oil Recovery Market by Application Type

Onshore

Offshore

Brownfield

Greenfield

North America Enhanced Oil Recovery Market by Technique Type

Water Flooding

Polymer Flooding

In-Situ Combustion

Steam Injection

North America Enhanced Oil Recovery Market by End Use Type

Oil Gas Industry

Energy Sector

Petrochemical Industry

North America Enhanced Oil Recovery Market by Regional Type

US

Canada

US Outlook (USD Billion, 2019-2032)

US Enhanced Oil Recovery Market by Technology Type

Gas Injection

Thermal Recovery

Chemical Injection

Microbial Enhanced Oil Recovery

Combined Cycle Recovery

US Enhanced Oil Recovery Market by Application Type

Onshore

Offshore

Brownfield

Greenfield

US Enhanced Oil Recovery Market by Technique Type

Water Flooding

Polymer Flooding

In-Situ Combustion

Steam Injection

US Enhanced Oil Recovery Market by End Use Type

Oil Gas Industry

Energy Sector

Petrochemical Industry

CANADA Outlook (USD Billion, 2019-2032)

CANADA Enhanced Oil Recovery Market by Technology Type

Gas Injection

Thermal Recovery

Chemical Injection

Microbial Enhanced Oil Recovery

Combined Cycle Recovery

CANADA Enhanced Oil Recovery Market by Application Type

Onshore

Offshore

Brownfield

Greenfield

CANADA Enhanced Oil Recovery Market by Technique Type

Water Flooding

Polymer Flooding

In-Situ Combustion

Steam Injection

CANADA Enhanced Oil Recovery Market by End Use Type

Oil Gas Industry

Energy Sector

Petrochemical Industry
Europe Outlook (USD Billion, 2019-2032)

Europe Enhanced Oil Recovery Market by Technology Type

Gas Injection

Thermal Recovery

Chemical Injection

Microbial Enhanced Oil Recovery

Combined Cycle Recovery

Europe Enhanced Oil Recovery Market by Application Type

Onshore

Offshore

Brownfield

Greenfield

Europe Enhanced Oil Recovery Market by Technique Type

Water Flooding

Polymer Flooding

In-Situ Combustion

Steam Injection

Europe Enhanced Oil Recovery Market by End Use Type

Oil Gas Industry

Energy Sector

Petrochemical Industry

Europe Enhanced Oil Recovery Market by Regional Type

Germany

UK

France

Russia

Italy

Spain

Rest of Europe

GERMANY Outlook (USD Billion, 2019-2032)

GERMANY Enhanced Oil Recovery Market by Technology Type

Gas Injection

Thermal Recovery

Chemical Injection

Microbial Enhanced Oil Recovery

Combined Cycle Recovery

GERMANY Enhanced Oil Recovery Market by Application Type

Onshore

Offshore

Brownfield

Greenfield

GERMANY Enhanced Oil Recovery Market by Technique Type

Water Flooding

Polymer Flooding

In-Situ Combustion

Steam Injection

GERMANY Enhanced Oil Recovery Market by End Use Type

Oil Gas Industry

Energy Sector

Petrochemical Industry

UK Outlook (USD Billion, 2019-2032)

UK Enhanced Oil Recovery Market by Technology Type

Gas Injection

Thermal Recovery

Chemical Injection

Microbial Enhanced Oil Recovery

Combined Cycle Recovery

UK Enhanced Oil Recovery Market by Application Type

Onshore

Offshore

Brownfield

Greenfield

UK Enhanced Oil Recovery Market by Technique Type

Water Flooding

Polymer Flooding

In-Situ Combustion

Steam Injection

UK Enhanced Oil Recovery Market by End Use Type

Oil Gas Industry

Energy Sector

Petrochemical Industry

FRANCE Outlook (USD Billion, 2019-2032)

FRANCE Enhanced Oil Recovery Market by Technology Type

Gas Injection

Thermal Recovery

Chemical Injection

Microbial Enhanced Oil Recovery

Combined Cycle Recovery

FRANCE Enhanced Oil Recovery Market by Application Type

Onshore

Offshore

Brownfield

Greenfield

FRANCE Enhanced Oil Recovery Market by Technique Type

Water Flooding

Polymer Flooding

In-Situ Combustion

Steam Injection

FRANCE Enhanced Oil Recovery Market by End Use Type

Oil Gas Industry

Energy Sector

Petrochemical Industry

RUSSIA Outlook (USD Billion, 2019-2032)

RUSSIA Enhanced Oil Recovery Market by Technology Type

Gas Injection

Thermal Recovery

Chemical Injection

Microbial Enhanced Oil Recovery

Combined Cycle Recovery

RUSSIA Enhanced Oil Recovery Market by Application Type

Onshore

Offshore

Brownfield

Greenfield

RUSSIA Enhanced Oil Recovery Market by Technique Type

Water Flooding

Polymer Flooding

In-Situ Combustion

Steam Injection

RUSSIA Enhanced Oil Recovery Market by End Use Type

Oil Gas Industry

Energy Sector

Petrochemical Industry
ITALY Outlook (USD Billion, 2019-2032)

ITALY Enhanced Oil Recovery Market by Technology Type

Gas Injection

Thermal Recovery

Chemical Injection

Microbial Enhanced Oil Recovery

Combined Cycle Recovery

ITALY Enhanced Oil Recovery Market by Application Type

Onshore

Offshore

Brownfield

Greenfield

ITALY Enhanced Oil Recovery Market by Technique Type

Water Flooding

Polymer Flooding

In-Situ Combustion

Steam Injection

ITALY Enhanced Oil Recovery Market by End Use Type

Oil Gas Industry

Energy Sector

Petrochemical Industry
SPAIN Outlook (USD Billion, 2019-2032)

SPAIN Enhanced Oil Recovery Market by Technology Type

Gas Injection

Thermal Recovery

Chemical Injection

Microbial Enhanced Oil Recovery

Combined Cycle Recovery

SPAIN Enhanced Oil Recovery Market by Application Type

Onshore

Offshore

Brownfield

Greenfield

SPAIN Enhanced Oil Recovery Market by Technique Type

Water Flooding

Polymer Flooding

In-Situ Combustion

Steam Injection

SPAIN Enhanced Oil Recovery Market by End Use Type

Oil Gas Industry

Energy Sector

Petrochemical Industry

REST OF EUROPE Outlook (USD Billion, 2019-2032)

REST OF EUROPE Enhanced Oil Recovery Market by Technology Type

Gas Injection

Thermal Recovery

Chemical Injection

Microbial Enhanced Oil Recovery

Combined Cycle Recovery

REST OF EUROPE Enhanced Oil Recovery Market by Application Type

Onshore

Offshore

Brownfield

Greenfield

REST OF EUROPE Enhanced Oil Recovery Market by Technique Type

Water Flooding

Polymer Flooding

In-Situ Combustion

Steam Injection

REST OF EUROPE Enhanced Oil Recovery Market by End Use Type

Oil Gas Industry

Energy Sector

Petrochemical Industry

APAC Outlook (USD Billion, 2019-2032)

APAC Enhanced Oil Recovery Market by Technology Type

Gas Injection

Thermal Recovery

Chemical Injection

Microbial Enhanced Oil Recovery

Combined Cycle Recovery

APAC Enhanced Oil Recovery Market by Application Type

Onshore

Offshore

Brownfield

Greenfield

APAC Enhanced Oil Recovery Market by Technique Type

Water Flooding

Polymer Flooding

In-Situ Combustion

Steam Injection

APAC Enhanced Oil Recovery Market by End Use Type

Oil Gas Industry

Energy Sector

Petrochemical Industry

APAC Enhanced Oil Recovery Market by Regional Type

China

India

Japan

South Korea

Malaysia

Thailand

Indonesia

Rest of APAC

CHINA Outlook (USD Billion, 2019-2032)

CHINA Enhanced Oil Recovery Market by Technology Type

Gas Injection

Thermal Recovery

Chemical Injection

Microbial Enhanced Oil Recovery

Combined Cycle Recovery

CHINA Enhanced Oil Recovery Market by Application Type

Onshore

Offshore

Brownfield

Greenfield

CHINA Enhanced Oil Recovery Market by Technique Type

Water Flooding

Polymer Flooding

In-Situ Combustion

Steam Injection

CHINA Enhanced Oil Recovery Market by End Use Type

Oil Gas Industry

Energy Sector

Petrochemical Industry

INDIA Outlook (USD Billion, 2019-2032)

INDIA Enhanced Oil Recovery Market by Technology Type

Gas Injection

Thermal Recovery

Chemical Injection

Microbial Enhanced Oil Recovery

Combined Cycle Recovery

INDIA Enhanced Oil Recovery Market by Application Type

Onshore

Offshore

Brownfield

Greenfield

INDIA Enhanced Oil Recovery Market by Technique Type

Water Flooding

Polymer Flooding

In-Situ Combustion

Steam Injection

INDIA Enhanced Oil Recovery Market by End Use Type

Oil Gas Industry

Energy Sector

Petrochemical Industry

JAPAN Outlook (USD Billion, 2019-2032)

JAPAN Enhanced Oil Recovery Market by Technology Type

Gas Injection

Thermal Recovery

Chemical Injection

Microbial Enhanced Oil Recovery

Combined Cycle Recovery

JAPAN Enhanced Oil Recovery Market by Application Type

Onshore

Offshore

Brownfield

Greenfield

JAPAN Enhanced Oil Recovery Market by Technique Type

Water Flooding

Polymer Flooding

In-Situ Combustion

Steam Injection

JAPAN Enhanced Oil Recovery Market by End Use Type

Oil Gas Industry

Energy Sector

Petrochemical Industry

SOUTH KOREA Outlook (USD Billion, 2019-2032)

SOUTH KOREA Enhanced Oil Recovery Market by Technology Type

Gas Injection

Thermal Recovery

Chemical Injection

Microbial Enhanced Oil Recovery

Combined Cycle Recovery

SOUTH KOREA Enhanced Oil Recovery Market by Application Type

Onshore

Offshore

Brownfield

Greenfield

SOUTH KOREA Enhanced Oil Recovery Market by Technique Type

Water Flooding

Polymer Flooding

In-Situ Combustion

Steam Injection

SOUTH KOREA Enhanced Oil Recovery Market by End Use Type

Oil Gas Industry

Energy Sector

Petrochemical Industry

MALAYSIA Outlook (USD Billion, 2019-2032)

MALAYSIA Enhanced Oil Recovery Market by Technology Type

Gas Injection

Thermal Recovery

Chemical Injection

Microbial Enhanced Oil Recovery

Combined Cycle Recovery

MALAYSIA Enhanced Oil Recovery Market by Application Type

Onshore

Offshore

Brownfield

Greenfield

MALAYSIA Enhanced Oil Recovery Market by Technique Type

Water Flooding

Polymer Flooding

In-Situ Combustion

Steam Injection

MALAYSIA Enhanced Oil Recovery Market by End Use Type

Oil Gas Industry

Energy Sector

Petrochemical Industry

THAILAND Outlook (USD Billion, 2019-2032)

THAILAND Enhanced Oil Recovery Market by Technology Type

Gas Injection

Thermal Recovery

Chemical Injection

Microbial Enhanced Oil Recovery

Combined Cycle Recovery

THAILAND Enhanced Oil Recovery Market by Application Type

Onshore

Offshore

Brownfield

Greenfield

THAILAND Enhanced Oil Recovery Market by Technique Type

Water Flooding

Polymer Flooding

In-Situ Combustion

Steam Injection

THAILAND Enhanced Oil Recovery Market by End Use Type

Oil Gas Industry

Energy Sector

Petrochemical Industry

INDONESIA Outlook (USD Billion, 2019-2032)

INDONESIA Enhanced Oil Recovery Market by Technology Type

Gas Injection

Thermal Recovery

Chemical Injection

Microbial Enhanced Oil Recovery

Combined Cycle Recovery

INDONESIA Enhanced Oil Recovery Market by Application Type

Onshore

Offshore

Brownfield

Greenfield

INDONESIA Enhanced Oil Recovery Market by Technique Type

Water Flooding

Polymer Flooding

In-Situ Combustion

Steam Injection

INDONESIA Enhanced Oil Recovery Market by End Use Type

Oil Gas Industry

Energy Sector

Petrochemical Industry

REST OF APAC Outlook (USD Billion, 2019-2032)

REST OF APAC Enhanced Oil Recovery Market by Technology Type

Gas Injection

Thermal Recovery

Chemical Injection

Microbial Enhanced Oil Recovery

Combined Cycle Recovery

REST OF APAC Enhanced Oil Recovery Market by Application Type

Onshore

Offshore

Brownfield

Greenfield

REST OF APAC Enhanced Oil Recovery Market by Technique Type

Water Flooding

Polymer Flooding

In-Situ Combustion

Steam Injection

REST OF APAC Enhanced Oil Recovery Market by End Use Type

Oil Gas Industry

Energy Sector

Petrochemical Industry

South America Outlook (USD Billion, 2019-2032)

South America Enhanced Oil Recovery Market by Technology Type

Gas Injection

Thermal Recovery

Chemical Injection

Microbial Enhanced Oil Recovery

Combined Cycle Recovery

South America Enhanced Oil Recovery Market by Application Type

Onshore

Offshore

Brownfield

Greenfield

South America Enhanced Oil Recovery Market by Technique Type

Water Flooding

Polymer Flooding

In-Situ Combustion

Steam Injection

South America Enhanced Oil Recovery Market by End Use Type

Oil Gas Industry

Energy Sector

Petrochemical Industry

South America Enhanced Oil Recovery Market by Regional Type

Brazil

Mexico

Argentina

Rest of South America

BRAZIL Outlook (USD Billion, 2019-2032)

BRAZIL Enhanced Oil Recovery Market by Technology Type

Gas Injection

Thermal Recovery

Chemical Injection

Microbial Enhanced Oil Recovery

Combined Cycle Recovery

BRAZIL Enhanced Oil Recovery Market by Application Type

Onshore

Offshore

Brownfield

Greenfield

BRAZIL Enhanced Oil Recovery Market by Technique Type

Water Flooding

Polymer Flooding

In-Situ Combustion

Steam Injection

BRAZIL Enhanced Oil Recovery Market by End Use Type

Oil Gas Industry

Energy Sector

Petrochemical Industry

MEXICO Outlook (USD Billion, 2019-2032)

MEXICO Enhanced Oil Recovery Market by Technology Type

Gas Injection

Thermal Recovery

Chemical Injection

Microbial Enhanced Oil Recovery

Combined Cycle Recovery

MEXICO Enhanced Oil Recovery Market by Application Type

Onshore

Offshore

Brownfield

Greenfield

MEXICO Enhanced Oil Recovery Market by Technique Type

Water Flooding

Polymer Flooding

In-Situ Combustion

Steam Injection

MEXICO Enhanced Oil Recovery Market by End Use Type

Oil Gas Industry

Energy Sector

Petrochemical Industry

ARGENTINA Outlook (USD Billion, 2019-2032)

ARGENTINA Enhanced Oil Recovery Market by Technology Type

Gas Injection

Thermal Recovery

Chemical Injection

Microbial Enhanced Oil Recovery

Combined Cycle Recovery

ARGENTINA Enhanced Oil Recovery Market by Application Type

Onshore

Offshore

Brownfield

Greenfield

ARGENTINA Enhanced Oil Recovery Market by Technique Type

Water Flooding

Polymer Flooding

In-Situ Combustion

Steam Injection

ARGENTINA Enhanced Oil Recovery Market by End Use Type

Oil Gas Industry

Energy Sector

Petrochemical Industry

REST OF SOUTH AMERICA Outlook (USD Billion, 2019-2032)

REST OF SOUTH AMERICA Enhanced Oil Recovery Market by Technology Type

Gas Injection

Thermal Recovery

Chemical Injection

Microbial Enhanced Oil Recovery

Combined Cycle Recovery

REST OF SOUTH AMERICA Enhanced Oil Recovery Market by Application Type

Onshore

Offshore

Brownfield

Greenfield

REST OF SOUTH AMERICA Enhanced Oil Recovery Market by Technique Type

Water Flooding

Polymer Flooding

In-Situ Combustion

Steam Injection

REST OF SOUTH AMERICA Enhanced Oil Recovery Market by End Use Type

Oil Gas Industry

Energy Sector

Petrochemical Industry

MEA Outlook (USD Billion, 2019-2032)

MEA Enhanced Oil Recovery Market by Technology Type

Gas Injection

Thermal Recovery

Chemical Injection

Microbial Enhanced Oil Recovery

Combined Cycle Recovery

MEA Enhanced Oil Recovery Market by Application Type

Onshore

Offshore

Brownfield

Greenfield

MEA Enhanced Oil Recovery Market by Technique Type

Water Flooding

Polymer Flooding

In-Situ Combustion

Steam Injection

MEA Enhanced Oil Recovery Market by End Use Type

Oil Gas Industry

Energy Sector

Petrochemical Industry

MEA Enhanced Oil Recovery Market by Regional Type

GCC Countries

South Africa

Rest of MEA

GCC COUNTRIES Outlook (USD Billion, 2019-2032)

GCC COUNTRIES Enhanced Oil Recovery Market by Technology Type

Gas Injection

Thermal Recovery

Chemical Injection

Microbial Enhanced Oil Recovery

Combined Cycle Recovery

GCC COUNTRIES Enhanced Oil Recovery Market by Application Type

Onshore

Offshore

Brownfield

Greenfield

GCC COUNTRIES Enhanced Oil Recovery Market by Technique Type

Water Flooding

Polymer Flooding

In-Situ Combustion

Steam Injection

GCC COUNTRIES Enhanced Oil Recovery Market by End Use Type

Oil Gas Industry

Energy Sector

Petrochemical Industry

SOUTH AFRICA Outlook (USD Billion, 2019-2032)

SOUTH AFRICA Enhanced Oil Recovery Market by Technology Type

Gas Injection

Thermal Recovery

Chemical Injection

Microbial Enhanced Oil Recovery

Combined Cycle Recovery

SOUTH AFRICA Enhanced Oil Recovery Market by Application Type

Onshore

Offshore

Brownfield

Greenfield

SOUTH AFRICA Enhanced Oil Recovery Market by Technique Type

Water Flooding

Polymer Flooding

In-Situ Combustion

Steam Injection

SOUTH AFRICA Enhanced Oil Recovery Market by End Use Type

Oil Gas Industry

Energy Sector

Petrochemical Industry

REST OF MEA Outlook (USD Billion, 2019-2032)

REST OF MEA Enhanced Oil Recovery Market by Technology Type

Gas Injection

Thermal Recovery

Chemical Injection

Microbial Enhanced Oil Recovery

Combined Cycle Recovery

REST OF MEA Enhanced Oil Recovery Market by Application Type

Onshore

Offshore

Brownfield

Greenfield

REST OF MEA Enhanced Oil Recovery Market by Technique Type

Water Flooding

Polymer Flooding

In-Situ Combustion

Steam Injection

REST OF MEA Enhanced Oil Recovery Market by End Use Type

Oil Gas Industry

Energy Sector

Petrochemical Industry


Infographic

Free Sample Request

Kindly complete the form below to receive a free sample of this Report

Get Free Sample

Customer Strories

“I am very pleased with how market segments have been defined in a relevant way for my purposes (such as "Portable Freezers & refrigerators" and "last-mile"). In general the report is well structured. Thanks very much for your efforts.”

Victoria Milne

Founder

Compare Licence

×
Features License Type
Single User Multiuser License Enterprise User
Price $4,950 $5,950 $7,250
Maximum User Access Limit 1 User Upto 10 Users Unrestricted Access Throughout the Organization
Free Customization
Direct Access to Analyst
Deliverable Format
Platform Access
Discount on Next Purchase 10% 15% 15%
Printable Versions