Engineered Wood Market (2026 - 2035)

ID: MRFR/PCM/3364-HCR
111 Pages
Snehal Singh
Last Updated: July 20, 2026
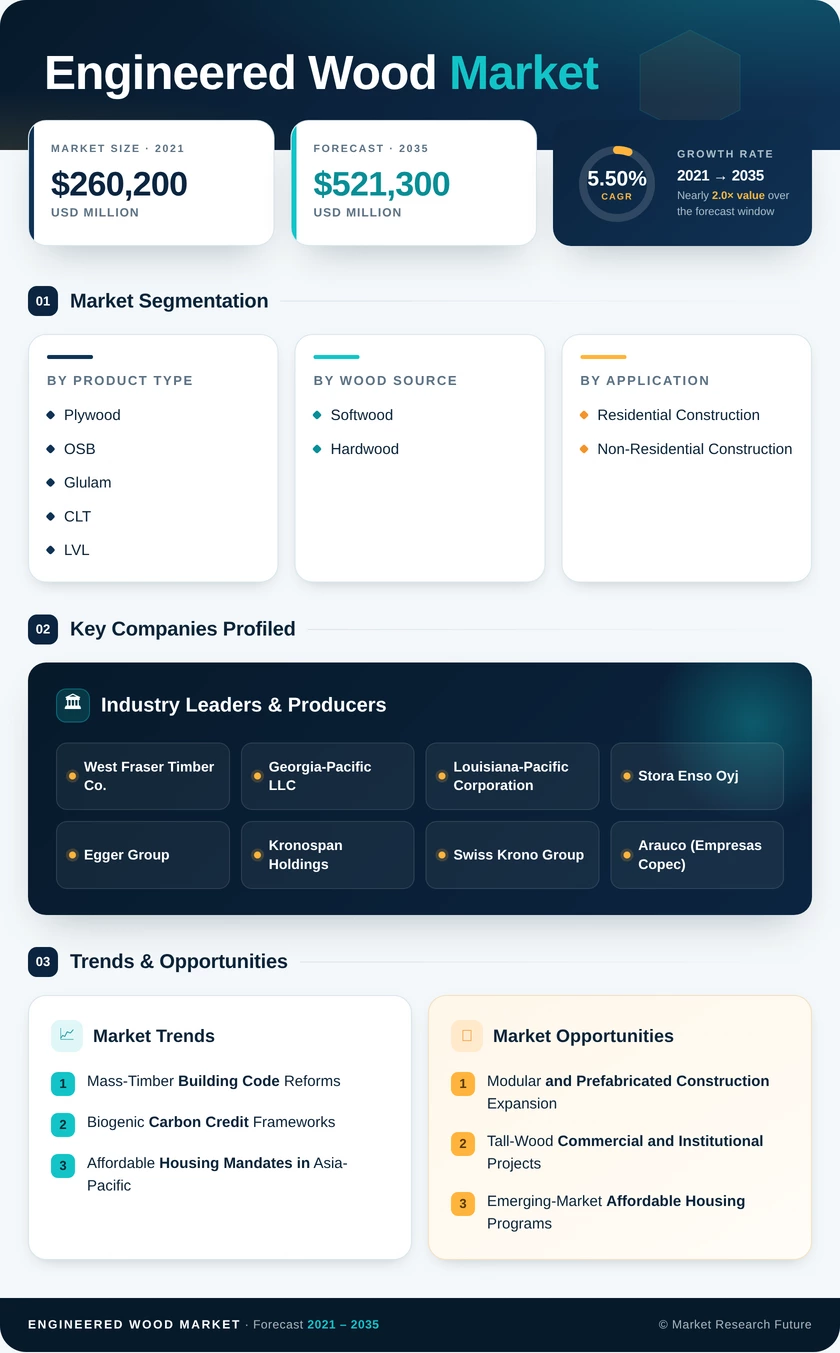
Engineered Wood Market Research Report Information By Product Type (Plywood, OSB, Glulam, CLT, LVL, Particleboard, and Other Products), By Wood Source (Softwood and Hardwood), By Application (Residential Construction and Non-Residential Construction), By End-User Industry (Building & Construction, Furniture Manufacturing, and Others) – Forecast Till 2035
Engineered Wood Market
Market Size
Forecast Period2026-2035
CAGR (2026-2035)5.50%
2025 Market SizeUSD 305,200 Million
2035 Market SizeUSD 521,300 Million
Key Players
West Fraser Timber Co.
Georgia-Pacific LLC
Louisiana-Pacific Corporation
Stora Enso Oyj
Egger Group
Kronospan Holdings
Opportunities
  • Modular and Prefabricated Construction Expansion
  • Tall-Wood Commercial and Institutional Projects
  • Emerging-Market Affordable Housing Programs
  1. 1 Market Overview |
    1. 1.1 Study Assumptions & Market Definition |
    2. 1.2 Scope of the Study |
    3. 1.3 Research Methodology
  2. 2 Market Summary & Key Takeaways
  3. 3 Market Dynamics |
    1. 3.1 Market Drivers Analysis | |
      1. 3.1.1 Mass-Timber Building Code Reforms | |
      2. 3.1.2 Biogenic Carbon Credit Frameworks | |
      3. 3.1.3 Affordable Housing Mandates in Asia-Pacific | |
      4. 3.1.4 Formaldehyde Emission Regulations | |
      5. 3.1.5 Prefabrication and Modular Construction Growth | |
      6. 3.1.6 Mill Residue Utilization and Circular Feedstock | |
      7. 3.1.7 Rising Steel and Concrete Costs |
    2. 3.2 Market Restraints Analysis | |
      1. 3.2.1 Illegal Logging and Supply-Chain Opacity | |
      2. 3.2.2 Fire-Code Resistance from Insurance Sector | |
      3. 3.2.3 Volatile Resin and Adhesive Feedstock Costs | |
      4. 3.2.4 Limited Plantation Softwood Supply Growth | |
      5. 3.2.5 Competing Materials Innovation |
    3. 3.3 Market Opportunity Analysis | |
      1. 3.3.1 Modular and Prefabricated Construction Expansion | |
      2. 3.3.2 Tall-Wood Commercial and Institutional Projects | |
      3. 3.3.3 Emerging-Market Affordable Housing Programs | |
      4. 3.3.4 Carbon-Credit Monetization as a Revenue Stream | |
      5. 3.3.5 Digital Twin and Smart-Mill Integration |
    4. 3.4 Industry Value Chain Analysis |
    5. 3.5 Porter's Five Forces Analysis
  4. 4 Global Engineered Wood Market Size & Forecast (2021–2035) |
    1. 4.1 Historical Market Size (2021–2025) |
    2. 4.2 Current & Forecast Market Size (2026–2035) |
    3. 4.3 Market Size by Revenue (USD Million) |
    4. 4.4 Year-over-Year Growth Analysis
  5. 5 Segmentation Analysis |
    1. 5.1 By Product Type | |
      1. 5.1.1 Plywood | |
      2. 5.1.2 OSB | |
      3. 5.1.3 Glulam | |
      4. 5.1.4 CLT | |
      5. 5.1.5 LVL | |
      6. 5.1.6 Particleboard | |
      7. 5.1.7 Other Products |
    2. 5.2 By Wood Source | |
      1. 5.2.1 Softwood | |
      2. 5.2.2 Hardwood |
    3. 5.3 By Application | |
      1. 5.3.1 Residential Construction | |
      2. 5.3.2 Non-Residential Construction |
    4. 5.4 By End-User Industry | |
      1. 5.4.1 Building & Construction | |
      2. 5.4.2 Furniture Manufacturing | |
      3. 5.4.3 Others
  6. 6 Regional Analysis |
    1. 6.1 North America | |
      1. 6.1.1 United States | |
      2. 6.1.2 Canada | |
      3. 6.1.3 Mexico |
    2. 6.2 Europe | |
      1. 6.2.1 Germany | |
      2. 6.2.2 United Kingdom | |
      3. 6.2.3 France | |
      4. 6.2.4 Italy | |
      5. 6.2.5 Spain | |
      6. 6.2.6 Nordic Countries | |
      7. 6.2.7 Russia | |
      8. 6.2.8 Rest of Europe |
    3. 6.3 Asia-Pacific | |
      1. 6.3.1 China | |
      2. 6.3.2 India | |
      3. 6.3.3 Japan | |
      4. 6.3.4 South Korea | |
      5. 6.3.5 ASEAN | |
      6. 6.3.6 Rest of Asia-Pacific |
    4. 6.4 South America | |
      1. 6.4.1 Brazil | |
      2. 6.4.2 Argentina | |
      3. 6.4.3 Rest of South America |
    5. 6.5 Middle East & Africa | |
      1. 6.5.1 Saudi Arabia | |
      2. 6.5.2 UAE | |
      3. 6.5.3 South Africa | |
      4. 6.5.4 Egypt | |
      5. 6.5.5 Rest of MEA
  7. 7 Competitive Landscape |
    1. 7.1 Market Share Analysis (2025) |
    2. 7.2 Competitive Benchmarking Matrix |
    3. 7.3 Company Profiles | |
      1. 7.3.1 Weyerhaeuser Company | |
      2. 7.3.2 West Fraser Timber Co. | |
      3. 7.3.3 Georgia-Pacific LLC | |
      4. 7.3.4 Louisiana-Pacific Corporation | |
      5. 7.3.5 Boise Cascade Company | |
      6. 7.3.6 Stora Enso Oyj | |
      7. 7.3.7 Egger Group | |
      8. 7.3.8 Kronospan Holdings | |
      9. 7.3.9 Swiss Krono Group | |
      10. 7.3.10 Arauco (Empresas Copec)
  8. 8 Future Outlook & Strategic Recommendations (2026–2035) |
    1. 8.1 Digital Mill Operations and AI-Driven Quality Control |
    2. 8.2 Electrification and Embodied-Carbon Mandates |
    3. 8.3 Circular Bioeconomy and Cascading Use Models |
    4. 8.4 ESG Reporting and Sustainable Procurement Standards
  9. 9 Recent Developments & News
  10. 10 Frequently Asked Questions (FAQs)
  11. 11 Report Scope & Methodology |
    1. 11.1 Study Period & Base Year |
    2. 11.2 Data Sources & Citations |
    3. 11.3 Abbreviations
  12. 12 LIST OF TABLES |
  13. TABLE 1 Global Engineered Wood Market Size & Forecast, by Revenue (USD Million), 2021–2035 |
  14. TABLE 2 Global Engineered Wood Market — Year-over-Year Growth Analysis, 2021–2035 |
  15. TABLE 3 Global Engineered Wood Market — Driver Impact Analysis |
  16. TABLE 4 Global Engineered Wood Market — Restraint Impact Analysis |
  17. TABLE 5 Global Engineered Wood Market Size, by Product Type, 2021–2035 (USD Million) |
  18. TABLE 6 Global Engineered Wood Market Size, by Wood Source, 2021–2035 (USD Million) |
  19. TABLE 7 Global Engineered Wood Market Size, by Application, 2021–2035 (USD Million) |
  20. TABLE 8 Global Engineered Wood Market Size, by End-User Industry, 2021–2035 (USD Million) |
  21. TABLE 9 Global Engineered Wood Market Size, by Region, 2021–2035 (USD Million) |
  22. TABLE 10 North America Engineered Wood Market Size, by Country, 2021–2035 (USD Million) |
  23. TABLE 11 Europe Engineered Wood Market Size, by Country, 2021–2035 (USD Million) |
  24. TABLE 12 Asia-Pacific Engineered Wood Market Size, by Country, 2021–2035 (USD Million) |
  25. TABLE 13 South America Engineered Wood Market Size, by Country, 2021–2035 (USD Million) |
  26. TABLE 14 Middle East & Africa Engineered Wood Market Size, by Country, 2021–2035 (USD Million) |
  27. TABLE 15 Competitive Benchmarking Matrix — Global Engineered Wood Market, 2025 |
  28. TABLE 16 Company Profiles — Key Players, Global Engineered Wood Market |
  29. TABLE 17 Recent Developments & Strategic Announcements, 2023–2025 |
  30. TABLE 18 Report Scope & Methodology Summary |
  31. TABLE 19 Detailed Sources and Citations
  32. 13 LIST OF FIGURES |
  33. FIGURE 1 Global Engineered Wood Market Dynamics — Drivers, Restraints, and Opportunities |
  34. FIGURE 2 Industry Value Chain Analysis — Engineered Wood Market |
  35. FIGURE 3 Porter's Five Forces Analysis — Engineered Wood Market |
  36. FIGURE 4 Global Engineered Wood Market Size Trend (USD Million), 2021–2035 |
  37. FIGURE 5 Engineered Wood Market Share, by Product Type (2025) |
  38. FIGURE 6 Engineered Wood Market Share, by Wood Source (2025) |
  39. FIGURE 7 Engineered Wood Market Share, by Application (2025) |
  40. FIGURE 8 Engineered Wood Market Share, by End-User Industry (2025) |
  41. FIGURE 9 Engineered Wood Market Share, by Region (2025) |
  42. FIGURE 10 North America Engineered Wood Market — Country-Level Share (2025) |
  43. FIGURE 11 Europe Engineered Wood Market — Country-Level Share (2025) |
  44. FIGURE 12 Asia-Pacific Engineered Wood Market — Country-Level Share (2025) |
  45. FIGURE 13 South America Engineered Wood Market — Country-Level Share (2025) |
  46. FIGURE 14 Middle East & Africa Engineered Wood Market — Country-Level Share (2025) |
  47. FIGURE 15 Competitive Landscape — Market Concentration and Key Player Positioning

Segmentation Quick Reference

DimensionSub-SegmentsDominant SegmentFastest Growing Segment
Product TypePlywood, OSB, Glulam, CLT, LVL, Particleboard, Other ProductsPlywood (45.5% share, 2025)CLT (13.5% CAGR)
Wood SourceSoftwood, HardwoodSoftwood (76.2% share, 2025)Hardwood (10.4% CAGR)
ApplicationResidential Construction, Non-Residential ConstructionResidential (69.8% share, 2025)Non-Residential (6.10% CAGR)
End-User IndustryBuilding & Construction, Furniture Manufacturing, OthersBuilding & Construction (86.4% share, 2025)Furniture Manufacturing (9.60% CAGR)
GeographyAsia-Pacific, North America, Europe, South America, Middle East & AfricaAsia-Pacific (51.8% share, 2025)North America (6.75% CAGR)


Market Segmentation Overview

By Product Type

Sub-SegmentKey Trend
PlywoodRemains the volume leader driven by sheathing, formwork, and cabinetry applications globally
OSBGrowing as a cost-effective alternative to plywood in wall and roof sheathing
GlulamExpanding in beam and column applications as tall-wood codes broaden adoption
CLTFastest-growing segment, transitioning from niche Scandinavian use to mainstream commercial framing
LVLSteady demand in header beams, structural joists, and scaffold planks
ParticleboardGaining share in furniture manufacturing as cabinet producers switch from solid wood cores
Other ProductsIncludes specialty veneers, I-joists, hardboard, and composite decking


Product-type segmentation reflects the diversity of the Engineered Wood Market, where mature panel categories like plywood and OSB generate the largest volumes while newer structural categories such as CLT and glulam capture the fastest growth driven by mass-timber code adoption and embodied-carbon mandates.

By Wood Source

Sub-SegmentKey Trend
SoftwoodDominates structural applications due to superior long-fiber strength and broad availability
HardwoodGrowing in decorative panels, premium flooring, and furniture-grade applications


Softwood species — primarily spruce, pine, and fir — serve as the raw-material backbone for load-bearing engineered products, while hardwood species command higher prices in appearance-driven applications where grain aesthetics and surface hardness are valued.

By Application

Sub-SegmentKey Trend
Residential ConstructionLargest application, driven by single-family housing and multi-family prefab programs
Non-Residential ConstructionFaster growth as commercial offices and institutional projects adopt mass-timber framing


Residential construction continues to absorb the majority of global volume, though non-residential applications are closing the gap as developers respond to updated building codes and embodied-carbon reporting requirements.

By End-User Industry

Sub-SegmentKey Trend
Building & ConstructionDominates with structural framing, sheathing, and flooring applications
Furniture ManufacturingFastest-growing end-user, shifting from solid wood to particleboard and MDF cores
OthersIncludes packaging, transport crating, and industrial pallet manufacturing


Building and construction will remain the primary demand driver through 2035, while furniture manufacturing is accelerating as kitchen cabinet, office furniture, and retail fixture producers increasingly specify engineered panels for cost and dimensional stability advantages.


Download PDF ×

We do not share your information with anyone. However, we may send you emails based on your report interest from time to time. You may contact us at any time to opt-out.