ID: MRFR/SEM/1149-HCR | February 2021 | Region: Global | 100 pages
Market synopsis
Energy measurement is the measurement of consumption of energy, which is used to determine consumer requirement, and is helpful in better energy management. Advances in technology in energy measurement results in the replacement of traditional utility meters. The demand for high accuracy electric meters from various applications such as commercial or manufacturing industries is increasing and driving the need for smart management. The energy measurement ICs market has witnessed a constant requirement for ICs which are smart enough to measure the overall electric power utilization.
Energy measurement ICs are generally used in energy meters which enables them to measure the energy consumption, using which the energy meters display accurate and real-time readings. Major players such as Analog Devices, Atmel Corporation, Microchip Technology are present in the US which manufacture and supply energy measurement ICs worldwide.
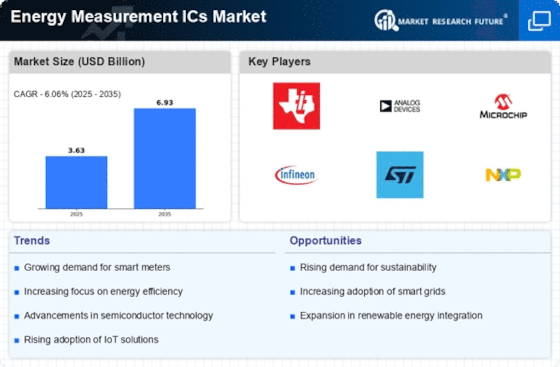
Key drivers for the energy measurement ICs market include increasing adoption of smart appliances, government regulations for energy utilization, and development and innovation in energy measurement technology, which in turn brings the concept of smart meters. Smart meters are electric meters which record the consumption of electric energy and transfer the information to the supplier for monitoring and billing the energy usage of the customer. Smart meters use energy measurement ICs which helps in measuring the electric power consumption and communicating with the suppliers.
The trend in energy measurement is not only to monitor and measure the energy utilization but also to calculate reactive energy measurement, power quality monitoring, and multi-tariff billing, which results in improve power generation, transmission and distribution of electric power, provides protection against electricity theft as well as improve customer billing and services. New technologies in energy measurement ICs are providing various features in energy meters including measurement and monitoring which are expected to drive the market of energy measurement ICs.
By application, the market of energy measurement ICs is segmented into smart plugs, industrial, power monitors for servers, smart appliances, and smart homes in which industrial vertical is dominating the market as it carries out most of the energy measurement work. However, growth is expected for industrial verticals in the forecast period. Moreover, smart plug and smart homes are expected to show tremendous growth for energy measurement ICs market due to increasing demand and advances in technology in smart homes and smart plugs.
Segmentation.
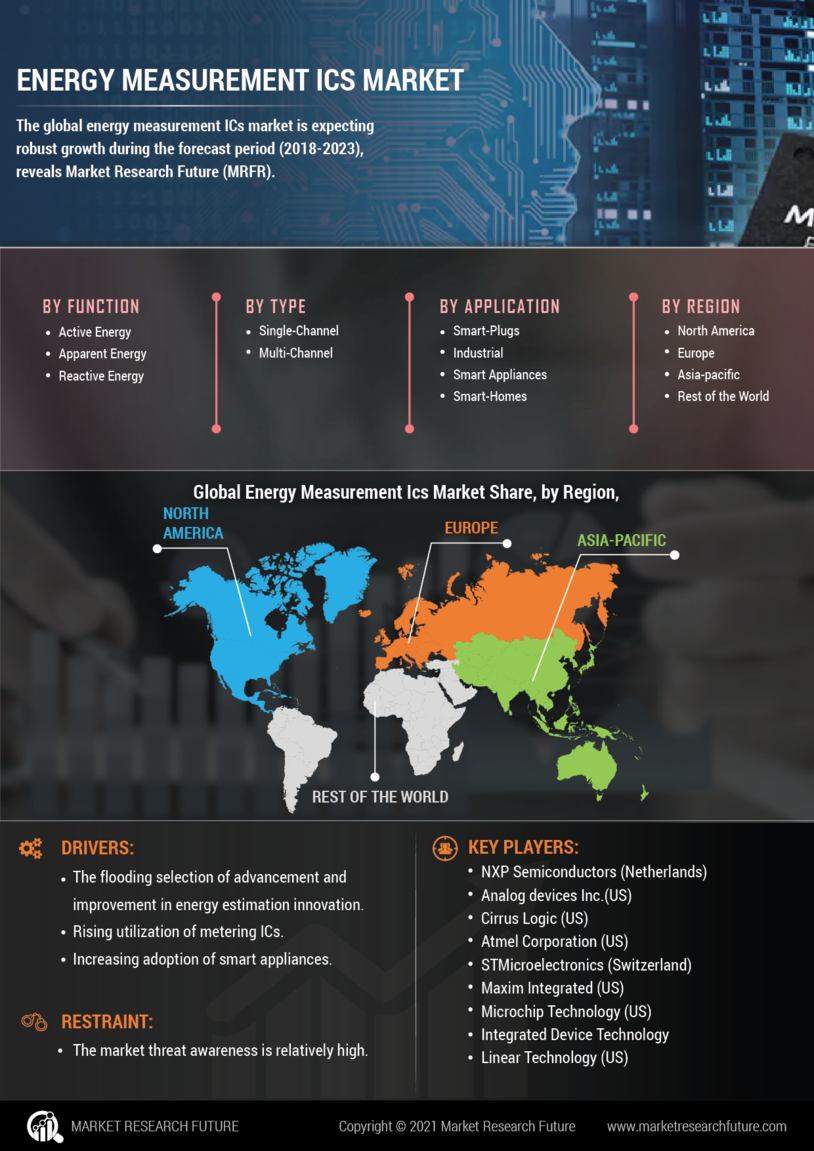
Energy measurement ICs market study aims at different segments such as functions, type, application, and regions, and estimating market growth across these segments.
By function, the market is segmented into active energy (kWh), apparent energy (kVA), reactive energy (kVAR), RMS energy.
By type, the market is segmented into single-channel and multi-channel.
By application, the market is segmented into smart-plugs, industrial, power monitors for servers, smart appliances, smart homes, smart cities
By region, the market is segmented into North America, Europe, Asia-Pacific, the rest of the world.
Regional analysis
The global market for energy measurement ICs is estimated to grow at a significant rate during the forecast period from 2018 to 2023. The geographical analysis of energy measurement ICs market is studied for North America, Europe, Asia-Pacific, and the rest of the world.
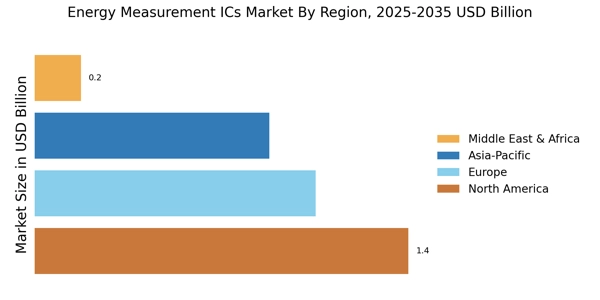
North America is expected to dominate the market due to the presence of major key players such as Analog Devices Inc., Microchip Technology. Active energy measurement ICs is expected to dominate the market in North America due to increasing demand of active power in this region. The European market is expected to show growth in energy measurement ICs market due to growing demand for smart meters for electricity measurement. China, India, and Japan are improving their energy measurement regulations due to which Asia-Pacific is expected to have a high market share in energy measurement ICs market in the forecast period.
Key players
The prominent players in the energy measurement ICs are Analog Devices Inc.(US), NXP Semiconductors (Netherlands), Atmel Corporation (US), Cirrus Logic (US), Maxim Integrated (US), STMicroelectronics (Switzerland), Integrated Device Technology, Inc. (US), Microchip Technology (US), Linear Technology (US).
Intended Audience
IC manufacturer
Electric meter manufacturers.
Chip manufacturers
Power generation companies
Power distribution companies
Smart ICs suppliers and manufacturers
Governments
Frequently Asked Questions (FAQ) :
The two type-based segments of the market are single-channel and multi-channel.
The product is gaining popularity because it facilitates the measurement of the requirement for energy by consumers and also helps in efficient energy management.
The key drivers of the market are - increasing adoption of smart appliances, lenient government regulations for energy utilization, and innovation in energy measurement technology.
The applications of the product are smart plugs, power monitors for servers, industrial, smart appliances, and smart homes.
Some key players in North America are Analog Devices Inc., Atmel Corporation, Maxim Integrated, etc.
TABLE OF CONTENTS
1 Executive Summary
2 Scope of the Report
2.1 Market Definition
2.2 Scope of the Study
2.2.1 Research Objectives
2.2.2 Assumptions & Limitations
2.3 Markets Structure
3 Market Research Methodology
3.1 Research Process
3.2 Secondary Research
3.3 Primary Research
3.4 Forecast Model
4 Market Landscape
4.1 Porter’s Five Forces Analysis
4.1.1 Threat of New Entrants
4.1.2 Bargaining power of buyers
4.1.3 Threat of substitutes
4.1.4 Segment rivalry
4.2 Value Chain/Supply Chain of Global Energy Measurement ICs Market
5 Industry Overview of Global Energy Measurement ICs Market
5.1 Introduction
5.2 Growth Drivers
5.3 Impact Analysis
5.4 Market Challenges
6 Market Trends
6.1 Introduction
6.2 Growth Trends
6.3 Impact analysis
7 Global Energy Measurement ICs Market by Function
7.1 Introduction
7.2 Active Energy
7.2.1 Market Estimates & Forecast, 2018–2023
7.2.2 Market Estimates & Forecast by Region, 2018–2023
7.3 Apparent Energy
7.3.1 Market Estimates & Forecast, 2018–2023
7.3.2 Market Estimates & Forecast by Region, 2018–2023
7.4 Reactive Energy
7.4.1 Market Estimates & Forecast, 2018–2023
7.4.2 Market Estimates & Forecast by Region, 2018–2023
8 Global Energy Measurement ICs Market by Type
8.1 Introduction
8.2 Single-Channel
8.2.1 Market Estimates & Forecast, 2018–2023
8.2.2 Market Estimates & Forecast, by Region, 2018–2023
8.3 Multi-Channel
8.3.1 Market Estimates & Forecast, 2018–2023
8.3.2 Market Estimates & Forecast, by Region, 2018–2023
9 Global Energy Measurement ICs Market by Applications
9.1 Introduction
9.2 Smart-Plugs
9.2.1 Market Estimates & Forecast, 2018–2023
9.2.2 Market Estimates & Forecast, by Region, 2018–2023
9.3 Industrial
9.3.1 Market Estimates & Forecast, 2018–2023
9.3.2 Market Estimates & Forecast, by Region, 2018–2023
9.4 Power Monitors for Servers
9.4.1 Market Estimates & Forecast, 2018–2023
9.4.2 Market Estimates & Forecast, by Region, 2018–2023
9.5 Smart Appliances
9.5.1 Market Estimates & Forecast, 2018–2023
9.5.2 Market Estimates & Forecast, by Region, 2018–2023
9.6 Smart Homes
9.6.1 Market Estimates & Forecast, 2018–2023
9.6.2 Market Estimates & Forecast, by Region, 2018–2023
9.7 Smart Cities
9.7.1 Market Estimates & Forecast, 2018–2023
9.7.2 Market Estimates & Forecast, by Region, 2018–2023
10. Global Energy Measurement ICs Market by Region
10.1 Introduction
10.2 North America
10.2.1 Market Estimates & Forecast, by Country, 2018–2023
10.2.2 Market Estimates & Forecast, by Function, 2018–2023
10.2.3 Market Estimates & Forecast, by Type, 2018–2023
10.2.4 Market Estimates & Forecast, by Applications, 2018–2023
10.2.5 US
10.2.5.1 Market Estimates & Forecast, by Function, 2018–2023
10.2.5.2 Market Estimates & Forecast, by Type, 2018–2023
10.2.5.3 Market Estimates & Forecast, by Applications, 2018–2023
10.2.6 Canada
10.2.6.1 Market Estimates & Forecast, by Function, 2018–2023
10.2.6.2 Market Estimates & Forecast, by Type, 2018–2023
10.2.6.3 Market Estimates & Forecast, by Applications, 2018–2023
102.7 Mexico
10.2.7.1 Market Estimates & Forecast, by Function, 2018–2023
10.2.7.2 Market Estimates & Forecast, by Type, 2018–2023
10.2.7.3 Market Estimates & Forecast, by Applications, 2018–2023
10.3 Europe
10.3.1 Market Estimates & Forecast, Country, 2018–2023
10.3.2 Market Estimates & Forecast, by Function, 2018–2023
10.3.3 Market Estimates & Forecast, by Type, 2018–2023
10.3.4 Market Estimates & Forecast, by Applications, 2018–2023
10.3.5 Germany
10.3.5.1 Market Estimates & Forecast, by Function, 2018–2023
10.3.5.2 Market Estimates & Forecast, by Type, 2018–2023
10.3.5.3 Market Estimates & Forecast, by Applications, 2018–2023
10.3.6 France
10.3.6.1 Market Estimates & Forecast, by Function, 2018–2023
10.3.6.2 Market Estimates & Forecast, by Type, 2018–2023
10.3.6.3 Market Estimates & Forecast, by Applications, 2018–2023
10.3.7 Italy
10.3.7.1 Market Estimates & Forecast, by Function, 2018–2023
10.3.7.2 Market Estimates & Forecast, by Type, 2018–2023
10.3.7.3 Market Estimates & Forecast, by Applications, 2018–2023
10.3.8 Spain
10.3.8.1 Market Estimates & Forecast, by Function, 2018–2023
10.3.8.2 Market Estimates & Forecast, by Type, 2018–2023
10.3.8.3 Market Estimates & Forecast, by Applications, 2018–2023
10.3.9 Rest of Europe
10.3.9.1 Market Estimates & Forecast, by Function, 2018–2023
10.3.9.2 Market Estimates & Forecast, by Type, 2018–2023
10.3.9.3 Market Estimates & Forecast by Applications, 2018–2023
10.4 Asia-Pacific
10.4.1 Market Estimates & Forecast, by Country, 2018–2023
10.4.2 Market Estimates & Forecast, by Function, 2018–2023
10.4.3 Market Estimates & Forecast, by Type, 2018–2023
10.4.4 Market Estimates & Forecast, by Applications, 2018–2023
10.4.5 China
10.4.5.1 Market Estimates & Forecast, by Function, 2018–2023
10.4.5.2 Market Estimates & Forecast, by Type, 2018–2023
10.4.5.3 Market Estimates & Forecast, by Applications, 2018–2023
10.4.6 India
10.4.6.1 Market Estimates & Forecast, by Function, 2018–2023
10.4.6.2 Market Estimates & Forecast, by Type, 2018–2023
10.4.6.3 Market Estimates & Forecast, by Applications, 2018–2023
10.4.7 Japan
10.4.7.1 Market Estimates & Forecast, by Function, 2018–2023
10.4.7.2 Market Estimates & Forecast, by Type, 2018–2023
10.4.7.3 Market Estimates & Forecast, by Applications, 2018–2023
10.4.8 Rest of Asia-Pacific
10.4.8.1 Market Estimates & Forecast, by Function, 2018–2023
10.4.8.2 Market Estimates & Forecast, by Type, 2018–2023
10.4.8.3 Market Estimates & Forecast, by Applications, 2018–2023
10.5 Rest of the World
10.5.1 Market Estimates & Forecast, Country, 2018–2023
10.5.2 Market Estimates & Forecast, by Function, 2018–2023
10.5.3 Market Estimates & Forecast, by Type, 2018–2023
10.5.4 Market Estimates & Forecast, by Applications, 2018–2023
10.5.5 Middle East & Africa
10.5.5.1 Market Estimates & Forecast, by Function, 2018–2023
10.5.5.2 Market Estimates & Forecast, by Type, 2018–2023
10.5.5.3 Market Estimates & Forecast, by Applications, 2018–2023
10.5.6 Latin America
10.5.6.1 Market Estimates & Forecast, by Function, 2018–2023
10.5.6.2 Market Estimates & Forecast, by Type, 2018–2023
10.5.6.3 Market Estimates & Forecast, by Applications, 2018–2023
11 Company Landscape
12 Company Profiles
12.1 Analog Devices Inc
12.1.1 Company Overview
12.1.2 Product/Business Segment Overview
12.1.3 Financial Updates
12.1.4 Key Developments
12.2 NXP Semiconductors
12.2.1 Company Overview
12.2.2 Product/Business Segment Overview
12.2.3 Financial Updates
12.2.4 Key Developments
12.3 Atmel Corporation
12.3.1 Company Overview
12.3.2 Product/Business Segment Overview
12.3.3 Financial Updates
12.3.4 Key Developments
12.4 Cirrus Logic
12.4.1 Company Overview
12.4.2 Product/Business Segment Overview
12.4.3 Financial Updates
12.4.4 Key Developments
12.5 Maxim Integrated
12.5.1 Company Overview
12.5.2 Product/Business Segment Overview
12.5.3 Financial Updates
12.5.4 Key Developments
12.6 STMicroelectronics
12.6.1 Company Overview
12.6.2 Product/Business Segment Overview
12.6.3 Financial Updates
12.6.4 Key Developments
12.7 Integrated Device Technology Inc
12.7.1 Company Overview
12.7.2 Product/Business Segment Overview
12.7.3 Financial Updates
12.7.4 Key Developments
12.8 Microchip Technology
12.8.1 Company Overview
12.8.2 Product/Business Segment Overview
12.8.3 Financial Updates
12.8.4 Key Developments
12.9 Linear Technology
12.9.1 Company Overview
12.9.2 Product/Business Segment Overview
12.9.3 Financial Updates
12.9.4 Key Developments
13 Conclusion
LIST OF TABLES
Table 1 Global Energy Measurement ICs Market, by Region, 2018–2023
Table 2 North America: Energy Measurement ICs Market, by Country, 2018–2023
Table 3 Europe: Energy Measurement ICs Market, by Country, 2018–2023
Table 4 Asia-Pacific: Energy Measurement ICs Market, by Country, 2018–2023
Table 5 Rest of The World: Energy Measurement ICs Market, by Country, 2018–2023
Table 6 Global Energy Measurement ICs Market, by Function 2018–2023
Table 7 North America: Energy Measurement ICs Market, by Function, 2018–2023
Table 8 Europe: Energy Measurement ICs Market, by Function, 2018–2023
Table9 Asia-Pacific: Energy Measurement ICs Market, by Function ,2018–2023
Table10 Rest of the world: Energy Measurement ICs Market, by Function, 2018–2023
Table11 Global Energy Measurement ICs Market, by Type, 2018–2023
Table12 North America: Energy Measurement ICs Market, by Type, 2018–2023
Table12 Europe: Energy Measurement ICs Market, by Type, 2018–2023
Table14 Asia-Pacific: Energy Measurement ICs Market, by Type, 2018–2023
Table15 Rest of the World: Energy Measurement ICs Market, by Type, 2018–2023
Table16 Global Energy Measurement ICs Market, by Application, 2018–2023
Table17 North America: Energy Measurement ICs Market, by Application, 2018–2023
Table18 Europe: Energy Measurement ICs Market, by Application, 2018–2023
Table19 Asia-Pacific: Energy Measurement ICs Market, by Application, 2018–2023
Table20 Rest of the World: Energy Measurement ICs Market, by Application, 2018–2023
LIST OF FIGURES
FIGURE 1 Global Energy Measurement ICs Market Segmentation
FIGURE 2 Forecast Methodology
FIGURE 3 Porter’s Five Forces Analysis of Global Energy Measurement ICs Market
FIGURE 4 Value Chain of Global Energy Measurement ICs Market
FIGURE 5 Share of Global Energy Measurement ICs Market in 2017, by Country (in %)
FIGURE 6 Global Energy Measurement ICs Market, 2018–2023
FIGURE 7 Global Energy Measurement ICs Market Size, by Function, 2018
FIGURE 8 Share of Global Energy Measurement ICs Market, by Function, 2018 to 2023
FIGURE 9 Global Energy Measurement ICs Market Size, by Type, 2018
FIGURE 10 Share of Global Energy Measurement ICs Market, by Type, 2018 to 2023
FIGURE 11 Global Energy Measurement ICs Market Size, by Application, 2018 to 2023
FIGURE 12 Share of Global Energy Measurement ICs Market, by Application, 2018 to 2023