ID: MRFR/E&P/9353-HCR | August 2022 | Region: Global | 100 Pages
TABLE OF CONTENTS
1 Executive Summary
2 Scope of the Report
2.1 Market Definition
2.2 Scope of the Study
2.3 List of Assumptions
2.4 Markets Structure
3 Market Research Methodology
3.1 Research Process
3.2 Primary Research
3.3 Secondary Research
3.4 Market Size Estimation
3.5 Forecast Model
4 Market Factor Analysis
4.1 Supply Chain Analysis
4.1.1 Raw Form Suppliers
4.1.2 Manufacturers/Service Providers of Energy Efficient Motor
4.1.3 Distributors/Retailers/Wholesalers/E-Commerce Merchants
4.1.4 End-Use Industries
4.2 Porterβs Five Forces Model
4.2.1 Threat of New Entrants
4.2.2 Intensity of Competitive Rivalry
4.2.3 Threat of Substitutes
4.2.4 Bargaining Power of Suppliers
4.2.5 Bargaining Power of Buyers
4.3 Pricing Analysis
5 Market Dynamics of Global Energy Efficient Motor Market
5.1 Introduction
5.2 Drivers
5.3 Restraints
5.4 Opportunities
5.5 Challenges
5.6 COVID-19 Impact Analysis on Global Energy Efficient Motor Market
6 Global Energy Efficient Motor Market, by Application
6.1 Introduction
6.2 HVAC
6.2.1 Market Estimates & Forecast, 2018β2030
6.2.2 Market Estimates & Forecast, by Region, 2018β2030
6.3 Fans
6.3.1 Market Estimates & Forecast, 2018β2030
6.3.2 Market Estimates & Forecast, by Region, 2018β2030
6.4 Pumps
6.4.1 Market Estimates & Forecast, 2018β2030
6.4.2 Market Estimates & Forecast, by Region, 2018β2030
6.5 Compressors
6.5.1 Market Estimates & Forecast, 2018β2030
6.5.2 Market Estimates & Forecast, by Region, 2018β2030
6.6 Others
6.6.1 Market Estimates & Forecast, 2018β2030
6.6.2 Market Estimates & Forecast, by Region, 2018β2030
7 Global Energy Efficient Motor Market, by Efficiency Level
7.1 Introduction
7.2 IE1
7.2.1 Market Estimates & Forecast, 2018β2030
7.2.2 Market Estimates & Forecast, by Region, 2018β2030
7.3 IE2
7.3.1 Market Estimates & Forecast, 2018β2030
7.3.2 Market Estimates & Forecast, by Region, 2018β2030
7.4 IE3
7.4.1 Market Estimates & Forecast, 2018β2030
7.4.2 Market Estimates & Forecast, by Region, 2018β2030
7.5 IE4
7.5.1 Market Estimates & Forecast, 2018β2030
7.5.2 Market Estimates & Forecast, by Region, 2018β2030
8 Global Energy Efficient Motor Market, by End Use Industry
8.1 Introduction
8.2 Industrial
8.2.1 Market Estimates & Forecast, 2018β2030
8.2.2 Market Estimates & Forecast, by Region, 2018β2030
8.3 Commercial Building
8.3.1 Market Estimates & Forecast, 2018β2030
8.3.2 Market Estimates & Forecast, by Region, 2018β2030
8.4 Residential
8.4.1 Market Estimates & Forecast, 2018β2030
8.4.2 Market Estimates & Forecast, by Region, 2018β2030
8.5 Automotive
8.5.1 Market Estimates & Forecast, 2018β2030
8.5.2 Market Estimates & Forecast, by Region, 2018β2030
8.6 Others
8.6.1 Market Estimates & Forecast, 2018β2030
8.6.2 Market Estimates & Forecast, by Region, 2018β2030
9 Global Energy Efficient Motor Market, by Region
9.1 Introduction
9.2 North America
9.2.1 Market Estimates & Forecast, 2018β2030
9.2.2 Market Estimates & Forecast, by Application, 2018β2030
9.2.3 Market Estimates & Forecast, by Efficiency Level, 2018β2030
9.2.4 Market Estimates & Forecast, by End Use Industry, 2018β2030
9.2.5 US
9.2.5.1 Market Estimates & Forecast, 2018β2030
9.2.5.2 Market Estimates & Forecast, by Application, 2018β2030
9.2.5.3 Market Estimates & Forecast, by Efficiency Level, 2018β2030
9.2.5.4 Market Estimates & Forecast, by End Use Industry, 2018β2030
9.2.6 Canada
9.2.6.1 Market Estimates & Forecast, 2018β2030
9.2.6.2 Market Estimates & Forecast, by Application, 2018β2030
9.2.6.3 Market Estimates & Forecast, by Efficiency Level, 2018β2030
9.2.6.4 Market Estimates & Forecast, by End Use Industry, 2018β2030
9.3 Europe
9.3.1 Market Estimates & Forecast, 2018β2030
9.3.2 Market Estimates & Forecast, by Application, 2018β2030
9.3.3 Market Estimates & Forecast, by Efficiency Level, 2018β2030
9.3.4 Market Estimates & Forecast, by End Use Industry, 2018β2030
9.3.5 Germany
9.3.5.1 Market Estimates & Forecast, 2018β2030
9.3.5.2 Market Estimates & Forecast, by Application, 2018β2030
9.3.5.3 Market Estimates & Forecast, by Efficiency Level, 2018β2030
9.3.5.4 Market Estimates & Forecast, by End Use Industry, 2018β2030
9.3.6 France
9.3.6.1 Market Estimates & Forecast, 2018β2030
9.3.6.2 Market Estimates & Forecast, by Application, 2018β2030
9.3.6.3 Market Estimates & Forecast, by Efficiency Level, 2018β2030
9.3.6.4 Market Estimates & Forecast, by End Use Industry, 2018β2030
9.3.7 Italy
9.3.7.1 Market Estimates & Forecast, 2018β2030
9.3.7.2 Market Estimates & Forecast, by Application, 2018β2030
9.3.7.3 Market Estimates & Forecast, by Efficiency Level, 2018β2030
9.3.7.4 Market Estimates & Forecast, by End Use Industry, 2018β2030
9.3.8 Spain
9.3.8.1 Market Estimates & Forecast, 2018β2030
9.3.8.2 Market Estimates & Forecast, by Application, 2018β2030
9.3.8.3 Market Estimates & Forecast, by Efficiency Level, 2018β2030
9.3.8.4 Market Estimates & Forecast, by End Use Industry, 2018β2030
9.3.9 UK
9.3.9.1 Market Estimates & Forecast, 2018β2030
9.3.9.2 Market Estimates & Forecast, by Application, 2018β2030
9.3.9.3 Market Estimates & Forecast, by Efficiency Level, 2018β2030
9.3.9.4 Market Estimates & Forecast, by End Use Industry, 2018β2030
9.3.10 Russia
9.3.10.1 Market Estimates & Forecast, 2018β2030
9.3.10.2 Market Estimates & Forecast, by Application, 2018β2030
9.3.10.3 Market Estimates & Forecast, by Efficiency Level, 2018β2030
9.3.10.4 Market Estimates & Forecast, by End Use Industry, 2018β2030
9.3.11 Rest of Europe
9.3.11.1 Market Estimates & Forecast, 2018β2030
9.3.11.2 Market Estimates & Forecast, by Application, 2018β2030
9.3.11.3 Market Estimates & Forecast, by Efficiency Level, 2018β2030
9.3.11.4 Market Estimates & Forecast, by End Use Industry, 2018β2030
9.4 Asia-Pacific
9.4.1.1 Market Estimates & Forecast, 2018β2030
9.4.1.2 Market Estimates & Forecast, by Application, 2018β2030
9.4.1.3 Market Estimates & Forecast, by Efficiency Level, 2018β2030
9.4.1.4 Market Estimates & Forecast, by End Use Industry, 2018β2030
9.4.2 China
9.4.2.1 Market Estimates & Forecast, 2018β2030
9.4.2.2 Market Estimates & Forecast, by Application, 2018β2030
9.4.2.3 Market Estimates & Forecast, by Efficiency Level, 2018β2030
9.4.2.4 Market Estimates & Forecast, by End Use Industry, 2018β2030
9.4.3 India
9.4.3.1 Market Estimates & Forecast, 2018β2030
9.4.3.2 Market Estimates & Forecast, by Application, 2018β2030
9.4.3.3 Market Estimates & Forecast, by Efficiency Level, 2018β2030
9.4.3.4 Market Estimates & Forecast, by End Use Industry, 2018β2030
9.4.4 South Korea
9.4.4.1 Market Estimates & Forecast, 2018β2030
9.4.4.2 Market Estimates & Forecast, by Application, 2018β2030
9.4.4.3 Market Estimates & Forecast, by Efficiency Level, 2018β2030
9.4.4.4 Market Estimates & Forecast, by End Use Industry, 2018β2030
9.4.5 Indonesia
9.4.5.1 Market Estimates & Forecast, 2018β2030
9.4.5.2 Market Estimates & Forecast, by Application, 2018β2030
9.4.5.3 Market Estimates & Forecast, by Efficiency Level, 2018β2030
9.4.5.4 Market Estimates & Forecast, by End Use Industry, 2018β2030
9.4.6 Australia & New Zealand
9.4.6.1 Market Estimates & Forecast, 2018β2030
9.4.6.2 Market Estimates & Forecast, by Application, 2018β2030
9.4.6.3 Market Estimates & Forecast, by Efficiency Level, 2018β2030
9.4.6.4 Market Estimates & Forecast, by End Use Industry, 2018β2030
9.4.7 Rest of Asia-Pacific
9.4.7.1 Market Estimates & Forecast, 2018β2030
9.4.7.2 Market Estimates & Forecast, by Application, 2018β2030
9.4.7.3 Market Estimates & Forecast, by Efficiency Level, 2018β2030
9.4.7.4 Market Estimates & Forecast, by End Use Industry, 2018β2030
9.4.8 Middle East & Africa
9.4.8.1 Market Estimates & Forecast, 2018β2030
9.4.8.2 Market Estimates & Forecast, by Application, 2018β2030
β
9.4.8.3 Market Estimates & Forecast, by Efficiency Level, 2018β2030
9.4.8.4 Market Estimates & Forecast, by End Use Industry, 2018β2030
9.4.9 Turkey
9.4.9.1 Market Estimates & Forecast, 2018β2030
9.4.9.2 Market Estimates & Forecast, by Application, 2018β2030
9.4.9.3 Market Estimates & Forecast, by Efficiency Level, 2018β2030
9.4.9.4 Market Estimates & Forecast, by End Use Industry, 2018β2030
9.4.10 Israel
9.4.10.1 Market Estimates & Forecast, 2018β2030
9.4.10.2 Market Estimates & Forecast, by Application, 2018β2030
9.4.10.3 Market Estimates & Forecast, by Efficiency Level, 2018β2030
9.4.10.4 Market Estimates & Forecast, by End Use Industry, 2018β2030
9.4.11 North Africa
9.4.11.1 Market Estimates & Forecast, 2018β2030
9.4.11.2 Market Estimates & Forecast, by Application, 2018β2030
9.4.11.3 Market Estimates & Forecast, by Efficiency Level, 2018β2030
9.4.11.4 Market Estimates & Forecast, by End Use Industry, 2018β2030
9.4.12 GCC
9.4.12.1 Market Estimates & Forecast, 2018β2030
9.4.12.2 Market Estimates & Forecast, by Application, 2018β2030
9.4.12.3 Market Estimates & Forecast, by Efficiency Level, 2018β2030
9.4.12.4 Market Estimates & Forecast, by End Use Industry, 2018β2030
9.4.13 Rest of the Middle East & Africa
9.4.13.1 Market Estimates & Forecast, 2018β2030
9.4.13.2 Market Estimates & Forecast, by Application, 2018β2030
9.4.13.3 Market Estimates & Forecast, by Efficiency Level, 2018β2030
9.4.13.4 Market Estimates & Forecast, by End Use Industry, 2018β2030
9.5 Latin America
9.5.1.1 Market Estimates & Forecast, 2018β2030
9.5.1.2 Market Estimates & Forecast, by Application, 2018β2030
9.5.1.3 Market Estimates & Forecast, by Efficiency Level, 2018β2030
9.5.1.4 Market Estimates & Forecast, by End Use Industry, 2018β2030
9.5.2 Brazil
9.5.2.1 Market Estimates & Forecast, 2018β2030
9.5.2.2 Market Estimates & Forecast, by Application, 2018β2030
9.5.2.3 Market Estimates & Forecast, by Efficiency Level, 2018β2030
9.5.2.4 Market Estimates & Forecast, by End Use Industry, 2018β2030
9.5.3 Argentina
9.5.3.1 Market Estimates & Forecast, 2018β2030
9.5.3.2 Market Estimates & Forecast, by Application, 2018β2030
9.5.3.3 Market Estimates & Forecast, by Efficiency Level, 2018β2030
9.5.3.4 Market Estimates & Forecast, by End Use Industry, 2018β2030
9.5.4 Mexico
9.5.4.1 Market Estimates & Forecast, 2018β2030
9.5.4.2 Market Estimates & Forecast, by Application, 2018β2030
9.5.4.3 Market Estimates & Forecast, by Efficiency Level, 2018β2030
9.5.4.4 Market Estimates & Forecast, by End Use Industry, 2018β2030
9.5.5 Rest of Latin America
9.5.5.1 Market Estimates & Forecast, 2018β2030
9.5.5.2 Market Estimates & Forecast, by Application, 2018β2030
9.5.5.3 Market Estimates & Forecast, by Efficiency Level, 2018β2030
9.5.5.4 Market Estimates & Forecast, by End Use Industry, 2018β2030
10 Competitive Landscape
10.1 Introduction
10.2 Market Key Strategies
10.3 Key Development Analysis (Expansions/Mergers & Acquisitions/Joint Ventures/New Energy Efficient Motor Developments/Agreements/Investments)
11 Company Profiles
11.1 ABB
11.1.1 Company Overview
11.1.2 Financial Overview
11.1.3 Energy Efficient Motor Offered
11.1.4 Key Developments
11.1.5 SWOT Analysis
11.1.6 Key Strategies
11.2 Siemens
11.3 Rockwell
11.4 Schneider Electric
11.5 Crompton Greaves
11.6 Kirloskar Electric Company Ltd.
11.7 Bosch Rexroth AG
11.8 Regal Beloit Corporation
11.9 Nidec Motor Corporation
11.10 WEG
11.11 HIGEN MOTOR Co., LTD
11.12 NEMA Premium Motors
11.13 AMETEK Inc.
11.14 Johnson Electric
12 Appendix
β
LIST OF TABLES
Table 1: Global Energy Efficient Motor Market, by region, 2018β2030
Table 2: North America: Energy Efficient Motor Market, by Country, 2018β2030
Table 3: Europe: Energy Efficient Motor Market, by Country, 2018β2030
Table 4: Asia-Pacific: Energy Efficient Motor Market, by Country, 2018β2030
Table 5: Latin America: Energy Efficient Motor Market, by Country, 2018β2030
Table 5: Middle East and Africa: Energy Efficient Motor Market, by Country, 2018β2030
Table 7: Global Energy Efficient Motor Efficiency Level Market, by region, 2018β2030
Table 8: North America: Energy Efficient Motor Efficiency Level Market, by Country, 2018β2030
Table 9: Europe: Energy Efficient Motor Efficiency Level Market, by Country, 2018β2030
Table 10: Asia-Pacific: Energy Efficient Motor Efficiency Level Market, by Country, 2018β2030
Table 11: Latin America: Energy Efficient Motor Efficiency Level Market, by Country, 2018β2030
Table 12: Middle East and Africa: Energy Efficient Motor Efficiency Level Market, by Country, 2018β2030
Table 13: Global Energy Efficient Motor End Use Industry Market, by region, 2018β2030
Table 14: North America: Energy Efficient Motor End Use Industry Market, by Country, 2018β2030
Table 15: Europe: Energy Efficient Motor End Use Industry Market, by Country, 2018β2030
Table 16: Asia-Pacific: Energy Efficient Motor End Use Industry Market, by Country, 2018β2030
Table 17: Latin America: Energy Efficient Motor End Use Industry Market, by Country, 2018β2030
Table 18: Middle East and Africa: Energy Efficient Motor End Use Industry Market, by Country, 2018β2030
Table 19: Global Energy Efficient Motor Application Market, by region, 2018β2030
Table 20: North America: Energy Efficient Motor Application Market, by Country, 2018β2030
Table 21: Europe: Energy Efficient Motor Application Market, by Country, 2018β2030
Table 22: Asia-Pacific: Energy Efficient Motor Application Market, by Country, 2018β2030
Table 23: Latin America: Energy Efficient Motor Application Market, by Country, 2018β2030
Table 24: Middle East and Africa: Energy Efficient Motor Application Market, by Country, 2018β2030
Table 25: Global Energy Efficient Motor Efficiency Level Market, by region, 2018β2030
Table 26: Global Energy Efficient Motor Application Market, by region, 2018β2030
Table 26: Global Energy Efficient Motor End Use Industry Market, by region, 2018β2030
Table 27: North America: Energy Efficient Motor Market, by Country, 2018β2030
Table 28: North America: Energy Efficient Motor Market, by Efficiency Level 2018β2030
Table 29: North America: Energy Efficient Motor Market, by Application, 2018β2030
Table 30: North America: Energy Efficient Motor Market, by End Use Industry 2018β2030
Table 31: Europe: Energy Efficient Motor Market, by Country, 2018β2030
Table 32: Europe: Energy Efficient Motor Market, by Application, 2018β2030
Table 33: Europe: Energy Efficient Motor Market, by Efficiency Level, 2018β2030
Table 33: Europe: Energy Efficient Motor Market, by End Use Industry, 2018β2030
Table 34: Asia-Pacific: Energy Efficient Motor Market, by Country, 2018β2030
Table 35: Asia-Pacific: Energy Efficient Motor Market, by Application, 2018β2030
Table 36: Asia-Pacific: Energy Efficient Motor Market, by Efficiency Level, 2018β2030
Table 36: Asia-Pacific: Energy Efficient Motor Market, by End Use Industry, 2018β2030
Table 37: Latin America: Energy Efficient Motor Market, by Country, 2018β2030
Table 38: Latin America: Energy Efficient Motor Market, by Application, 2018β2030
Table 39: Latin America: Energy Efficient Motor Market, by Efficiency Level, 2018β2030
Table 39: Latin America: Energy Efficient Motor Market, by End Use Industry, 2018β2030
Table 40: Middle East and Africa: Energy Efficient Motor Market, by Application, 2018β2030
Table 41: Middle East and Africa: Energy Efficient Motor Market, by Efficiency Level, 2018β2030
Table 42: Middle East and Africa: Energy Efficient Motor Market, by End Use Industry, 2018β2030
LIST OF FIGURES
FIGURE 1 Global Energy Efficient Motor Market Segmentation
FIGURE 2 Forecast Research Methodology
FIGURE 3 Porterβs Five Forces Analysis of Global Energy Efficient Motor Market
FIGURE 4 Value Chain/Supply Chain of Global Energy Efficient Motor Market
FIGURE 5 Share of Global Energy Efficient Motor Market, by Country, 2021 (%)
FIGURE 6 Global Energy Efficient Motor Market, 2018β2030
FIGURE 7 Global Energy Efficient Motor Market Size, by Application, 2018β2030
FIGURE 8 Share of Global Energy Efficient Motor Market, by Application, 2021 (%)
FIGURE 9 Global Energy Efficient Motor Market Size, by Efficiency Level, 2018β2030
FIGURE 10 Share of Global Energy Efficient Motor Market, by Efficiency Level, 2021 (%)
FIGURE 9 Global Energy Efficient Motor Market Size, by End Use Industry, 2018β2030
FIGURE 10 Share of Global Energy Efficient Motor Market, by End Use Industry, 2021 (%)
$62.1 Billion
6.2%
North America
2022β2030
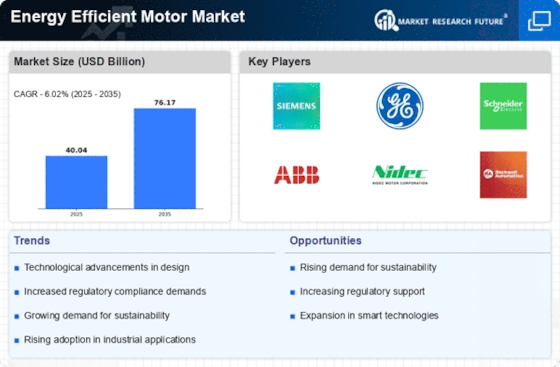
The energy efficient motor market size is projected to be worth USD US$ Bn 62.1 by 2030, registering a CAGR of 6.2% during the forecast period (2022–2030).
Motors that are energy efficient are those that have attributes such as superior materials and enhanced production procedures. Higher service factors, lower waste heat output, longer bearing lives, and less vibration are all characteristics of these motors. These motors improve efficiency by reducing losses, which typically contribute to only 3-6 percent of the energy flowing through the motor.
The increased emphasis on green technology adoption is having a significant impact on global demand for energy-efficient motors. Consumer preferences are being influenced by the advantages that energy-efficient motors offer over regular motors, such as high-quality lamination, insulation, and minimal fan losses. Apart from that, environmental laws and regulations, such as the Environment Protection Act (EP Act), and nonrenewable energy conservation requirements, such as the Minimum Energy Performance Standards (MEPS), are driving up demand for these motors around the world.
Energy Efficient Motor Market Competitive Landscape
The global energy efficient motor market is expected to showcase healthy growth throughout the forecast period. The global market represents strong numbers in terms of consumption and is expected to grow year on year. The global Energy Efficient Motor market is highly fragmented, with a majority presence of tier-1 players.
Some of the key players operating in the global energy efficient motor market are ABB, Siemens, Rockwell, Schneider Electric, Crompton Greaves, Kirloskar Electric Company Ltd., Bosch Rexroth AG, Regal Beloit Corporation, Nidec Motor Corporation, and WEG
Some of the key developments include:
Energy Efficient Motor Market Dynamics
The growing need to reduce greenhouse gas emissions is boosting the demand for energy-efficient solutions, which will drive the expansion of the energy-efficient motor market. Companies are choosing eco-friendly solutions for their technologies and processes as energy conservation becomes more popular. Switching to energy-efficient solutions is one of the most critical factors in reducing greenhouse gas emissions from fossil-fuel-generated electricity.
The aforementioned causes are driving industrial end-users to transition from standard to energy-efficient motors. This would allow governments to maintain natural energy supplies while also considerably reducing greenhouse gas emissions and hazardous pollution. Furthermore, the use of energy-efficient motors saves money for end-users by lowering energy usage. This tendency is expected to continue during the predicted period.
The continued chip shortage (commutator, brushes, axle) and a raw material/component shortfall, especially steel, may have an additional impact on the availability and price of new motor. The shortage of commutators affects the company's price tactics, causing the market to not remain constant and to decline within a particular timeframe.
Highly efficient motors are preferred over regular motors for a variety of reasons, including longer working life, lower energy usage, less maintenance, and greater tolerance to voltage variations. The requirement for greater productivity and reduced power consumption by electric motor applications is predicted to drive up demand for high-efficiency motors. Furthermore, the rise in demand for electric motors from robotics and automated robot technologies is anticipated to provide lucrative opportunities for the growth of the energy-efficient motor market.
The high initial cost needed to set up and operate an energy-efficient motor is still a major challenge, additionally, the overheating problem in energy-efficient motors is challenging the market expansion.
Energy Efficient Motor Market Segmentation
By Application
By Efficiency Level
By End-use Industry
Energy Efficient Motor Market Regional Analysis
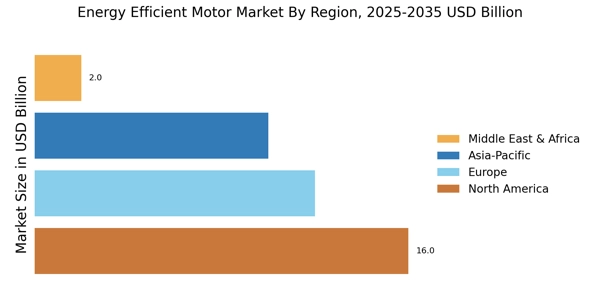
Because of the rising awareness about the effective use of energy within the region, North America dominates the energy efficient motor industry. Because of the different actions implemented by the Department of Energy (DOE) in many countries in the region, Asia-Pacific is predicted to develop significantly from 2022 to 2030. Rising energy prices have increased concern about energy efficiency, and several measures implemented by the Department of Energy (DOE) in various APAC countries are encouraging industries to switch to high-efficiency motors (HEMs) that consume less power, resulting in the growth of the energy efficient motors market in this region.
COVID-19 Impact on the Energy Efficient Motor Market:
The instantaneous spread of COVID-19 has caused considerable disturbance to a wide range of industries across the globe.
The World Health Organization has declared a public health emergency after the COVID-19 virus outbreak in December 2019. The disease has spread to over 100 nations and resulted in massive deaths all across the world. Global manufacturing, tourism, and financial markets have all taken a hit. The downward pressure on the global economy, which had previously shown signs of improvement, has escalated once more. The outbreak of the virus has added danger factors to the international economy's already sluggish growth. Many international groups have stated that the global economy is experiencing its most difficult moment since the financial crisis.
The coronavirus's negative global effects are already evident, and they will have a considerable influence on the Energy Efficient Motor industry in 2020. The influence of Coronavirus COVID-19 on the Energy Efficient Motor business is studied and analyzed in-depth in this paper.
Energy Efficient Motor Market Report Overview:
The energy efficient motor market is segmented by application, end-use industry, efficiency level, and region in the report. In terms of insights, this report has focused on various levels of analysis such as market dynamics, value chain analysis, Porter's five forces, competitive landscape, and company profiles—all of which comprise and discuss views on the global Energy Efficient Motor market emerging and fast-growing segments, regions, and countries.
Intended Audience
Objectives of the Study
Report Attribute/Metric | Details |
---|---|
Market Size | 2030: USD 62.1 Billion |
CAGR | 6.2% CAGR (2022-2030) |
Base Year | 2021 |
Forecast Period | 2022-2030 |
Historical Data | 2020 |
Forecast Units | Value (USD Million) & Volume (Thousand Units) |
Report Coverage | Revenue Forecast, Competitive Landscape, Growth Factors, and Trends |
Segments Covered | Application, and End-use |
Geographies Covered | North America, Europe, Asia-Pacific, Latin America, Middle East and Africa |
Key Vendors | ABB, Siemens, Rockwell, Schneider Electric, Crompton Greaves, Kirloskar Electric Company Ltd., Bosch Rexroth AG, Regal Beloit Corporation, Nidec Motor Corporation, and WEG |
Key Market Opportunities | Improvement in design methods to reduce carbon emissions |
Key Market Drivers | A growing need to reduce the greenhouse effect |
Frequently Asked Questions (FAQ) :
The global energy efficient motor market would register a growth of 6.2 %.
The automotive will play a prominent role in taking the market forward.
The lack of raw materials/components hampered the market.
Asia-pacific would enjoy the upper hand in the energy efficient motor market.
China, as the largest consumer, would set the trend.