Embedded Insurance Market

Key Players: Cover Genius, Bolttech, Chubb, Allianz Partners, Qover, Sure, AXA Partners, Swiss Re (iptiQ)

Embedded Insurance Market

Embedded Insurance Market Size, Share and Research Report By Policy Type (Homeowners, Renters, Auto, Travel, Life), By Distribution Channel (Insurance agents, Online platforms, Financial institutions), By Product Offering (Single product, Bundled insurance), By Application (Automotive, Consumer Electronics, Healthcare, Travel, Fintech) and By Regional (North America, Europe, South America, Asia Pacific, Middle East and Africa) - Industry Forecast Till 2035
ID: MRFR/BS/39312-HCR
200 Pages
Apoorva Priyadarshi, Garvit Vyas
Last Updated: June 22, 2026

Embedded Insurance Market Summary

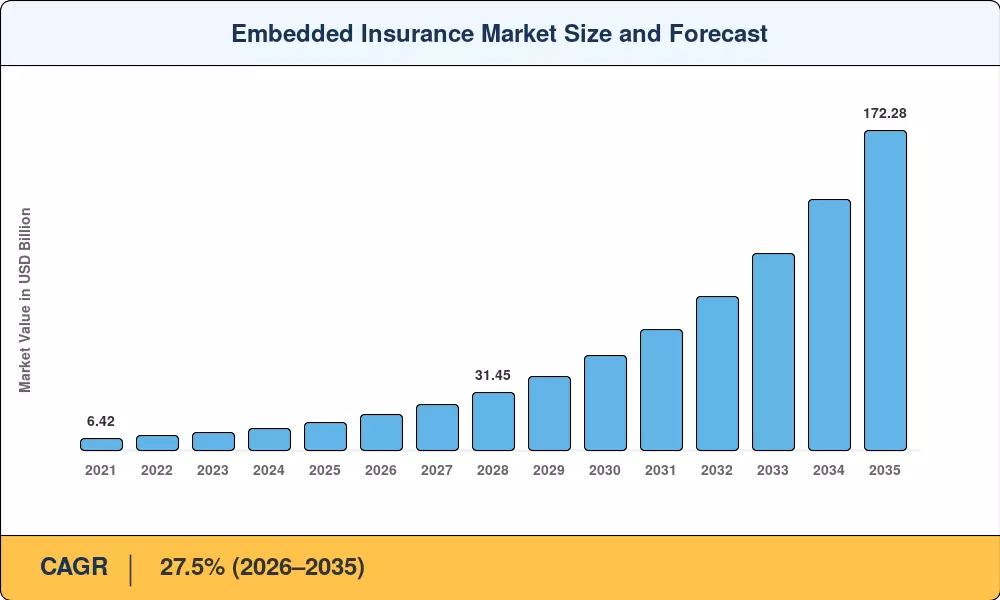
The embedded insurance market reached USD 14.85 billion in 2025 and is projected to grow from USD 19.35 billion in 2026 to USD 172.28 billion by 2035, registering a CAGR of 27.5% during 2026–2035. Two catalysts are accelerating this trajectory: the EU's Insurance Distribution Directive revisions that explicitly recognize non-insurance platform distribution, and a wave of venture capital — over USD 4.2 billion deployed into insurtech infrastructure between 2023 and 2025 — that is building the API rails connecting carriers to digital checkout flows [2]. The embedded insurance market is no longer a niche concept; it is becoming the default distribution paradigm for personal-lines coverage.

What makes this shift structural rather than cyclical is the displacement of legacy broker-intermediated placement by real-time, API-first policy issuance woven directly into purchase journeys. Global e-commerce platforms processed more than USD 6.3 trillion in gross merchandise value in 2024, and every one of those transactions represents a latent insurance touchpoint [3]. Carriers that once relied on agency networks are now competing for integration slots on fintech super-apps and ride-hailing platforms, fundamentally changing how underwriting risk is priced and distributed.

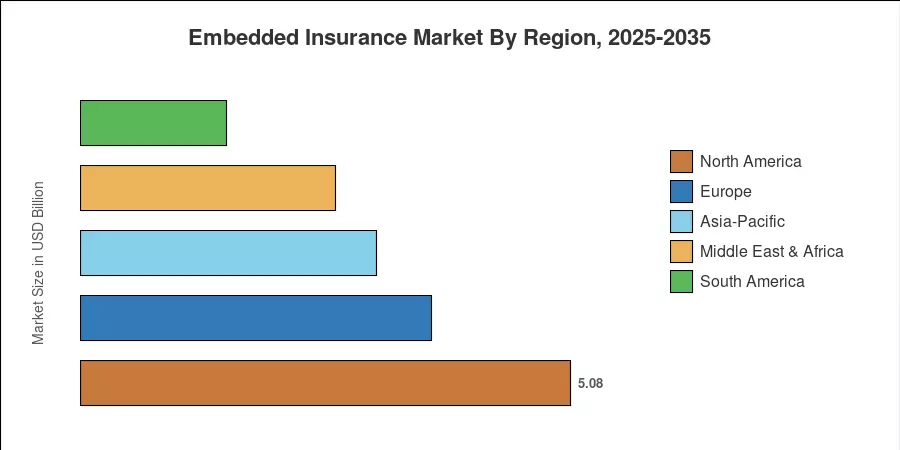
North America commands the largest share of the embedded insurance market at roughly 34.2% of global revenue, anchored by mature digital retail ecosystems and a permissive state-level regulatory framework for program business [4]. Asia-Pacific is the fastest-growing region, expanding at a 20.7% CAGR through 2035 as greenfield digital economies in India, Indonesia, and Vietnam unlock hundreds of millions of first-time insurance buyers through mobile-first platforms. Europe holds the second-largest share at approximately 24.5%, led by open-insurance sandbox programs in Germany and the UK. The next decade will see the embedded insurance market evolve from checkout add-ons into deeply personalized, event-triggered coverage ecosystems.


Key Report Takeaways

• By Insurance Line

  • Electronics protection accounted for approximately 47.9% of the embedded insurance market in 2025, driven by smartphone and laptop attachment rates on global e-commerce sites.
  • Micro auto insurance is projected to grow at a 36.2% CAGR through 2035, fueled by connected-car telematics and pay-per-mile policy structures.
  • Travel and ticketing coverage maintained the second-largest revenue base in the embedded insurance market, reflecting post-pandemic recovery in cross-border bookings.

• By Distribution Channel & Partner Platform

  • Online and API-first placements captured roughly 71.0% of total revenue in the embedded insurance market, with offline bancassurance and retail counter channels comprising the remainder.
  • Vertical SaaS platforms are the fastest-growing partner type, posting a 31.3% CAGR as property-management and fleet-software vendors bundle coverage natively.

• By Region

  • North America led the embedded insurance market with a 34.2% share in 2025.
  • Asia-Pacific is the fastest-growing region at a 20.7% CAGR, propelled by digital-wallet penetration across Southeast Asia.


Embedded Insurance Market Size and Forecast (2021–2035)

Market Research Future's sizing methodology triangulates top-down premium pool modeling with bottom-up platform transaction volumes, validated against carrier-reported embedded program revenues and insurtech funding disclosures. Historical estimates (2021–2024) reflect actual performance; forecast values (2026–2035) apply a calibrated compound growth model with scenario adjustments for regulatory and macroeconomic inputs.

Embedded Insurance Market Size and Forecast
Our Impact
Enabled $4.3B Revenue Impact for Fortune 500 and Leading Multinationals
Partnering with 2000+ Global Organizations Each Year
30K+ Citations by Top-Tier Firms in the Industry

Driver Impact Analysis

Driver ~% Impact on CAGR Geographic Relevance Impact Timeline
API-first architecture proliferation +6.5% Global Short-term (≤2 yr)
Real-time data and dynamic underwriting +5.0% North America, Europe Medium-term (2–4 yr)
Regulatory support for open insurance +4.5% Europe, Asia-Pacific Medium-term (2–4 yr)
Connected-car telematics adoption +3.8% North America, Asia-Pacific Long-term (≥4 yr)
Super-app ecosystem expansion +3.5% Asia-Pacific, South America Medium-term (2–4 yr)
Protection-gap policy mandates +2.8% Global Long-term (≥4 yr)
Cross-border e-commerce growth +2.2% Global Short-term (≤2 yr)


API-First Architecture Proliferation

The shift from file-and-quote legacy systems to RESTful API stacks has compressed insurance product launch timelines from 12–18 months to under 90 days [2]. Platforms like Shopify, which processed over USD 235 billion in GMV during 2024, now offer one-click insurance integration modules that enable merchants to attach shipping protection or extended warranties at checkout without any carrier-side custom development [3]. This infrastructure layer is the single most important near-term accelerant for the embedded insurance market.

Real-Time Data and Dynamic Underwriting

Carriers integrating IoT telemetry, purchase-history signals, and behavioral analytics into pricing engines have reduced loss ratios by 8–12 percentage points on embedded electronics lines compared with traditional rated products [8]. Swiss Re's sigma institute reported that parametric triggers powered by real-time weather and flight-status data cut claims-processing costs by 40% on embedded travel policies [12]. These efficiency gains make embedded distribution profitable even at low average-premium price points.

Regulatory Support for Open Insurance

The European Insurance and Occupational Pensions Authority's open-insurance framework, expected to be finalized by mid-2026, will mandate standardized data-sharing protocols between carriers and distribution platforms [7]. In Asia, Singapore's MAS and India's IRDAI have both launched sandbox programs specifically for embedded distribution models, with over 45 pilot programs approved across the two jurisdictions between 2023 and 2025 [10]. These regulatory green lights reduce compliance friction and encourage platform operators to integrate coverage into their core user journeys.

Connected-Car Telematics Adoption

The global connected-car fleet surpassed 500 million vehicles in 2024, and each vehicle generates roughly 25 gigabytes of driving data per hour [9]. Auto OEMs, including Tesla, Hyundai, and Stellantis, have partnered with carriers to embed usage-based policies directly into infotainment systems, enabling drivers to activate coverage in seconds. This driver positions the embedded insurance market for sustained long-term growth as autonomous-driving features expand the insurable-event surface.


Restraints Impact Analysis

Restraint-impact estimates below reflect directional drag on market growth potential. They represent scenario-modeled headwinds, not precise offsets to the baseline CAGR.

Restraint ~% Impact on CAGR Geographic Relevance Impact Timeline
Data-privacy and consent fragmentation –3.2% Europe, North America Short-term (≤2 yr)
Carrier channel-conflict resistance –2.5% Global Medium-term (2–4 yr)
Low consumer awareness of coverage terms –2.0% Global Long-term (≥4 yr)
Regulatory licensing complexity across borders –1.8% Europe, Asia-Pacific Medium-term (2–4 yr)
Integration fatigue among small platforms –1.2% North America, Europe Short-term (≤2 yr)


Data-Privacy and Consent Fragmentation

The EU's GDPR, California's CCPA/CPRA, and India's DPDP Act each impose distinct consent architectures for personal data used in underwriting [13]. Platforms operating across multiple jurisdictions face overlapping — and sometimes contradictory — requirements for data collection at the point of sale. A 2024 survey found that 38% of mid-market e-commerce operators cited privacy-compliance costs as the primary barrier to activating embedded insurance features [15]. This fragmentation slows rollout timelines and increases per-market integration costs for the embedded insurance market.

Carrier Channel-Conflict Resistance

Traditional carriers derive 55–65% of personal-lines premiums through agent and broker networks [14]. Embedded distribution threatens to disintermediate these channels, creating internal resistance from sales organizations that view API partnerships as margin-dilutive. Several major carriers have restricted embedded program access to non-competing product lines, limiting the breadth of coverage available on digital platforms and constraining growth in the embedded insurance market.

Low Consumer Awareness of Coverage Terms

A 2024 J.D. Power study found that only 29% of consumers who purchased embedded electronics protection could accurately describe what their policy covered [15]. This opacity risk creates post-claim dissatisfaction, regulatory scrutiny, and platform reputational exposure — all of which dampen platform willingness to expand embedded offerings.


Embedded Insurance Market Opportunities

Parametric Micro-Insurance for Climate-Exposed Emerging Economies

Over 1.7 billion individuals in Sub-Saharan Africa and South Asia do not have any type of crop or property insurance [11]. Parametric triggers associated with satellite weather data can underwrite coverage for as low as USD 0.50 a month, distributed via mobile-money wallets already utilized by more than 600 million users in these markets. Embedded insurance is set to unlock a whole new policyholder group.


Vertical SaaS Bundling

Property management software, fleet logistics platforms and healthcare scheduling systems target captive user groups with known risk profiles. Embedding coverage into subscription SaaS workflows – landlord liability baked into property platforms, freight TMS solutions with cargo insurance — produces persistent income streams and sets the embedded insurance industry up for enterprise-grade expansion.


Data Monetization Through Behavioral Risk Scoring

Platforms gathering purchase, usage and claims data on millions of embedded transactions can develop unique risk models which outperform typical actuarial tables [8]. Reinsurers get a new margin layer by licensing these models back in. Munich Re’s Digital Partners business has openly stated its willingness to pay a premium for loss-cost data gathered through platforms. [16]


Embedded Warranty as a Loyalty Mechanism

A 2024 consumer study [17] found that the repeat-purchase rates of loyalty-tier consumers of retailers that automatically activate free warranty coverage are 18-22% higher. This method positions insurance as a client retention tool, not a cost center, and opens up budget lines for marketing departments that were previously out of reach for insurers.


Open-Insurance Marketplace Aggregation

As regulators mandate standardized data portability, neutral aggregation platforms — analogous to open-banking marketplaces — will emerge to match consumer risk profiles with the best-fit embedded product across carriers [7]. Early movers building these aggregation layers will command pricing power across the embedded insurance market.


Embedded Insurance Market Future Outlook

AI-Powered Personalized Underwriting at Scale

Generative AI and large language models will enable real-time policy customization based on contextual signals — browsing behavior, purchase history, IoT telemetry — at the moment of checkout [8]. By 2030, an estimated 60% of embedded policies will be priced by machine-learning models rather than static rate tables, compressing loss ratios and enabling carriers to profitably serve micro-premium segments that were previously uneconomical [16]. The embedded insurance market will increasingly compete on algorithmic sophistication rather than distribution breadth alone.

Platform Economics and Winner-Take-Most Dynamics

Network effects will concentrate embedded-insurance distribution among a handful of mega-platforms — Amazon, Alibaba, Grab, MercadoLibre — that control consumer trust and transaction volume [3]. Carriers lacking API integration capabilities risk becoming commoditized capacity providers, while platforms with proprietary risk data will capture an increasing share of the underwriting margin. This dynamic will reshape competitive positioning across the embedded insurance market through 2035.

Climate Adaptation and Parametric Coverage Expansion

The World Bank estimates that annual climate-related losses will reach USD 580 billion by 2030, yet less than 10% of these losses are currently insured in developing economies [11]. Parametric embedded products — triggered automatically by satellite-verified weather events — offer a scalable solution. Expect parametric embedded coverage to grow from a niche segment to 8–12% of total embedded insurance market revenue by 2035 as mobile-money rails enable instant payouts.

Regulatory Convergence and Global Standards

The IAIS's 2025 working paper on digital distribution recommended a harmonized cross-border licensing framework for embedded products, which would eliminate the jurisdiction-by-jurisdiction approval friction that currently constrains multinational platform rollouts [7]. If adopted, this framework could reduce time-to-market for cross-border embedded programs by 40–60%, significantly expanding the addressable opportunity within the embedded insurance market over the next decade.


Embedded Insurance Market Segmentation

By Insurance Line

Segment Key Metric Primary Demand Driver
Electronics Protection 47.9% share (2025) Smartphone and laptop checkout attachment
Travel & Ticketing USD 3.12 Billion (2025) Post-pandemic cross-border travel rebound
Micro Auto Insurance 36.2% CAGR (2026–2035) Connected-car telematics adoption
Health & Wellness USD 1.08 Billion (2025) Wearable-triggered parametric health products
Property & Rental 29.4% CAGR (2026–2035) PropTech platform integration


Electronics protection remains the dominant line in the embedded insurance market, commanding nearly half of total revenue. Global e-commerce platforms, including Amazon, Flipkart, and Coupang, have standardized extended-warranty and accidental-damage modules at checkout, achieving attachment rates of 15–22% on electronics orders above USD 200 [3]. The insurance embedded in retail and e-commerce checkout flows has become seamless enough that consumers increasingly perceive coverage as a native feature of the purchase rather than a separate financial product.

Micro auto insurance is the fastest-expanding line, benefiting from a structural shift toward pay-per-mile and pay-how-you-drive models enabled by OEM telematics [9]. Tesla's in-dashboard insurance product, launched across 12 US states by 2024, demonstrated that carriers able to access real-time driving data can underwrite risk at 20–30% lower premiums than traditional rated policies, driving rapid consumer adoption.

By Distribution Channel

Segment Key Metric Primary Demand Driver
Online and API-First 71.0% share (2025) Checkout integration and mobile-app embedding
Offline (Bancassurance & Retail) 29.0% share (2025) In-branch and point-of-sale terminal attachment


Online and API-first distribution dominates the embedded insurance market because it eliminates the friction of human-intermediated sales. Carriers that invest in developer-friendly SDKs and sandbox environments report integration timelines of 2–4 weeks with mid-market platforms, compared with 6–9 months for custom offline channel builds [2]. Offline embedded distribution retains relevance in markets where bank-branch density remains high — particularly in parts of South America and the Middle East — but its share is declining steadily.

By End-User Industry

Segment Key Metric Primary Demand Driver
E-Commerce and Marketplaces 48.6% share (2025) Transaction volume and checkout attachment
Travel and Hospitality USD 2.84 Billion (2025) Flight-disruption and trip-cancellation coverage
Mobility and Automotive 30.3% CAGR (2026–2035) OEM telematics and ride-hail integration
Financial Services USD 1.19 Billion (2025) Neobank and BNPL protection products
Real Estate and PropTech 27.6% CAGR (2026–2035) Tenant-insurance platform bundling


E-commerce and marketplaces represent the largest end-user industry in the embedded insurance market, accounting for close to half of total revenue. Amazon's partnership with Asurion for device-protection plans and Shopify's app-store insurance integrations are emblematic of how platform operators monetize the trust relationship they hold with consumers [3]. Travel and hospitality ranks second, buoyed by Booking.com and Expedia embedding trip-protection modules that convert at 12–18% of eligible bookings.

By Partner Platform Type

Segment Key Metric Primary Demand Driver
Marketplaces 46.3% share (2025) Consumer reach and transaction frequency
Vertical SaaS Platforms 31.3% CAGR (2026–2035) Captive user bases with predictable risk profiles
Fintech Platforms USD 2.38 Billion (2025) Neobank, BNPL, and digital-wallet integration
Telecom Platforms 23.8% CAGR (2026–2035) Device-protection bundling with mobile plans


Marketplaces capture the largest platform-type share in the embedded insurance market due to their unmatched transaction volumes and established consumer trust [10]. Vertical SaaS platforms are growing fastest because they serve industry-specific workflows where risk is well-understood and coverage can be priced precisely — fleet-management software embedding cargo liability, or HR platforms embedding group-accident policies for gig workers.


Regional Market Share Analysis

Region Key Metric Primary Investment Themes
North America 34.2% share (2025) E-commerce attachment, connected auto, open-API mandates
Europe USD 3.64 Billion (2025) Open-insurance regulation, PSD2 synergies, travel recovery
Asia-Pacific 20.7% CAGR (2026–2035) Super-app distribution, mobile-money, digital-first carriers
South America USD 1.51 Billion (2025) Fintech wallet penetration, micro-insurance mandates
Middle East & Africa 17.8% CAGR (2026–2035) Insurtech sandbox programs, mobile-money adoption
Total USD 14.85 Billion (2025)

The embedded insurance market displays distinct regional adoption curves shaped by digital-commerce maturity, regulatory posture, and carrier willingness to invest in API infrastructure.


North America

Country Key Metric Key Driver
US 78.4% of regional share Amazon, Walmart, and fintech checkout integrations
Canada USD 0.58 Billion (2025) Open-banking framework enabling insurance API access
Mexico 26.8% CAGR (2026–2035) MercadoLibre-led e-commerce insurance expansion


The US accounts for more than three-quarters of North America's embedded insurance market, driven by the sheer scale of its digital-commerce ecosystem and a state-based regulatory system that permits innovative program structures under managing general agent frameworks [4]. Canada's federal open-banking legislation, enacted in late 2024, created a standardized consent layer that embedded-insurance APIs can leverage, while Mexico's fintech law amendments are accelerating platform-based insurance distribution through digital wallets.

Europe

Country Key Metric Key Driver
Germany 22.6% of regional share Insurtech hub with strong B2B2C carrier adoption
UK USD 0.71 Billion (2025) FCA sandbox and Lloyd's embedded-program facilities
France 18.9% CAGR (2026–2035) ACPR open-insurance pilots and travel platform growth
Italy USD 0.29 Billion (2025) Bancassurance digitization driving embedded uptake
Spain 16.4% CAGR (2026–2035) Insurtech venture surge and tourism-linked coverage
Nordic Countries USD 0.24 Billion (2025) High digital maturity and cashless-society integration
Russia 14.2% CAGR (2026–2035) Domestic super-app ecosystems (Yandex, Sber)
Rest of Europe USD 0.35 Billion (2025) EU-wide IDD harmonization


Europe's regulatory architecture, particularly the forthcoming EIOPA open-insurance framework, positions the continent as the global standard-setter for embedded distribution governance [7]. Germany's insurtech corridor — anchored by Berlin and Munich — has produced several of the embedded insurance market's most prominent API platforms, including Qover and Wefox, while the UK's Financial Conduct Authority sandbox has approved more than 30 embedded-insurance pilot programs since 2022.

Asia-Pacific

Country Key Metric Key Driver
China 31.5% of regional share Ant Group and JD.com ecosystem integration
India 28.4% CAGR (2026–2035) IRDAI sandbox, UPI-linked micro-insurance
Japan USD 0.42 Billion (2025) Carrier digital transformation partnerships
South Korea 24.7% CAGR (2026–2035) Samsung and Kakao super-app insurance modules
ASEAN USD 0.38 Billion (2025) Grab, GoTo, and Sea Group embedded programs
Rest of Asia-Pacific 22.1% CAGR (2026–2035) Mobile-wallet adoption in frontier economies


Asia-Pacific is the fastest-expanding region in the embedded insurance market, propelled by mobile-first consumer behavior and super-app ecosystems that bundle payments, commerce, and coverage into a single interface [10]. India's Unified Payments Interface handled over 13 billion monthly transactions by late 2024, and IRDAI's regulatory sandbox has approved insurance modules within UPI-linked apps — opening a market of 450 million active digital-payment users to embedded products for the first time.

South America

Country Key Metric Key Driver
Brazil 64.2% of regional share Pix-linked insurance and Nubank partnerships
Argentina 21.3% CAGR (2026–2035) MercadoPago embedded-protection rollout
Rest of South America USD 0.22 Billion (2025) Regional fintech wallet expansion


Brazil dominates South America's embedded insurance market, accounting for nearly two-thirds of regional revenue [4]. The Pix instant-payment system, which surpassed 170 million registered users in 2024, has become a natural distribution rail for micro-insurance products embedded at the moment of purchase. Argentina's high smartphone penetration and expanding fintech ecosystem position it as the region's fastest-growing contributor.

Middle East & Africa

Country Key Metric Key Driver
Saudi Arabia 28.8% of regional share Vision 2030 insurtech licensing and digital mandates
UAE USD 0.18 Billion (2025) DIFC sandbox and travel-platform integration
South Africa 19.5% CAGR (2026–2035) Mobile-money insurance via Vodacom and MTN
Egypt 22.1% CAGR (2026–2035) Digital-payment expansion and youth demographics
Rest of MEA USD 0.16 Billion (2025) Telco-bundled insurance micro-products


The Middle East & Africa region offers high-growth potential in the embedded insurance market as mobile-money infrastructure matures and regulators embrace sandbox-style licensing. Saudi Arabia's Insurance Authority issued updated digital-distribution guidelines in 2024 that explicitly accommodate platform-embedded products, while South Africa's mobile-money operators are embedding funeral and crop micro-insurance into prepaid airtime top-up flows [11].


Embedded Insurance Market By Region, 2025-2035

Competitive Benchmarking

The embedded insurance market exhibits moderate concentration. The top five players collectively hold an estimated 28–35% of global revenue, reflecting a fragmented landscape where incumbent carriers compete alongside API-native insurtechs for platform-integration partnerships [14]. The Herfindahl-Hirschman Index sits below 800, indicating a competitive field where no single player dominates. Barriers to entry center on regulatory licensing breadth, API technical reliability, and reinsurance capacity access rather than brand recognition alone.

Company Est. Revenue Share Range Key Offerings Strategic Positioning
Cover Genius ~7–10% XCover platform, 60+ country coverage, API orchestration Global API-first leader with broadest geographic licensing
Bolttech ~6–9% Device protection, embedded life, multi-carrier marketplace Asia-Pacific anchor with rapid international expansion
Chubb ~5–8% Carrier-as-a-platform, white-label embedded programs Incumbent scale with dedicated digital-partnership unit
Allianz Partners ~4–7% Travel, assistance, and embedded mobility coverage Deep travel-platform integration and assistance network
Qover ~3–5% Pan-European embedded API platform, mobility and gig Regulatory-first approach across 32 European markets
Sure ~2–4% Infrastructure-as-a-service for embedded program launch Developer-centric SDK with rapid time-to-market positioning
AXA Partners ~3–5% Travel protection, e-commerce warranty, bancassurance Leveraging AXA's balance sheet for large-platform deals
Swiss Re (iptiQ) ~2–4% B2B2C white-label capacity and digital underwriting Reinsurance-backed capacity with proprietary risk models
Munich Re (Digital Partners) ~2–4% Embedded capacity provision, parametric triggers Data-driven partnerships and parametric product innovation
Wrisk ~1–3% Embedded motor and contents insurance, API platform UK-centric specialist with OEM automotive partnerships


Recent News & Developments


  • Grab Financial Group (July 2024): Partnered with Chubb to embed ride-hail and delivery micro-insurance across 8 Southeast Asian markets, targeting 35 million monthly active drivers and riders [10].


  • Shopify (January 2024): Integrated embedded shipping-protection and extended-warranty modules into its app marketplace, enabling 2 million+ merchants to activate insurance at checkout [3].


Embedded Insurance Market Report Scope

Parameter Detail
Market Scope Global embedded insurance market across all distribution channels, insurance lines, end-user industries, and partner platform types
Study Period 2021–2035
CAGR 27.5% (2026–2035)
Base Year Market Size USD 14.85 Billion (2025)
Forecast Endpoint USD 172.28 Billion (2035)
Fastest Growing Segment Micro Auto Insurance (by insurance line); Asia-Pacific (by geography)
Companies Profiled Cover Genius, Bolttech, Chubb, Allianz Partners, Qover, Sure, AXA Partners, Swiss Re (iptiQ), Munich Re (Digital Partners), Wrisk
Valuation Currency USD Billion


FAQs

How do embedded insurance carriers manage regulatory licensing across 50+ jurisdictions simultaneously?

Leading platforms like Cover Genius maintain local licenses or fronting-carrier arrangements in each jurisdiction, orchestrated through a single API layer [20]. This approach lets partner platforms offer coverage globally without managing compliance individually.

What typical commission structures do platforms earn from embedded insurance integrations?

Platforms generally receive 15–30% of gross written premium as distribution commission, depending on volume commitments and loss-ratio performance [14]. High-volume partners with favorable claims experience negotiate toward the upper range.

How does embedded coverage differ from traditional affinity-group insurance programs?

Embedded products are transactional and triggered at the point of purchase, while affinity programs target pre-existing group memberships with offline enrollment [23]. The real-time, API-driven nature of embedded distribution enables dynamic pricing unavailable in affinity models.

What role do reinsurers play in scaling the embedded insurance market?

Reinsurers like Swiss Re and Munich Re provide capacity backing that enables insurtechs to underwrite at scale without holding large balance sheets [16]. They also supply actuarial modeling support for novel embedded product lines.

How do embedded insurance platforms handle claims processing differently than traditional carriers?

Most platforms use automated first-notice-of-loss systems integrated directly into the host app, resolving 60–70% of low-value claims without human intervention [8]. This reduces settlement times from weeks to under 48 hours.

What metrics should investors track when evaluating embedded insurance market companies?

Key indicators include attachment rate, premium per transaction, loss ratio, and platform-partner retention rate [21]. These metrics reveal both distribution efficiency and underwriting discipline.

How will generative AI reshape product design in the embedded insurance market?

AI enables real-time policy customization using contextual purchase and behavioral data, replacing static product catalogs with dynamic coverage bundles [8]. Early adopters report 25–35% higher attachment rates from personalized offers.    
Author
Author
Author Profile
Apoorva Priyadarshi LinkedIn
Research Analyst
With 4+ years of experience in Market Intelligence and Strategic Research, Apoorv specializes in ICT, Semiconductor, and BFSI markets. Combining strong analytical capabilities with a deep understanding of technology-driven industries, he focuses on delivering data-driven insights that support strategic decision-making. With a background in technology and business research, Apoorv has contributed to numerous global market studies, competitive landscape analyses, and opportunity assessments across sectors such as semiconductors, digital banking, cybersecurity, and telecommunications.
Co-Author
Co-Author Profile
Garvit Vyas LinkedIn
Vice President - Operations
Garvit Vyas is a Research Analyst with experience in working across multiple industry domains in the market research sector. Over the past four years, he has been actively involved in analyzing diverse markets, gathering industry insights, and contributing to the development of comprehensive research reports. His work includes studying market trends, evaluating competitive landscapes, and supporting data-driven business insights. In the early phase of his career, Garvit worked on cross-domain research projects, which helped him build a strong foundation in market analysis, data interpretation, and industry intelligence across various sectors. Later, he transitioned into the Quality Control (QC) function, where he focuses on reviewing and refining research reports and marketing collaterals to ensure accuracy, consistency, and high editorial standards. His responsibilities include validating research data, improving report structure, and maintaining the overall quality of published content. Garvit is committed to maintaining strong research integrity and delivering reliable insights that support informed business decision-making.

Research Approach


Secondary Research

The secondary research process involved comprehensive analysis of regulatory databases, insurance industry publications, fintech reports, and authoritative financial services organizations. Key sources included the National Association of Insurance Commissioners (NAIC), European Insurance and Occupational Pensions Authority (EIOPA), Federal Insurance Office (FIO) - U.S. Department of the Treasury, Bank for International Settlements (BIS), International Association of Insurance Supervisors (IAIS), National Center for Health Statistics (NCHS), Consumer Financial Protection Bureau (CFPB), Federal Trade Commission (FTC) - Consumer Protection Division, Organisation for Economic Co-operation and Development (OECD) Insurance Statistics, World Bank Global Financial Development Database, International Monetary Fund (IMF) Financial Access Survey, EU Eurostat Financial Statistics, UK Financial Conduct Authority (FCA), Monetary Authority of Singapore (MAS), Insurance Regulatory and Development Authority of India (IRDAI), China Banking and Insurance Regulatory Commission (CBIRC), and national insurance regulatory reports from key markets. These sources were used to collect insurance penetration data, regulatory compliance frameworks, digital payment trends, consumer protection guidelines, and market landscape analysis for homeowners, renters, auto, travel, and life insurance embedded distribution models.


Primary Research

In order to gather both qualitative and quantitative insights, supply-side and demand-side stakeholders were interviewed during the primary research process. CEOs, vice presidents of digital transformation, chief underwriting officers, and partnership directors from insurance companies, insurtech platforms, and embedded insurance technology suppliers were among the supply-side sources. Chief digital officers from automakers, e-commerce platform executives, fintech product managers, procurement directors in the travel industry, and merchants of consumer electronics were examples of demand-side sources. Market segmentation, API integration schedules, partnership economics, client acquisition expenses, and platform commission structures were all confirmed by primary research.

Primary Respondent Breakdown:

By Designation: C-level Primaries (28%), Director Level (35%), Others (37%)

By Region: North America (32%), Europe (30%), Asia-Pacific (28%), Rest of World (10%)


Market Size Estimation

Global market valuation was derived through revenue mapping and policy volume analysis. The methodology included:

Identification of 50+ key insurance carriers and insurtech platforms across North America, Europe, Asia-Pacific, and Latin America

Product mapping across homeowners, renters, auto, travel, and life insurance categories by distribution channel (insurance agents, online platforms, financial institutions)

Analysis of reported and modeled annual gross written premiums (GWP) specific to embedded insurance portfolios

Coverage of carriers and platforms representing 75-80% of global embedded insurance market share in 2024

Extrapolation using bottom-up (policy volume × average premium by country) and top-down (carrier GWP validation) approaches to derive segment-specific valuations for single product and bundled insurance offerings across automotive, consumer electronics, healthcare, travel, and fintech applications

Download Free Sample

Kindly complete the form below to receive a free sample of this Report

Download PDF ×

We do not share your information with anyone. However, we may send you emails based on your report interest from time to time. You may contact us at any time to opt-out.