Electrochromic Glass Market Summary
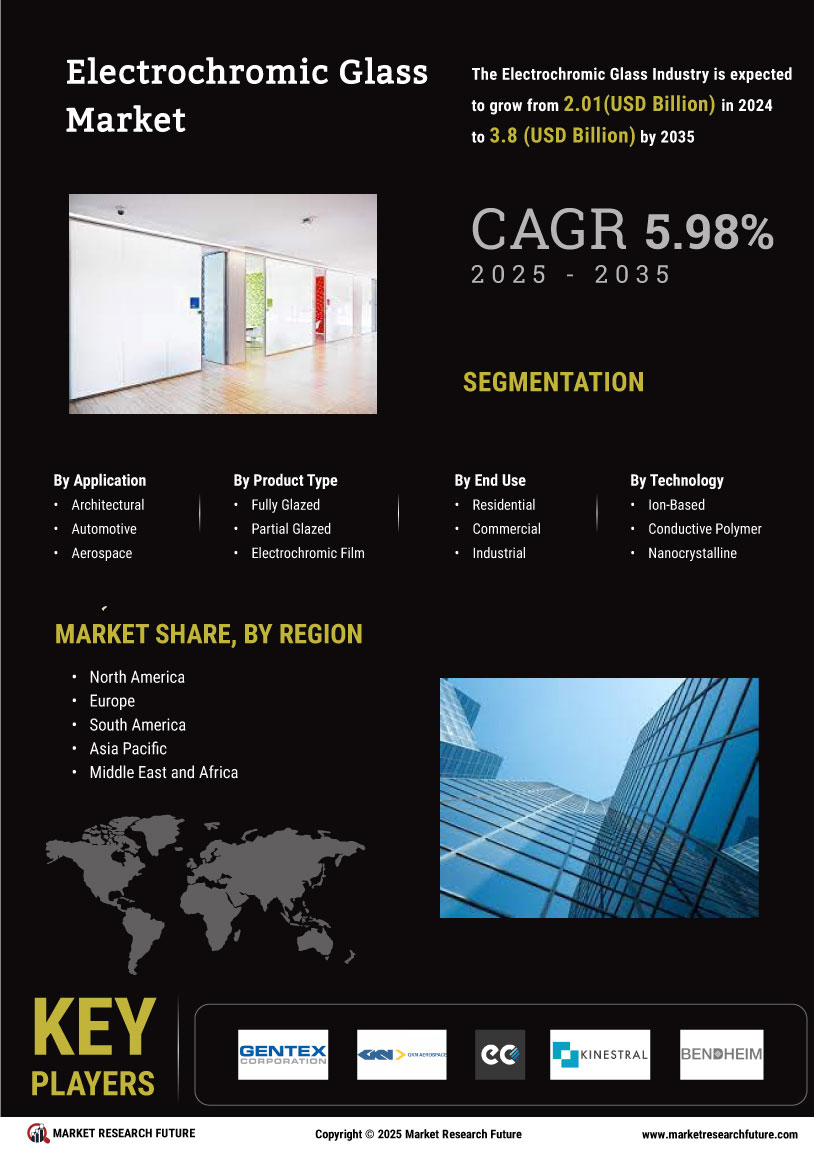
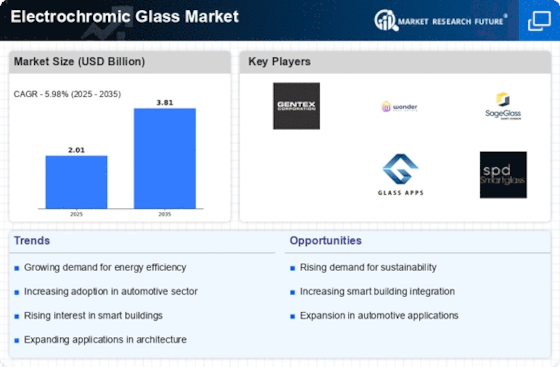
As per Market Research Future Analysis, the Global Electrochromic Glass Market is projected to grow significantly, driven by increasing demand for energy-efficient solutions and smart technologies. The market was valued at 1.89 USD Billion in 2023 and is expected to reach 2.01 USD Billion in 2024, with a forecasted growth to 3.8 USD Billion by 2035. The market is characterized by a CAGR of approximately 5.98% from 2025 to 2035, indicating robust growth potential across various sectors including architecture and automotive.
Key Market Trends & Highlights
The Global Electrochromic Glass Market is witnessing transformative trends fueled by sustainability and technological advancements.
- Market size in 2024: 2.01 USD Billion; expected to reach 3.8 USD Billion by 2035.
- Architectural segment valued at 0.85 USD Billion in 2024; major contributor to market growth.
- Automotive segment projected to grow from 0.4 USD Billion in 2024 to 0.9 USD Billion by 2035.
- Increased R&D investment by manufacturers, with a 20% rise in expenditures over the last three years.
Market Size & Forecast
2023 Market Size: USD 1.89 Billion
2024 Market Size: USD 2.01 Billion
2035 Market Size: USD 3.8 Billion
CAGR (2025-2035): 5.98%
Largest Regional Market Share in 2024: North America.
Major Players
Key players include Pleotint, Glass Apps, Gentex, Chromoglass, GKN Aerospace, SageGlass, Research Frontiers, View, EControlGlas, Kinestral Technologies, Smartglass International, Scienstry, Bendheim, Suntuitive, and Saint-Gobain.
Key Electrochromic Glass Market Trends Highlighted
The Electrochromic Glass Market is experiencing significant growth due to a surge in demand for energy-efficient and smart building solutions. Key market drivers include the increasing focus on sustainable architecture and green building practices, which are gaining traction worldwide, particularly as governments strive to meet energy conservation goals and reduce carbon footprints.
Enhanced comfort and aesthetics in architectural design further contribute to the demand for electrochromic glass, as it allows for dynamic control of light transmission and improved environmental quality.
There are opportunities to be explored in the integration of electrochromic glass with smart home systems and the burgeoning demand within the automotive sector, where dynamic glazing solutions enhance user experiences and offer energy savings.
Also, new uses are becoming possible thanks to advances in nanotechnology and materials science. This means that the market potential goes beyond just commercial and residential buildings to include transportation and aerospace as well.
Recent trends show that manufacturers and technology providers are working together more often to improve the features of their products and come up with new solutions that meet the needs of specific customers.
To make electrochromic technologies work better and cost less, a lot of places are putting money into research and development. As more people learn about the benefits of electrochromic solutions, the market is also moving towards more customisation options.
The growing combination of aesthetic appeal, energy efficiency, and enhanced comfort positions the Electrochromic Glass Market for continued expansion in the coming years.

Source: Primary Research, Secondary Research, Market Research Future Database, and Analyst Review
Electrochromic Glass Market Drivers
Increasing Demand for Energy-Efficient Solutions
The Electrochromic Glass Market is witnessing a surge in demand for energy-efficient building materials and solutions. According to data released by the U.S. Department of Energy, buildings account for nearly 40% of total energy consumption in the United States, highlighting the need for more sustainable options. Electrochromic glass helps in regulating indoor temperatures, thereby reducing the reliance on heating and cooling systems.
This is critical as governments worldwide, including those in the European Union, are implementing stricter energy efficiency regulations aimed at reducing carbon footprints. The European Commission reported a goal to reduce greenhouse gas emissions by at least 55% by 2030, thereby fostering advancements in technologies like electrochromic glass that support long-term sustainability initiatives.
Advancements in Smart Technologies
Technological advancements in smart window technologies are significantly impacting the Electrochromic Glass Market. The introduction of IoT (Internet of Things) integrated smart systems enables better control of electrochromic glass functionalities and enhances user experience.
The global smart glass market is projected to reach USD 10.57 billion by 2026, growing at a CAGR of approximately 8.1%. As tech giants such as Google and Apple expand their smart home capabilities, the demand for innovative glass solutions that can integrate seamlessly with other smart technologies is increasing, thereby propelling the market for electrochromic glass.
Government Incentives for Green Construction
Governments around the world are implementing various incentives for green building projects, which supports the Electrochromic Glass Market. In 2021, the U.S.
Congress passed a significant infrastructure bill that allocates funds for energy-efficient building technologies, presenting opportunities for electrochromic glass adoption in new construction and renovations.
Moreover, numerous countries have established sustainable building certifications, such as LEED (Leadership in Energy and Environmental Design), which recognize buildings that utilize energy-efficient technologies.
According to the Green Building Council, buildings that meet LEED standards can save 20-30% in energy costs, stimulating demand for innovative materials like electrochromic glass that contribute to achieving these certifications.
Electrochromic Glass Market Segment Insights
Electrochromic Glass Market Application Insights
The Electrochromic Glass Market is experiencing significant growth, driven by the increasing adoption of this technology across various applications. By 2024, the market for this segment is valued at 2.01 USD billion, with expectations to reach 3.8 USD billion by 2035.
This represents a considerable opportunity for industry stakeholders as the Electrochromic Glass Market continues to evolve. Within this segment, the Architectural application holds a majority holding, valued at 0.91 USD billion in 2024 and projected to grow to 1.66 USD billion in 2035.
The architectural sector benefits from electrochromic glass in building facades, enhancing both energy efficiency and occupant comfort.
The Automotive application, valued at 0.4 USD Billion in 2024 and expected to reach 0.8 USD Billion by 2035, is also a key segment as manufacturers look to integrate smart glass technology into vehicles to improve aesthetics and functionality, offering drivers enhanced control over sunlight and privacy.
The Aerospace sector, although smaller, is significant, with a valuation of 0.2 USD Billion in 2024 and forecasted to grow to 0.4 USD billion by 2035.
Electrochromic glass in aircraft windows enhances passenger comfort by providing adjustable tinting, which reduces glare and improves cabin temperature management.
Consumer Electronics, valued at 0.3 USD Billion in 2024 and anticipated to reach 0.62 USD billion by 2035, represents a growing segment where electrochromic technology is used in displays and devices, responding to market demand for innovative and adaptable product features.
Finally, the Marine application, generating 0.2 USD Billion in 2024 and expected to increase to 0.32 USD Billion by 2035, sees electrochromic glass used in yacht and boat windows for both aesthetic appeal and enhanced energy efficiency on the water.
The diverse applications highlight the versatility of electrochromic glass technology, making it an integral component of various industries within the Electrochromic Glass Market.
The growth in these segments is driven by increasing awareness of energy-saving technologies and the demand for comfortable and visually appealing environments.
However, challenges such as high initial costs and competition from alternative materials remain key barriers that players in this industry must navigate. The Electrochromic Glass Market data underscores the importance of innovation and investment in Research and Development to capitalize on emerging opportunities across these applications.
Moreover, as sustainability continues to impact consumer choices, the role of electrochromic glass in building greener and smarter environments will likely bolster its importance in the global market landscape.
The Electrochromic Glass Market statistics reinforce a trend towards integrated solutions that enhance user experience and comply with environmental standards.
Thus, the Application segment within the Electrochromic Glass Market reflects not only current consumption patterns but also points to the possibilities for future advancements and developments within the industry.

Source: Primary Research, Secondary Research, Market Research Future Database, and Analyst Review
Electrochromic Glass Market Product Type Insights
The Electrochromic Glass Market is projected to reach a valuation of 2.01 USD billion in 2024 and is expected to grow significantly, indicating a burgeoning interest in this innovative technology. The Product Type segment comprises three main categories: Fully Glazed, Partial Glazed, and Electrochromic Film.
Fully Glazed electrochromic glass is gaining traction in architectural applications due to its aesthetic appeal and energy efficiency, making it a preferred choice for modern buildings. Partial Glazed offers versatility, allowing for selective application in both residential and commercial properties, catering to diverse consumer needs.
Meanwhile, Electrochromic Film is an emerging trend that provides flexibility and ease of installation, often used in retrofitting existing structures, enhancing market adaptability.
As energy conservation and smart building technologies continue to evolve, these segments are positioned to play a critical role in the overall market growth, driven by growing demand for sustainable construction solutions and advancements in materials technology.
The Electrochromic Glass Market revenue is supported by a rising emphasis on energy efficiency and environmental sustainability across various sectors.
Electrochromic Glass Market End Use Insights
The Electrochromic Glass Market is poised for notable growth, with an expected valuation of 2.01 USD billion in 2024. This market showcases diverse applications across various End Use categories, including Residential, Commercial, and Industrial sectors. The Residential segment plays a pivotal role, as an increasing demand for energy-efficient solutions drives homeowners to adopt electrochromic glass for windows and facades.
In the Commercial sector, the implementation of this technology is rising in office buildings and storefronts, enhancing aesthetics while providing optimal energy management.
Meanwhile, the Industrial segment is gaining traction, with industries prioritizing sustainability and adaptive workspace solutions, making electrochromic glass an attractive option. Over the years, the market has experienced robust trends towards energy efficiency and smart building integrations.
Despite challenges such as high initial costs and technology adoption hurdles, opportunities abound in expanding markets, with the Electrochromic Glass Market expected to show steady progress driven by environmental regulations and growing awareness of sustainable practices.
The anticipated Electrochromic Glass Market data reflects a comprehensive shift towards smarter, greener spaces, providing a solid foundation for further growth.
Electrochromic Glass Market Technology Insights
The Electrochromic Glass Market is poised for significant growth, with a projected valuation of 2.01 USD billion in 2024. This market is poised to evolve further, showing promising trends led by advancements in technology.
Within the segment, Ion-Based technologies have emerged as a critical component, known for their efficiency in enabling various applications in the architecture and automotive industries.
Conductive Polymer technologies are also noteworthy, noted for their lightweight and flexible properties, accommodating diverse designs and methods of implementation.
Furthermore, Nanocrystalline technologies dominate due to their excellent electrochromic properties that provide enhanced performance. The unique advantages of these technologies contribute to their importance in energy-saving applications, which align with global sustainability goals.
Increasing environmental concerns and the drive toward innovative building solutions continue to be key growth drivers shaping the Electrochromic Glass Market, emphasizing the relevance of advanced technologies within this evolving landscape.
Electrochromic Glass Market Regional Insights
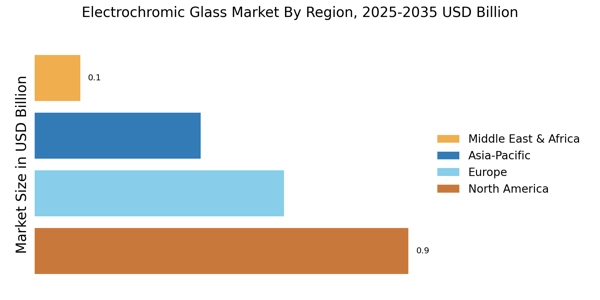
The Electrochromic Glass Market is witnessing notable growth across various regions, expected to reach a valuation of 2.01 USD billion in 2024. In this landscape, North America emerges as a significant player, projected to account for 0.74 USD billion in 2024 and 1.4 USD billion by 2035, showcasing its dominance.
Europe follows closely with a valuation of 0.65 USD billion in 2024, demonstrating a steady adoption of electrochromic technology. Meanwhile, Asia Pacific is marking its presence with anticipated growth from 0.39 USD billion in 2024 to 0.72 USD billion in 2035, driven by increasing demand in the construction and automotive sectors.
South America, although smaller at 0.15 USD billion in 2024, is expected to double its share by 2035. The Middle East and Africa, starting from a modest 0.08 USD billion in 2024, is gradually embracing these technologies, reflecting the region's growth potential.
Each region presents unique challenges and opportunities, with factors like urbanization, energy efficiency demands, and sustainable construction influencing trends in the Electrochromic Glass Market.
These dynamics underline the importance of regional segmentation for better market understanding and strategy formulation.

Source: Primary Research, Secondary Research, Market Research Future Database, and Analyst Review
Electrochromic Glass Market Key Players and Competitive Insights
The Electrochromic Glass Market has witnessed significant advancements driven by increasing demand for energy-efficient and smart building technologies. This market, characterized by dynamic competition among key players, showcases a variety of innovative solutions that cater to both commercial and residential applications.
As energy efficiency becomes a crucial factor in architectural design, electrochromic glass has emerged as a preferred choice due to its ability to adjust tint levels in response to external light conditions, thus assisting in temperature regulation and reducing energy costs.
The competitive landscape is marked by ongoing research and development initiatives aimed at enhancing product performance, expanding applications, and addressing environmental concerns.
Factors such as regulatory support for sustainable construction practices and rising consumer awareness about energy conservation have further catalyzed the growth of this market, fostering a competitive environment among existing manufacturers and new entrants.
Saint-Gobain has established itself as a significant player in the Electrochromic Glass Market, leveraging its extensive expertise in materials science and innovation. The company is recognized for its commitment to developing high-performance glazing solutions that offer both aesthetic appeal and functional benefits.
Saint-Gobain's strengths lie in its strong brand reputation, extensive distribution networks, and ability to create customized electrochromic products tailored to the specific needs of various applications.
By focusing on research and development, Saint-Gobain continues to introduce cutting-edge technologies that improve energy efficiency and occupant comfort in buildings.
The company also collaborates with architectural firms and construction companies to integrate electrochromic glazing into modern designs, further solidifying its presence in the global market.
Hitachi plays a prominent role in the Electrochromic Glass Market with its focus on advanced technologies and materials for innovative glass solutions.
The company offers a range of products, including smart glass and electrochromic display panels, which cater to various market segments, from commercial buildings to automotive applications.
Hitachi's strengths are highlighted by its robust technological capabilities, significant investment in research and development, and strategic partnerships that facilitate the introduction of novel products to the market.
The company has also engaged in key mergers and acquisitions to enhance its portfolio and market presence, aligning its growth strategy with the increasing global demand for sustainable and energy-efficient solutions. Through these initiatives, Hitachi continues to reinforce its competitive position in the electrochromic glass sector on a global scale.
Key Companies in the Electrochromic Glass Market Include
- SaintGobain
- Hitachi
- Glaston
- View
- Suntouch
- Chromogenics
- EcontrolGlas
- Gentex
- Glass Apps
- Jinko Solar
- Soladigm
- Research Frontiers
- AGC
- PPG Industries
- NSG Group
Electrochromic Glass Market Industry Developments
-
Q2 2024: View Inc. Announces Strategic Partnership with Nabr to Deploy Smart Windows in Sustainable Housing Projects View Inc. entered a partnership with Nabr to integrate its electrochromic smart windows into new green residential developments, aiming to reduce energy consumption and carbon footprint in urban housing projects.
-
Q4 2024: Renault Launches Solarbay Sunroof Featuring Advanced Electrochromic Glass Technology Renault unveiled its Solarbay sunroof, utilizing PDLC-based electrochromic glass, in select vehicle models to offer dynamic light control and improved passenger comfort.
-
Q1 2025: AGC Inc. Expands Electrochromic Glass Production Capacity with New Facility in Japan AGC Inc. announced the opening of a new manufacturing facility dedicated to electrochromic glass, aiming to meet rising demand from the automotive and construction sectors.
-
Q2 2025: Chromogenics AB Wins Major Contract to Supply Electrochromic Glass for Scandinavian Green Building Project Chromogenics AB secured a contract to provide its dynamic glass solutions for a large-scale sustainable office complex in Sweden, marking a significant expansion in the region.
-
Q2 2024: Polytronix, Inc. Launches Next-Generation Electrochromic Glass for Commercial Interiors Polytronix, Inc. introduced a new line of electrochromic glass products designed for office partitions and conference rooms, featuring improved switching speed and energy efficiency.
-
Q3 2024: Smartglass International Secures Partnership with European Rail Operator for Electrochromic Train Windows Smartglass International announced a partnership to supply electrochromic glass for train windows, enhancing passenger comfort and energy efficiency in new rolling stock.
-
Q1 2025: Kinestral Technologies Raises $40 Million in Series D Funding to Accelerate Electrochromic Glass Innovation Kinestral Technologies closed a $40 million funding round to expand R&D and scale production of its Halio smart glass for global commercial and residential markets.
-
Q2 2025: AGC Inc. Appoints New Head of Smart Glass Division to Drive Electrochromic Product Strategy AGC Inc. named a new executive to lead its smart glass division, focusing on expanding the company's electrochromic glass portfolio and market reach.
-
Q1 2024: Chromogenics AB Receives Regulatory Approval for Electrochromic Glass in EU Construction Projects Chromogenics AB obtained EU regulatory certification for its electrochromic glass products, enabling broader adoption in commercial and residential building projects.
-
Q3 2024: View Inc. Wins Contract to Install Smart Windows in Major U.S. Airport Expansion View Inc. was awarded a contract to supply electrochromic smart windows for a major airport terminal expansion, aiming to improve energy efficiency and passenger experience.
-
Q2 2025: Polytronix, Inc. Announces Strategic Partnership with Leading U.S. Architectural Firm Polytronix, Inc. formed a partnership with a top architectural firm to integrate its electrochromic glass solutions into flagship commercial building projects across the United States.
-
Q1 2025: Smartglass International Opens New R&D Center Focused on Advanced Electrochromic Technologies Smartglass International inaugurated a new research and development center to accelerate innovation in electrochromic glass for transportation and building applications.
Electrochromic Glass Market Segmentation Insights
-
Electrochromic Glass Market Application Outlook
- Architectural
- Automotive
- Aerospace
- Consumer Electronics
- Marine
-
Electrochromic Glass Market Product Type Outlook
- Fully Glazed
- Partial Glazed
- Electrochromic Film
-
Electrochromic Glass Market End Use Outlook
- Residential
- Commercial
- Industrial
-
Electrochromic Glass Market Technology Outlook
- Ion-Based
- Conductive Polymer
- Nanocry stalline
-
Electrochromic Glass Market Regional Outlook
- North America
- Europe
- South America
- Asia Pacific
- Middle East and Africa
Report Attribute/Metric |
Details |
Market Size 2023 |
1.89 (USD Billion) |
Market Size 2024 |
2.01 (USD Billion) |
Market Size 2035 |
3.8 (USD Billion) |
Compound Annual Growth Rate (CAGR) |
5.98% (2025 - 2035) |
Report Coverage |
Revenue Forecast, Competitive Landscape, Growth Factors, and Trends |
Base Year |
2024 |
Market Forecast Period |
2025 - 2035 |
Historical Data |
2019 - 2024 |
Market Forecast Units |
USD Billion |
Key Companies Profiled |
Saint-Gobain, Hitachi, Glaston, View, Suntouch, Chromogenics, EcontrolGlas, Gentex, Glass Apps, Jinko Solar, Soladigm, Research Frontiers, AGC, PPG Industries, NSG Group |
Segments Covered |
Application, Product Type, End Use, Technology, Regional |
Key Market Opportunities |
Smart buildings and green architecture, Automotive application growth, Energy-efficient building solutions, Integration with renewable energy, Expansion in emerging markets |
Key Market Dynamics |
Growing demand for energy efficiency, advancements in smart glass technology, increasing usage in the automotive sector, rising environmental regulations, expanding architectural applications |
Countries Covered |
North America, Europe, APAC, South America, MEA |
Electrochromic Glass Market Highlights:
Frequently Asked Questions (FAQ):
The Electrochromic Glass Market is expected to be valued at 2.01 billion USD in 2024.
The total market value of the Electrochromic Glass Market is projected to reach 3.8 billion USD by 2035.
The expected CAGR for the Electrochromic Glass Market from 2025 to 2035 is 5.98%.
The Architectural application segment is expected to have the highest value at 1.66 billion USD in 2035.
The estimated market value of the Automotive application segment is 0.4 billion USD in 2024.
North America is projected to hold the largest market share, valued at 0.74 billion USD in 2024.
The market value of the European region is expected to reach 1.25 billion USD by 2035.
Major players include Saint-Gobain, Hitachi, Glaston, and View, among others.
The South American market is expected to grow to 0.3 billion USD by 2035.
The Marine application segment is projected to be valued at 0.32 billion USD by 2035.
TABLE OF CONTENTS
 Â
1. EXECUTIVE SUMMARYÂ Â
1.1. Market Overview  Â
1.2. Key Findings  Â
1.3. Market Segmentation  Â
1.4. Competitive Landscape  Â
1.5. Challenges and Opportunities  Â
1.6. Future Outlook    Â
Â
2. MARKET INTRODUCTIONÂ Â
2.1. Definition  Â
2.2. Scope of the study Â
2.2.1. Research Objective    Â
2.2.2. Assumption    Â
2.2.3. Limitations       Â
3. RESEARCH METHODOLOGYÂ Â
3.1. Overview  Â
3.2. Data Mining  Â
3.3. Secondary Research  Â
3.4. Primary Research Â
3.4.1. Primary Interviews and Information Gathering Process    Â
3.4.2. Breakdown of Primary Respondents     Â
3.5. Forecasting Model  Â
3.6. Market Size Estimation Â
3.6.1. Bottom-Up Approach    Â
3.6.2. Top-Down Approach     Â
3.7. Data Triangulation  Â
3.8. Validation    Â
Â
Â
  Â
4. MARKET DYNAMICSÂ Â
4.1. Overview  Â
4.2. Drivers  Â
4.3. Restraints  Â
4.4. Opportunities    Â
5. MARKET FACTOR ANALYSISÂ Â
5.1. Value chain Analysis  Â
5.2. Porter's Five Forces Analysis Â
5.2.1. Bargaining Power of Suppliers    Â
5.2.2. Bargaining Power of Buyers    Â
5.2.3. Threat of New Entrants    Â
5.2.4. Threat of Substitutes    Â
5.2.5. Intensity of Rivalry     Â
5.3. COVID-19 Impact Analysis Â
5.3.1. Market Impact Analysis    Â
5.3.2. Regional Impact    Â
5.3.3. Opportunity and Threat Analysis       Â
Â
Â
  Â
6. ELECTROCHROMIC GLASS MARKET, BY APPLICATION (USD BILLION)Â Â
6.1. Architectural  Â
6.2. Automotive  Â
6.3. Aerospace  Â
6.4. Consumer Electronics  Â
6.5. Marine    Â
7. ELECTROCHROMIC GLASS MARKET, BY PRODUCT TYPE (USD BILLION)Â Â
7.1. Fully Glazed  Â
7.2. Partial Glazed  Â
7.3. Electrochromic Film    Â
8. ELECTROCHROMIC GLASS MARKET, BY END USE (USD BILLION)Â Â
8.1. Residential  Â
8.2. Commercial  Â
8.3. Industrial    Â
9. ELECTROCHROMIC GLASS MARKET, BY TECHNOLOGY (USD BILLION)Â Â
9.1. Ion-Based  Â
9.2. Conductive Polymer  Â
9.3. Nanocrystalline    Â
10. ELECTROCHROMIC GLASS MARKET, BY REGIONAL (USD BILLION)Â Â
10.1. North America Â
10.1.1. USÂ Â Â Â Â
10.1.2. Canada     Â
10.2. Europe Â
10.2.1. Germany    Â
10.2.2. UKÂ Â Â Â Â
10.2.3. France    Â
10.2.4. Russia    Â
10.2.5. Italy    Â
10.2.6. Spain    Â
10.2.7. Rest of Europe     Â
10.3. APACÂ Â
10.3.1. China    Â
10.3.2. India    Â
10.3.3. Japan    Â
10.3.4. South Korea    Â
10.3.5. Malaysia    Â
10.3.6. Thailand    Â
10.3.7. Indonesia    Â
10.3.8. Rest of APACÂ Â Â Â Â Â
10.4. South America Â
10.4.1. Brazil    Â
10.4.2. Mexico    Â
10.4.3. Argentina    Â
10.4.4. Rest of South America     Â
10.5. MEAÂ Â
10.5.1. GCC Countries    Â
10.5.2. South Africa    Â
10.5.3. Rest of MEAÂ Â Â Â Â Â Â Â
Â
Â
  Â
11. COMPETITIVE LANDSCAPEÂ Â
11.1. Overview  Â
11.2. Competitive Analysis  Â
11.3. Market share Analysis  Â
11.4. Major Growth Strategy in the Electrochromic Glass Market  Â
11.5. Competitive Benchmarking  Â
11.6. Leading Players in Terms of Number of Developments in the Electrochromic Glass Market  Â
11.7. Key developments and growth strategies Â
11.7.1. New Product Launch/Service Deployment    Â
11.7.2. Merger & Acquisitions    Â
11.7.3. Joint Ventures     Â
11.8. Major Players Financial Matrix  Â
11.8.1. Sales and Operating Income    Â
11.8.2. Major Players R&D Expenditure. 2023Â Â Â Â Â Â Â Â
12. COMPANY PROFILESÂ Â
12.1. Pleotint Â
12.1.1. Financial Overview    Â
12.1.2. Products Offered    Â
12.1.3. Key Developments    Â
12.1.4. SWOT Analysis    Â
12.1.5. Key Strategies     Â
12.2. Glass Apps Â
12.2.1. Financial Overview    Â
12.2.2. Products Offered    Â
12.2.3. Key Developments    Â
12.2.4. SWOT Analysis    Â
12.2.5. Key Strategies     Â
12.3. Gentex Â
12.3.1. Financial Overview    Â
12.3.2. Products Offered    Â
12.3.3. Key Developments    Â
12.3.4. SWOT Analysis    Â
12.3.5. Key Strategies     Â
12.4. Chromoglass Â
12.4.1. Financial Overview    Â
12.4.2. Products Offered    Â
12.4.3. Key Developments    Â
12.4.4. SWOT Analysis    Â
12.4.5. Key Strategies     Â
12.5. GKN Aerospace Â
12.5.1. Financial Overview    Â
12.5.2. Products Offered    Â
12.5.3. Key Developments    Â
12.5.4. SWOT Analysis    Â
12.5.5. Key Strategies     Â
12.6. SageGlass Â
12.6.1. Financial Overview    Â
12.6.2. Products Offered    Â
12.6.3. Key Developments    Â
12.6.4. SWOT Analysis    Â
12.6.5. Key Strategies     Â
12.7. Research Frontiers Â
12.7.1. Financial Overview    Â
12.7.2. Products Offered    Â
12.7.3. Key Developments    Â
12.7.4. SWOT Analysis    Â
12.7.5. Key Strategies     Â
12.8. View Â
12.8.1. Financial Overview    Â
12.8.2. Products Offered    Â
12.8.3. Key Developments    Â
12.8.4. SWOT Analysis    Â
12.8.5. Key Strategies     Â
12.9. EControlGlas Â
12.9.1. Financial Overview    Â
12.9.2. Products Offered    Â
12.9.3. Key Developments    Â
12.9.4. SWOT Analysis    Â
12.9.5. Key Strategies     Â
12.10. Kinestral Technologies Â
12.10.1. Financial Overview    Â
12.10.2. Products Offered    Â
12.10.3. Key Developments    Â
12.10.4. SWOT Analysis    Â
12.10.5. Key Strategies     Â
12.11. Smartglass International Â
12.11.1. Financial Overview    Â
12.11.2. Products Offered    Â
12.11.3. Key Developments    Â
12.11.4. SWOT Analysis    Â
12.11.5. Key Strategies     Â
12.12. Scienstry Â
12.12.1. Financial Overview    Â
12.12.2. Products Offered    Â
12.12.3. Key Developments    Â
12.12.4. SWOT Analysis    Â
12.12.5. Key Strategies     Â
12.13. Bendheim Â
12.13.1. Financial Overview    Â
12.13.2. Products Offered    Â
12.13.3. Key Developments    Â
12.13.4. SWOT Analysis    Â
12.13.5. Key Strategies     Â
12.14. Suntuitive Â
12.14.1. Financial Overview    Â
12.14.2. Products Offered    Â
12.14.3. Key Developments    Â
12.14.4. SWOT Analysis    Â
12.14.5. Key Strategies     Â
12.15. SaintGobain Â
12.15.1. Financial Overview    Â
12.15.2. Products Offered    Â
12.15.3. Key Developments    Â
12.15.4. SWOT Analysis    Â
12.15.5. Key Strategies       Â
13. APPENDIXÂ Â
13.1. References  Â
13.2. Related Reports    Â
Â
   Â
LIST OF TABLES
Â
TABLE 1. LIST OF ASSUMPTIONSÂ Â
TABLE 2. NORTH AMERICA ELECTROCHROMIC GLASS MARKET SIZE ESTIMATES & FORECAST BY APPLICATION, 2019-2035 (USD BILLIONS)Â Â
TABLE 3. NORTH AMERICA MARKET SIZE ESTIMATES & FORECAST BY PRODUCT TYPE, 2019-2035 (USD BILLIONS)Â Â
TABLE 4. NORTH AMERICA MARKET SIZE ESTIMATES & FORECAST BY END USE, 2019-2035 (USD BILLIONS)Â Â
TABLE 5. NORTH AMERICA MARKET SIZE ESTIMATES & FORECAST BY TECHNOLOGY, 2019-2035 (USD BILLIONS)Â Â
TABLE 6. NORTH AMERICA MARKET SIZE ESTIMATES & FORECAST BY REGIONAL, 2019-2035 (USD BILLIONS)Â Â
TABLE 7. US ELECTROCHROMIC GLASS MARKET SIZE ESTIMATES & FORECAST BY APPLICATION, 2019-2035 (USD BILLIONS)Â Â
TABLE 8. US MARKET SIZE ESTIMATES & FORECAST BY PRODUCT TYPE, 2019-2035 (USD BILLIONS)Â Â
TABLE 9. US MARKET SIZE ESTIMATES & FORECAST BY END USE, 2019-2035 (USD BILLIONS)Â Â
TABLE 10. US MARKET SIZE ESTIMATES & FORECAST BY TECHNOLOGY, 2019-2035 (USD BILLIONS)Â Â
TABLE 11. US MARKET SIZE ESTIMATES & FORECAST BY REGIONAL, 2019-2035 (USD BILLIONS)Â Â
TABLE 12. CANADA ELECTROCHROMIC GLASS MARKET SIZE ESTIMATES & FORECAST BY APPLICATION, 2019-2035 (USD BILLIONS)Â Â
TABLE 13. CANADA MARKET SIZE ESTIMATES & FORECAST BY PRODUCT TYPE, 2019-2035 (USD BILLIONS)Â Â
TABLE 14. CANADA MARKET SIZE ESTIMATES & FORECAST BY END USE, 2019-2035 (USD BILLIONS)Â Â
TABLE 15. CANADA MARKET SIZE ESTIMATES & FORECAST BY TECHNOLOGY, 2019-2035 (USD BILLIONS)Â Â
TABLE 16. CANADA MARKET SIZE ESTIMATES & FORECAST BY REGIONAL, 2019-2035 (USD BILLIONS)Â Â
TABLE 17. EUROPE ELECTROCHROMIC GLASS MARKET SIZE ESTIMATES & FORECAST BY APPLICATION, 2019-2035 (USD BILLIONS)Â Â
TABLE 18. EUROPE MARKET SIZE ESTIMATES & FORECAST BY PRODUCT TYPE, 2019-2035 (USD BILLIONS)Â Â
TABLE 19. EUROPE MARKET SIZE ESTIMATES & FORECAST BY END USE, 2019-2035 (USD BILLIONS)Â Â
TABLE 20. EUROPE MARKET SIZE ESTIMATES & FORECAST BY TECHNOLOGY, 2019-2035 (USD BILLIONS)Â Â
TABLE 21. EUROPE MARKET SIZE ESTIMATES & FORECAST BY REGIONAL, 2019-2035 (USD BILLIONS)Â Â
TABLE 22. GERMANY ELECTROCHROMIC GLASS MARKET SIZE ESTIMATES & FORECAST BY APPLICATION, 2019-2035 (USD BILLIONS)Â Â
TABLE 23. GERMANY MARKET SIZE ESTIMATES & FORECAST BY PRODUCT TYPE, 2019-2035 (USD BILLIONS)Â Â
TABLE 24. GERMANY MARKET SIZE ESTIMATES & FORECAST BY END USE, 2019-2035 (USD BILLIONS)Â Â
TABLE 25. GERMANY MARKET SIZE ESTIMATES & FORECAST BY TECHNOLOGY, 2019-2035 (USD BILLIONS)Â Â
TABLE 26. GERMANY MARKET SIZE ESTIMATES & FORECAST BY REGIONAL, 2019-2035 (USD BILLIONS)Â Â
TABLE 27. UK ELECTROCHROMIC GLASS MARKET SIZE ESTIMATES & FORECAST BY APPLICATION, 2019-2035 (USD BILLIONS)Â Â
TABLE 28. UK MARKET SIZE ESTIMATES & FORECAST BY PRODUCT TYPE, 2019-2035 (USD BILLIONS)Â Â
TABLE 29. UK MARKET SIZE ESTIMATES & FORECAST BY END USE, 2019-2035 (USD BILLIONS)Â Â
TABLE 30. UK MARKET SIZE ESTIMATES & FORECAST BY TECHNOLOGY, 2019-2035 (USD BILLIONS)Â Â
TABLE 31. UK MARKET SIZE ESTIMATES & FORECAST BY REGIONAL, 2019-2035 (USD BILLIONS)Â Â
TABLE 32. FRANCE ELECTROCHROMIC GLASS MARKET SIZE ESTIMATES & FORECAST BY APPLICATION, 2019-2035 (USD BILLIONS)Â Â
TABLE 33. FRANCE MARKET SIZE ESTIMATES & FORECAST BY PRODUCT TYPE, 2019-2035 (USD BILLIONS)Â Â
TABLE 34. FRANCE MARKET SIZE ESTIMATES & FORECAST BY END USE, 2019-2035 (USD BILLIONS)Â Â
TABLE 35. FRANCE MARKET SIZE ESTIMATES & FORECAST BY TECHNOLOGY, 2019-2035 (USD BILLIONS)Â Â
TABLE 36. FRANCE MARKET SIZE ESTIMATES & FORECAST BY REGIONAL, 2019-2035 (USD BILLIONS)Â Â
TABLE 37. RUSSIA ELECTROCHROMIC GLASS MARKET SIZE ESTIMATES & FORECAST BY APPLICATION, 2019-2035 (USD BILLIONS)Â Â
TABLE 38. RUSSIA MARKET SIZE ESTIMATES & FORECAST BY PRODUCT TYPE, 2019-2035 (USD BILLIONS)Â Â
TABLE 39. RUSSIA MARKET SIZE ESTIMATES & FORECAST BY END USE, 2019-2035 (USD BILLIONS)Â Â
TABLE 40. RUSSIA MARKET SIZE ESTIMATES & FORECAST BY TECHNOLOGY, 2019-2035 (USD BILLIONS)Â Â
TABLE 41. RUSSIA MARKET SIZE ESTIMATES & FORECAST BY REGIONAL, 2019-2035 (USD BILLIONS)Â Â
TABLE 42. ITALY ELECTROCHROMIC GLASS MARKET SIZE ESTIMATES & FORECAST BY APPLICATION, 2019-2035 (USD BILLIONS)Â Â
TABLE 43. ITALY MARKET SIZE ESTIMATES & FORECAST BY PRODUCT TYPE, 2019-2035 (USD BILLIONS)Â Â
TABLE 44. ITALY MARKET SIZE ESTIMATES & FORECAST BY END USE, 2019-2035 (USD BILLIONS)Â Â
TABLE 45. ITALY MARKET SIZE ESTIMATES & FORECAST BY TECHNOLOGY, 2019-2035 (USD BILLIONS)Â Â
TABLE 46. ITALY MARKET SIZE ESTIMATES & FORECAST BY REGIONAL, 2019-2035 (USD BILLIONS)Â Â
TABLE 47. SPAIN ELECTROCHROMIC GLASS MARKET SIZE ESTIMATES & FORECAST BY APPLICATION, 2019-2035 (USD BILLIONS)Â Â
TABLE 48. SPAIN MARKET SIZE ESTIMATES & FORECAST BY PRODUCT TYPE, 2019-2035 (USD BILLIONS)Â Â
TABLE 49. SPAIN MARKET SIZE ESTIMATES & FORECAST BY END USE, 2019-2035 (USD BILLIONS)Â Â
TABLE 50. SPAIN MARKET SIZE ESTIMATES & FORECAST BY TECHNOLOGY, 2019-2035 (USD BILLIONS)Â Â
TABLE 51. SPAIN MARKET SIZE ESTIMATES & FORECAST BY REGIONAL, 2019-2035 (USD BILLIONS)Â Â
TABLE 52. REST OF EUROPE ELECTROCHROMIC GLASS MARKET SIZE ESTIMATES & FORECAST BY APPLICATION, 2019-2035 (USD BILLIONS)Â Â
TABLE 53. REST OF EUROPE MARKET SIZE ESTIMATES & FORECAST BY PRODUCT TYPE, 2019-2035 (USD BILLIONS)Â Â
TABLE 54. REST OF EUROPE MARKET SIZE ESTIMATES & FORECAST BY END USE, 2019-2035 (USD BILLIONS)Â Â
TABLE 55. REST OF EUROPE MARKET SIZE ESTIMATES & FORECAST BY TECHNOLOGY, 2019-2035 (USD BILLIONS)Â Â
TABLE 56. REST OF EUROPE MARKET SIZE ESTIMATES & FORECAST BY REGIONAL, 2019-2035 (USD BILLIONS)Â Â
TABLE 57. APAC ELECTROCHROMIC GLASS MARKET SIZE ESTIMATES & FORECAST BY APPLICATION, 2019-2035 (USD BILLIONS)Â Â
TABLE 58. APAC MARKET SIZE ESTIMATES & FORECAST BY PRODUCT TYPE, 2019-2035 (USD BILLIONS)Â Â
TABLE 59. APAC MARKET SIZE ESTIMATES & FORECAST BY END USE, 2019-2035 (USD BILLIONS)Â Â
TABLE 60. APAC MARKET SIZE ESTIMATES & FORECAST BY TECHNOLOGY, 2019-2035 (USD BILLIONS)Â Â
TABLE 61. APAC MARKET SIZE ESTIMATES & FORECAST BY REGIONAL, 2019-2035 (USD BILLIONS)Â Â
TABLE 62. CHINA ELECTROCHROMIC GLASS MARKET SIZE ESTIMATES & FORECAST BY APPLICATION, 2019-2035 (USD BILLIONS)Â Â
TABLE 63. CHINA MARKET SIZE ESTIMATES & FORECAST BY PRODUCT TYPE, 2019-2035 (USD BILLIONS)Â Â
TABLE 64. CHINA MARKET SIZE ESTIMATES & FORECAST BY END USE, 2019-2035 (USD BILLIONS)Â Â
TABLE 65. CHINA MARKET SIZE ESTIMATES & FORECAST BY TECHNOLOGY, 2019-2035 (USD BILLIONS)Â Â
TABLE 66. CHINA MARKET SIZE ESTIMATES & FORECAST BY REGIONAL, 2019-2035 (USD BILLIONS)Â Â
TABLE 67. INDIA ELECTROCHROMIC GLASS MARKET SIZE ESTIMATES & FORECAST BY APPLICATION, 2019-2035 (USD BILLIONS)Â Â
TABLE 68. INDIA MARKET SIZE ESTIMATES & FORECAST BY PRODUCT TYPE, 2019-2035 (USD BILLIONS)Â Â
TABLE 69. INDIA MARKET SIZE ESTIMATES & FORECAST BY END USE, 2019-2035 (USD BILLIONS)Â Â
TABLE 70. INDIA MARKET SIZE ESTIMATES & FORECAST BY TECHNOLOGY, 2019-2035 (USD BILLIONS)Â Â
TABLE 71. INDIA MARKET SIZE ESTIMATES & FORECAST BY REGIONAL, 2019-2035 (USD BILLIONS)Â Â
TABLE 72. JAPAN ELECTROCHROMIC GLASS MARKET SIZE ESTIMATES & FORECAST BY APPLICATION, 2019-2035 (USD BILLIONS)Â Â
TABLE 73. JAPAN MARKET SIZE ESTIMATES & FORECAST BY PRODUCT TYPE, 2019-2035 (USD BILLIONS)Â Â
TABLE 74. JAPAN MARKET SIZE ESTIMATES & FORECAST BY END USE, 2019-2035 (USD BILLIONS)Â Â
TABLE 75. JAPAN MARKET SIZE ESTIMATES & FORECAST BY TECHNOLOGY, 2019-2035 (USD BILLIONS)Â Â
TABLE 76. JAPAN MARKET SIZE ESTIMATES & FORECAST BY REGIONAL, 2019-2035 (USD BILLIONS)Â Â
TABLE 77. SOUTH KOREA ELECTROCHROMIC GLASS MARKET SIZE ESTIMATES & FORECAST BY APPLICATION, 2019-2035 (USD BILLIONS)Â Â
TABLE 78. SOUTH KOREA MARKET SIZE ESTIMATES & FORECAST BY PRODUCT TYPE, 2019-2035 (USD BILLIONS)Â Â
TABLE 79. SOUTH KOREA MARKET SIZE ESTIMATES & FORECAST BY END USE, 2019-2035 (USD BILLIONS)Â Â
TABLE 80. SOUTH KOREA MARKET SIZE ESTIMATES & FORECAST BY TECHNOLOGY, 2019-2035 (USD BILLIONS)Â Â
TABLE 81. SOUTH KOREA MARKET SIZE ESTIMATES & FORECAST BY REGIONAL, 2019-2035 (USD BILLIONS)Â Â
TABLE 82. MALAYSIA ELECTROCHROMIC GLASS MARKET SIZE ESTIMATES & FORECAST BY APPLICATION, 2019-2035 (USD BILLIONS)Â Â
TABLE 83. MALAYSIA MARKET SIZE ESTIMATES & FORECAST BY PRODUCT TYPE, 2019-2035 (USD BILLIONS)Â Â
TABLE 84. MALAYSIA MARKET SIZE ESTIMATES & FORECAST BY END USE, 2019-2035 (USD BILLIONS)Â Â
TABLE 85. MALAYSIA MARKET SIZE ESTIMATES & FORECAST BY TECHNOLOGY, 2019-2035 (USD BILLIONS)Â Â
TABLE 86. MALAYSIA MARKET SIZE ESTIMATES & FORECAST BY REGIONAL, 2019-2035 (USD BILLIONS)Â Â
TABLE 87. THAILAND ELECTROCHROMIC GLASS MARKET SIZE ESTIMATES & FORECAST BY APPLICATION, 2019-2035 (USD BILLIONS)Â Â
TABLE 88. THAILAND MARKET SIZE ESTIMATES & FORECAST BY PRODUCT TYPE, 2019-2035 (USD BILLIONS)Â Â
TABLE 89. THAILAND MARKET SIZE ESTIMATES & FORECAST BY END USE, 2019-2035 (USD BILLIONS)Â Â
TABLE 90. THAILAND MARKET SIZE ESTIMATES & FORECAST BY TECHNOLOGY, 2019-2035 (USD BILLIONS)Â Â
TABLE 91. THAILAND MARKET SIZE ESTIMATES & FORECAST BY REGIONAL, 2019-2035 (USD BILLIONS)Â Â
TABLE 92. INDONESIA ELECTROCHROMIC GLASS MARKET SIZE ESTIMATES & FORECAST BY APPLICATION, 2019-2035 (USD BILLIONS)Â Â
TABLE 93. INDONESIA MARKET SIZE ESTIMATES & FORECAST BY PRODUCT TYPE, 2019-2035 (USD BILLIONS)Â Â
TABLE 94. INDONESIA MARKET SIZE ESTIMATES & FORECAST BY END USE, 2019-2035 (USD BILLIONS)Â Â
TABLE 95. INDONESIA MARKET SIZE ESTIMATES & FORECAST BY TECHNOLOGY, 2019-2035 (USD BILLIONS)Â Â
TABLE 96. INDONESIA MARKET SIZE ESTIMATES & FORECAST BY REGIONAL, 2019-2035 (USD BILLIONS)Â Â
TABLE 97. REST OF APAC ELECTROCHROMIC GLASS MARKET SIZE ESTIMATES & FORECAST BY APPLICATION, 2019-2035 (USD BILLIONS)Â Â
TABLE 98. REST OF APAC MARKET SIZE ESTIMATES & FORECAST BY PRODUCT TYPE, 2019-2035 (USD BILLIONS)Â Â
TABLE 99. REST OF APAC MARKET SIZE ESTIMATES & FORECAST BY END USE, 2019-2035 (USD BILLIONS)Â Â
TABLE 100. REST OF APAC MARKET SIZE ESTIMATES & FORECAST BY TECHNOLOGY, 2019-2035 (USD BILLIONS)Â Â
TABLE 101. REST OF APAC MARKET SIZE ESTIMATES & FORECAST BY REGIONAL, 2019-2035 (USD BILLIONS)Â Â
TABLE 102. SOUTH AMERICA ELECTROCHROMIC GLASS MARKET SIZE ESTIMATES & FORECAST BY APPLICATION, 2019-2035 (USD BILLIONS)Â Â
TABLE 103. SOUTH AMERICA MARKET SIZE ESTIMATES & FORECAST BY PRODUCT TYPE, 2019-2035 (USD BILLIONS)Â Â
TABLE 104. SOUTH AMERICA MARKET SIZE ESTIMATES & FORECAST BY END USE, 2019-2035 (USD BILLIONS)Â Â
TABLE 105. SOUTH AMERICA MARKET SIZE ESTIMATES & FORECAST BY TECHNOLOGY, 2019-2035 (USD BILLIONS)Â Â
TABLE 106. SOUTH AMERICA MARKET SIZE ESTIMATES & FORECAST BY REGIONAL, 2019-2035 (USD BILLIONS)Â Â
TABLE 107. BRAZIL ELECTROCHROMIC GLASS MARKET SIZE ESTIMATES & FORECAST BY APPLICATION, 2019-2035 (USD BILLIONS)Â Â
TABLE 108. BRAZIL MARKET SIZE ESTIMATES & FORECAST BY PRODUCT TYPE, 2019-2035 (USD BILLIONS)Â Â
TABLE 109. BRAZIL MARKET SIZE ESTIMATES & FORECAST BY END USE, 2019-2035 (USD BILLIONS)Â Â
TABLE 110. BRAZIL MARKET SIZE ESTIMATES & FORECAST BY TECHNOLOGY, 2019-2035 (USD BILLIONS)Â Â
TABLE 111. BRAZIL MARKET SIZE ESTIMATES & FORECAST BY REGIONAL, 2019-2035 (USD BILLIONS)Â Â
TABLE 112. MEXICO ELECTROCHROMIC GLASS MARKET SIZE ESTIMATES & FORECAST BY APPLICATION, 2019-2035 (USD BILLIONS)Â Â
TABLE 113. MEXICO MARKET SIZE ESTIMATES & FORECAST BY PRODUCT TYPE, 2019-2035 (USD BILLIONS)Â Â
TABLE 114. MEXICO MARKET SIZE ESTIMATES & FORECAST BY END USE, 2019-2035 (USD BILLIONS)Â Â
TABLE 115. MEXICO MARKET SIZE ESTIMATES & FORECAST BY TECHNOLOGY, 2019-2035 (USD BILLIONS)Â Â
TABLE 116. MEXICO MARKET SIZE ESTIMATES & FORECAST BY REGIONAL, 2019-2035 (USD BILLIONS)Â Â
TABLE 117. ARGENTINA ELECTROCHROMIC GLASS MARKET SIZE ESTIMATES & FORECAST BY APPLICATION, 2019-2035 (USD BILLIONS)Â Â
TABLE 118. ARGENTINA MARKET SIZE ESTIMATES & FORECAST BY PRODUCT TYPE, 2019-2035 (USD BILLIONS)Â Â
TABLE 119. ARGENTINA MARKET SIZE ESTIMATES & FORECAST BY END USE, 2019-2035 (USD BILLIONS)Â Â
TABLE 120. ARGENTINA MARKET SIZE ESTIMATES & FORECAST BY TECHNOLOGY, 2019-2035 (USD BILLIONS)Â Â
TABLE 121. ARGENTINA MARKET SIZE ESTIMATES & FORECAST BY REGIONAL, 2019-2035 (USD BILLIONS)Â Â
TABLE 122. REST OF SOUTH AMERICA ELECTROCHROMIC GLASS MARKET SIZE ESTIMATES & FORECAST BY APPLICATION, 2019-2035 (USD BILLIONS)Â Â
TABLE 123. REST OF SOUTH AMERICA MARKET SIZE ESTIMATES & FORECAST BY PRODUCT TYPE, 2019-2035 (USD BILLIONS)Â Â
TABLE 124. REST OF SOUTH AMERICA MARKET SIZE ESTIMATES & FORECAST BY END USE, 2019-2035 (USD BILLIONS)Â Â
TABLE 125. REST OF SOUTH AMERICA MARKET SIZE ESTIMATES & FORECAST BY TECHNOLOGY, 2019-2035 (USD BILLIONS)Â Â
TABLE 126. REST OF SOUTH AMERICA MARKET SIZE ESTIMATES & FORECAST BY REGIONAL, 2019-2035 (USD BILLIONS)Â Â
TABLE 127. MEA ELECTROCHROMIC GLASS MARKET SIZE ESTIMATES & FORECAST BY APPLICATION, 2019-2035 (USD BILLIONS)Â Â
TABLE 128. MEA MARKET SIZE ESTIMATES & FORECAST BY PRODUCT TYPE, 2019-2035 (USD BILLIONS)Â Â
TABLE 129. MEA MARKET SIZE ESTIMATES & FORECAST BY END USE, 2019-2035 (USD BILLIONS)Â Â
TABLE 130. MEA MARKET SIZE ESTIMATES & FORECAST BY TECHNOLOGY, 2019-2035 (USD BILLIONS)Â Â
TABLE 131. MEA MARKET SIZE ESTIMATES & FORECAST BY REGIONAL, 2019-2035 (USD BILLIONS)Â Â
TABLE 132. GCC COUNTRIES ELECTROCHROMIC GLASS MARKET SIZE ESTIMATES & FORECAST BY APPLICATION, 2019-2035 (USD BILLIONS)Â Â
TABLE 133. GCC COUNTRIES MARKET SIZE ESTIMATES & FORECAST BY PRODUCT TYPE, 2019-2035 (USD BILLIONS)Â Â
TABLE 134. GCC COUNTRIES MARKET SIZE ESTIMATES & FORECAST BY END USE, 2019-2035 (USD BILLIONS)Â Â
TABLE 135. GCC COUNTRIES MARKET SIZE ESTIMATES & FORECAST BY TECHNOLOGY, 2019-2035 (USD BILLIONS)Â Â
TABLE 136. GCC COUNTRIES MARKET SIZE ESTIMATES & FORECAST BY REGIONAL, 2019-2035 (USD BILLIONS)Â Â
TABLE 137. SOUTH AFRICA ELECTROCHROMIC GLASS MARKET SIZE ESTIMATES & FORECAST BY APPLICATION, 2019-2035 (USD BILLIONS)Â Â
TABLE 138. SOUTH AFRICA MARKET SIZE ESTIMATES & FORECAST BY PRODUCT TYPE, 2019-2035 (USD BILLIONS)Â Â
TABLE 139. SOUTH AFRICA MARKET SIZE ESTIMATES & FORECAST BY END USE, 2019-2035 (USD BILLIONS)Â Â
TABLE 140. SOUTH AFRICA MARKET SIZE ESTIMATES & FORECAST BY TECHNOLOGY, 2019-2035 (USD BILLIONS)Â Â
TABLE 141. SOUTH AFRICA MARKET SIZE ESTIMATES & FORECAST BY REGIONAL, 2019-2035 (USD BILLIONS)Â Â
TABLE 142. REST OF MEA ELECTROCHROMIC GLASS MARKET SIZE ESTIMATES & FORECAST BY APPLICATION, 2019-2035 (USD BILLIONS)Â Â
TABLE 143. REST OF MEA MARKET SIZE ESTIMATES & FORECAST BY PRODUCT TYPE, 2019-2035 (USD BILLIONS)Â Â
TABLE 144. REST OF MEA MARKET SIZE ESTIMATES & FORECAST BY END USE, 2019-2035 (USD BILLIONS)Â Â
TABLE 145. REST OF MEA MARKET SIZE ESTIMATES & FORECAST BY TECHNOLOGY, 2019-2035 (USD BILLIONS)Â Â
TABLE 146. REST OF MEA MARKET SIZE ESTIMATES & FORECAST BY REGIONAL, 2019-2035 (USD BILLIONS)Â Â
TABLE 147. PRODUCT LAUNCH/PRODUCT DEVELOPMENT/APPROVALÂ Â
TABLE 148. ACQUISITION/PARTNERSHIPÂ Â
Â
Â
LIST OF FIGURES
Â
FIGURE 1. ELECTROCHROMIC GLASS MARKET SYNOPSISÂ
FIGURE 2. NORTH AMERICA ELECTROCHROMIC GLASS MARKET ANALYSISÂ
FIGURE 3. US ELECTROCHROMIC GLASS MARKET ANALYSIS BY APPLICATIONÂ
FIGURE 4. US MARKET ANALYSIS BY PRODUCT TYPEÂ
FIGURE 5. US MARKET ANALYSIS BY END USEÂ
FIGURE 6. US MARKET ANALYSIS BY TECHNOLOGYÂ
FIGURE 7. US MARKET ANALYSIS BY REGIONALÂ
FIGURE 8. CANADA ELECTROCHROMIC GLASS MARKET ANALYSIS BY APPLICATIONÂ
FIGURE 9. CANADA MARKET ANALYSIS BY PRODUCT TYPEÂ
FIGURE 10. CANADA MARKET ANALYSIS BY END USEÂ
FIGURE 11. CANADA MARKET ANALYSIS BY TECHNOLOGYÂ
FIGURE 12. CANADA MARKET ANALYSIS BY REGIONALÂ
FIGURE 13. EUROPE ELECTROCHROMIC GLASS MARKET ANALYSISÂ
FIGURE 14. GERMANY MARKET ANALYSIS BY APPLICATIONÂ
FIGURE 15. GERMANY MARKET ANALYSIS BY PRODUCT TYPEÂ
FIGURE 16. GERMANY MARKET ANALYSIS BY END USEÂ
FIGURE 17. GERMANY MARKET ANALYSIS BY TECHNOLOGYÂ
FIGURE 18. GERMANY MARKET ANALYSIS BY REGIONALÂ
FIGURE 19. UK ELECTROCHROMIC GLASS MARKET ANALYSIS BY APPLICATIONÂ
FIGURE 20. UK MARKET ANALYSIS BY PRODUCT TYPEÂ
FIGURE 21. UK MARKET ANALYSIS BY END USEÂ
FIGURE 22. UK MARKET ANALYSIS BY TECHNOLOGYÂ
FIGURE 23. UK MARKET ANALYSIS BY REGIONALÂ
FIGURE 24. FRANCE ELECTROCHROMIC GLASS MARKET ANALYSIS BY APPLICATIONÂ
FIGURE 25. FRANCE MARKET ANALYSIS BY PRODUCT TYPEÂ
FIGURE 26. FRANCE MARKET ANALYSIS BY END USEÂ
FIGURE 27. FRANCE MARKET ANALYSIS BY TECHNOLOGYÂ
FIGURE 28. FRANCE MARKET ANALYSIS BY REGIONALÂ
FIGURE 29. RUSSIA ELECTROCHROMIC GLASS MARKET ANALYSIS BY APPLICATIONÂ
FIGURE 30. RUSSIA MARKET ANALYSIS BY PRODUCT TYPEÂ
FIGURE 31. RUSSIA MARKET ANALYSIS BY END USEÂ
FIGURE 32. RUSSIA MARKET ANALYSIS BY TECHNOLOGYÂ
FIGURE 33. RUSSIA MARKET ANALYSIS BY REGIONALÂ
FIGURE 34. ITALY ELECTROCHROMIC GLASS MARKET ANALYSIS BY APPLICATIONÂ
FIGURE 35. ITALY MARKET ANALYSIS BY PRODUCT TYPEÂ
FIGURE 36. ITALY MARKET ANALYSIS BY END USEÂ
FIGURE 37. ITALY MARKET ANALYSIS BY TECHNOLOGYÂ
FIGURE 38. ITALY MARKET ANALYSIS BY REGIONALÂ
FIGURE 39. SPAIN ELECTROCHROMIC GLASS MARKET ANALYSIS BY APPLICATIONÂ
FIGURE 40. SPAIN MARKET ANALYSIS BY PRODUCT TYPEÂ
FIGURE 41. SPAIN MARKET ANALYSIS BY END USEÂ
FIGURE 42. SPAIN MARKET ANALYSIS BY TECHNOLOGYÂ
FIGURE 43. SPAIN MARKET ANALYSIS BY REGIONALÂ
FIGURE 44. REST OF EUROPE ELECTROCHROMIC GLASS MARKET ANALYSIS BY APPLICATIONÂ
FIGURE 45. REST OF EUROPE MARKET ANALYSIS BY PRODUCT TYPEÂ
FIGURE 46. REST OF EUROPE MARKET ANALYSIS BY END USEÂ
FIGURE 47. REST OF EUROPE MARKET ANALYSIS BY TECHNOLOGYÂ
FIGURE 48. REST OF EUROPE MARKET ANALYSIS BY REGIONALÂ
FIGURE 49. APAC ELECTROCHROMIC GLASS MARKET ANALYSISÂ
FIGURE 50. CHINA ELECTROCHROMIC GLASS MARKET ANALYSIS BY APPLICATIONÂ
FIGURE 51. CHINA MARKET ANALYSIS BY PRODUCT TYPEÂ
FIGURE 52. CHINA MARKET ANALYSIS BY END USEÂ
FIGURE 53. CHINA MARKET ANALYSIS BY TECHNOLOGYÂ
FIGURE 54. CHINA MARKET ANALYSIS BY REGIONALÂ
FIGURE 55. INDIA ELECTROCHROMIC GLASS MARKET ANALYSIS BY APPLICATIONÂ
FIGURE 56. INDIA MARKET ANALYSIS BY PRODUCT TYPEÂ
FIGURE 57. INDIA MARKET ANALYSIS BY END USEÂ
FIGURE 58. INDIA MARKET ANALYSIS BY TECHNOLOGYÂ
FIGURE 59. INDIA MARKET ANALYSIS BY REGIONALÂ
FIGURE 60. JAPAN ELECTROCHROMIC GLASS MARKET ANALYSIS BY APPLICATIONÂ
FIGURE 61. JAPAN MARKET ANALYSIS BY PRODUCT TYPEÂ
FIGURE 62. JAPAN MARKET ANALYSIS BY END USEÂ
FIGURE 63. JAPAN MARKET ANALYSIS BY TECHNOLOGYÂ
FIGURE 64. JAPAN MARKET ANALYSIS BY REGIONALÂ
FIGURE 65. SOUTH KOREA ELECTROCHROMIC GLASS MARKET ANALYSIS BY APPLICATIONÂ
FIGURE 66. SOUTH KOREA MARKET ANALYSIS BY PRODUCT TYPEÂ
FIGURE 67. SOUTH KOREA MARKET ANALYSIS BY END USEÂ
FIGURE 68. SOUTH KOREA MARKET ANALYSIS BY TECHNOLOGYÂ
FIGURE 69. SOUTH KOREA MARKET ANALYSIS BY REGIONALÂ
FIGURE 70. MALAYSIA ELECTROCHROMIC GLASS MARKET ANALYSIS BY APPLICATIONÂ
FIGURE 71. MALAYSIA MARKET ANALYSIS BY PRODUCT TYPEÂ
FIGURE 72. MALAYSIA MARKET ANALYSIS BY END USEÂ
FIGURE 73. MALAYSIA MARKET ANALYSIS BY TECHNOLOGYÂ
FIGURE 74. MALAYSIA MARKET ANALYSIS BY REGIONALÂ
FIGURE 75. THAILAND ELECTROCHROMIC GLASS MARKET ANALYSIS BY APPLICATIONÂ
FIGURE 76. THAILAND MARKET ANALYSIS BY PRODUCT TYPEÂ
FIGURE 77. THAILAND MARKET ANALYSIS BY END USEÂ
FIGURE 78. THAILAND MARKET ANALYSIS BY TECHNOLOGYÂ
FIGURE 79. THAILAND MARKET ANALYSIS BY REGIONALÂ
FIGURE 80. INDONESIA ELECTROCHROMIC GLASS MARKET ANALYSIS BY APPLICATIONÂ
FIGURE 81. INDONESIA MARKET ANALYSIS BY PRODUCT TYPEÂ
FIGURE 82. INDONESIA MARKET ANALYSIS BY END USEÂ
FIGURE 83. INDONESIA MARKET ANALYSIS BY TECHNOLOGYÂ
FIGURE 84. INDONESIA MARKET ANALYSIS BY REGIONALÂ
FIGURE 85. REST OF APAC ELECTROCHROMIC GLASS MARKET ANALYSIS BY APPLICATIONÂ
FIGURE 86. REST OF APAC MARKET ANALYSIS BY PRODUCT TYPEÂ
FIGURE 87. REST OF APAC MARKET ANALYSIS BY END USEÂ
FIGURE 88. REST OF APAC MARKET ANALYSIS BY TECHNOLOGYÂ
FIGURE 89. REST OF APAC MARKET ANALYSIS BY REGIONALÂ
FIGURE 90. SOUTH AMERICA ELECTROCHROMIC GLASS MARKET ANALYSISÂ
FIGURE 91. BRAZIL ELECTROCHROMIC GLASS MARKET ANALYSIS BY APPLICATIONÂ
FIGURE 92. BRAZIL MARKET ANALYSIS BY PRODUCT TYPEÂ
FIGURE 93. BRAZIL MARKET ANALYSIS BY END USEÂ
FIGURE 94. BRAZIL MARKET ANALYSIS BY TECHNOLOGYÂ
FIGURE 95. BRAZIL MARKET ANALYSIS BY REGIONALÂ
FIGURE 96. MEXICO ELECTROCHROMIC GLASS MARKET ANALYSIS BY APPLICATIONÂ
FIGURE 97. MEXICO MARKET ANALYSIS BY PRODUCT TYPEÂ
FIGURE 98. MEXICO MARKET ANALYSIS BY END USEÂ
FIGURE 99. MEXICO MARKET ANALYSIS BY TECHNOLOGYÂ
FIGURE 100. MEXICO MARKET ANALYSIS BY REGIONALÂ
FIGURE 101. ARGENTINA ELECTROCHROMIC GLASS MARKET ANALYSIS BY APPLICATIONÂ
FIGURE 102. ARGENTINA MARKET ANALYSIS BY PRODUCT TYPEÂ
FIGURE 103. ARGENTINA MARKET ANALYSIS BY END USEÂ
FIGURE 104. ARGENTINA MARKET ANALYSIS BY TECHNOLOGYÂ
FIGURE 105. ARGENTINA MARKET ANALYSIS BY REGIONALÂ
FIGURE 106. REST OF SOUTH AMERICA ELECTROCHROMIC GLASS MARKET ANALYSIS BY APPLICATIONÂ
FIGURE 107. REST OF SOUTH AMERICA MARKET ANALYSIS BY PRODUCT TYPEÂ
FIGURE 108. REST OF SOUTH AMERICA MARKET ANALYSIS BY END USEÂ
FIGURE 109. REST OF SOUTH AMERICA MARKET ANALYSIS BY TECHNOLOGYÂ
FIGURE 110. REST OF SOUTH AMERICA MARKET ANALYSIS BY REGIONALÂ
FIGURE 111. MEA ELECTROCHROMIC GLASS MARKET ANALYSISÂ
FIGURE 112. GCC COUNTRIES ELECTROCHROMIC GLASS MARKET ANALYSIS BY APPLICATIONÂ
FIGURE 113. GCC COUNTRIES MARKET ANALYSIS BY PRODUCT TYPEÂ
FIGURE 114. GCC COUNTRIES MARKET ANALYSIS BY END USEÂ
FIGURE 115. GCC COUNTRIES MARKET ANALYSIS BY TECHNOLOGYÂ
FIGURE 116. GCC COUNTRIES MARKET ANALYSIS BY REGIONALÂ
FIGURE 117. SOUTH AFRICA ELECTROCHROMIC GLASS MARKET ANALYSIS BY APPLICATIONÂ
FIGURE 118. SOUTH AFRICA MARKET ANALYSIS BY PRODUCT TYPEÂ
FIGURE 119. SOUTH AFRICA MARKET ANALYSIS BY END USEÂ
FIGURE 120. SOUTH AFRICA MARKET ANALYSIS BY TECHNOLOGYÂ
FIGURE 121. SOUTH AFRICA MARKET ANALYSIS BY REGIONALÂ
FIGURE 122. REST OF MEA ELECTROCHROMIC GLASS MARKET ANALYSIS BY APPLICATIONÂ
FIGURE 123. REST OF MEA MARKET ANALYSIS BY PRODUCT TYPEÂ
FIGURE 124. REST OF MEA MARKET ANALYSIS BY END USEÂ
FIGURE 125. REST OF MEA MARKET ANALYSIS BY TECHNOLOGYÂ
FIGURE 126. REST OF MEA MARKET ANALYSIS BY REGIONALÂ
FIGURE 127. KEY BUYING CRITERIA OF ELECTROCHROMIC GLASS MARKETÂ
FIGURE 128. RESEARCH PROCESS OF MRFRÂ
FIGURE 129. DRO ANALYSIS OF MARKETÂ
FIGURE 130. DRIVERS IMPACT ANALYSIS: ELECTROCHROMIC GLASS MARKETÂ
FIGURE 131. RESTRAINTS IMPACT ANALYSIS: ELECTROCHROMIC GLASS MARKETÂ
FIGURE 132. SUPPLY / VALUE CHAIN: ELECTROCHROMIC GLASS MARKETÂ
FIGURE 133. MARKET BY APPLICATION, 2025 (% SHARE)Â
FIGURE 134. MARKET BY APPLICATION, 2019 TO 2035 (USD Billions)Â
FIGURE 135. MARKET BY PRODUCT TYPE, 2025 (% SHARE)Â
FIGURE 136. MARKET BY PRODUCT TYPE, 2019 TO 2035 (USD Billions)Â
FIGURE 137. MARKET BY END USE, 2025 (% SHARE)Â
FIGURE 138. MARKET BY END USE, 2019 TO 2035 (USD Billions)Â
FIGURE 139. MARKET BY TECHNOLOGY, 2025 (% SHARE)Â
FIGURE 140. MARKET BY TECHNOLOGY, 2019 TO 2035 (USD Billions)Â
FIGURE 141. MARKET BY REGIONAL, 2025 (% SHARE)Â
FIGURE 142. MARKET BY REGIONAL, 2019 TO 2035 (USD Billions)Â
FIGURE 143. BENCHMARKING OF MAJOR COMPETITORSÂ
Â
Â