Electric Vehicle (EVs) Market (2026 - 2035)

ID: MRFR/AT/1261-CR
128 Pages
Triveni Bhoyar
Last Updated: August 24, 2026
EVs Market Research Report By Powertrain (BEV (Battery Electric Vehicle), PHEV (Plug-in Hybrid Electric Vehicle), FCEV (Fuel Cell Electric Vehicle)), By Vehicle Type (Passenger Car, Commercial Vehicle), By Battery Chemistry (Lithium Iron Phosphate (LFP), Lithium Nickel Manganese Cobalt Oxide (NMC), Other (NCA, Solid-State, LMO)), By Motor Architecture (Permanent-Magnet Synchronous Motor (PMSM), Induction Motor, Other (Switched Reluctance, Axial Flux)), By Range (Short Range (<600 km)), By Voltage Platform (Low Voltage (800V)) and By Regional (North America, Europe, South America, Asia Pacific, Middle East and Africa) - Forecast to 2035
Electric Vehicle (EVs) Market
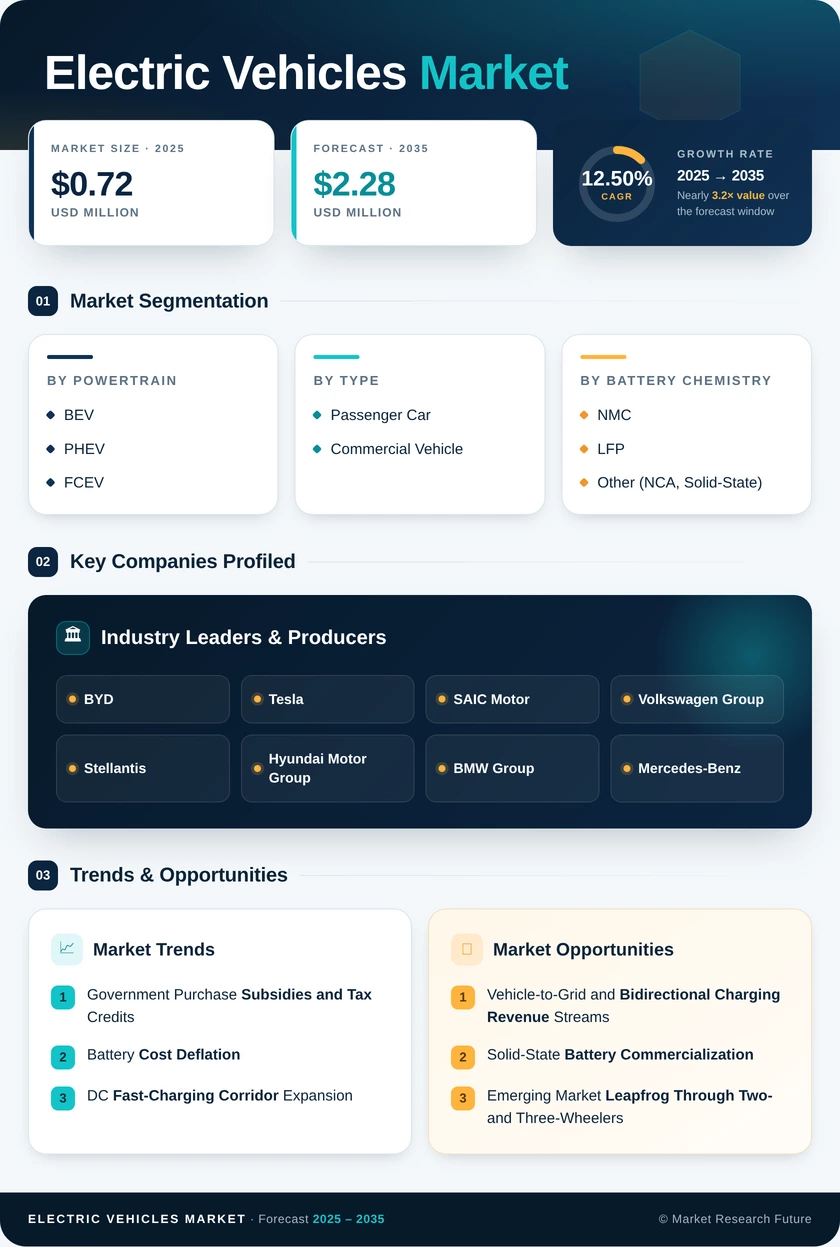
Market Size
Forecast Period2026-2035
CAGR (2026-2035)12.50%
2025 Market SizeUSD 0.72 Trillion
2035 Market SizeUSD 2.28 Trillion
Key Players
BYD
Tesla
SAIC Motor
Volkswagen Group
Stellantis
Hyundai Motor Group
Opportunities
  • Vehicle-to-Grid and Bidirectional Charging Revenue Streams
  • Solid-State Battery Commercialization
  • Emerging Market Leapfrog Through Two- and Three-Wheelers
  1. 1 Market Overview |
    1. 1.1 Study Assumptions & Market Definition |
    2. 1.2 Scope of the Study |
    3. 1.3 Research Methodology
  2. 2 Market Summary & Key Takeaways
  3. 3 Market Dynamics |
    1. 3.1 Market Drivers Analysis | |
      1. 3.1.1 Government Purchase Subsidies and Tax Credits | |
      2. 3.1.2 Battery Cost Deflation (LFP and NMC Advances) | |
      3. 3.1.3 DC Fast-Charging Corridor Expansion | |
      4. 3.1.4 Fleet-Average CO₂ Regulations and Penalties | |
      5. 3.1.5 Commercial Fleet TCO Crossover Below Diesel | |
      6. 3.1.6 800V Platform Standardization | |
      7. 3.1.7 Consumer Sentiment Shift and Urban Driving Bans |
    2. 3.2 Market Restraints Analysis | |
      1. 3.2.1 Critical Mineral Supply Concentration | |
      2. 3.2.2 Grid Capacity Constraints | |
      3. 3.2.3 High Upfront Vehicle Cost in Emerging Markets | |
      4. 3.2.4 Residual Value Uncertainty for Used EVs | |
      5. 3.2.5 Skilled Labor Shortage for EV Maintenance |
    3. 3.3 Market Opportunity Analysis | |
      1. 3.3.1 Vehicle-to-Grid and Bidirectional Charging Revenue Streams | |
      2. 3.3.2 Solid-State Battery Commercialization | |
      3. 3.3.3 Emerging Market Leapfrog Through Two- and Three-Wheelers | |
      4. 3.3.4 Software-Defined Vehicles and Subscription Revenue | |
      5. 3.3.5 Fleet-as-a-Service for Commercial Operators |
    4. 3.4 Industry Value Chain Analysis |
    5. 3.5 Porter's Five Forces Analysis
  4. 4 Global Electric Vehicle Market Size & Forecast (2021–2035) |
    1. 4.1 Historical Market Size (2021–2025) |
    2. 4.2 Current & Forecast Market Size (2026–2035) |
    3. 4.3 Market Size by Revenue (USD Trillion) |
    4. 4.4 Year-over-Year Growth Analysis
  5. 5 Segmentation Analysis |
    1. 5.1 By Powertrain | |
      1. 5.1.1 BEV (Battery Electric Vehicle) | |
      2. 5.1.2 PHEV (Plug-in Hybrid Electric Vehicle) | |
      3. 5.1.3 FCEV (Fuel Cell Electric Vehicle) |
    2. 5.2 By Vehicle Type | |
      1. 5.2.1 Passenger Car | |
      2. 5.2.2 Commercial Vehicle |
    3. 5.3 By Battery Chemistry | |
      1. 5.3.1 Lithium Iron Phosphate (LFP) | |
      2. 5.3.2 Lithium Nickel Manganese Cobalt Oxide (NMC) | |
      3. 5.3.3 Other (NCA, Solid-State, LMO) |
    4. 5.4 By Motor Architecture | |
      1. 5.4.1 Permanent-Magnet Synchronous Motor (PMSM) | |
      2. 5.4.2 Induction Motor | |
      3. 5.4.3 Other (Switched Reluctance, Axial Flux) |
    5. 5.5 By Range | |
      1. 5.5.1 Short Range (600 km) |
    6. 5.6 By Voltage Platform | |
      1. 5.6.1 Low Voltage (800V)
  6. 6 Regional Analysis |
    1. 6.1 North America | |
      1. 6.1.1 United States | |
      2. 6.1.2 Canada | |
      3. 6.1.3 Mexico |
    2. 6.2 Europe | |
      1. 6.2.1 Germany | |
      2. 6.2.2 United Kingdom | |
      3. 6.2.3 France | |
      4. 6.2.4 Italy | |
      5. 6.2.5 Spain | |
      6. 6.2.6 Nordic Countries | |
      7. 6.2.7 Russia | |
      8. 6.2.8 Rest of Europe |
    3. 6.3 Asia-Pacific | |
      1. 6.3.1 China | |
      2. 6.3.2 India | |
      3. 6.3.3 Japan | |
      4. 6.3.4 South Korea | |
      5. 6.3.5 ASEAN | |
      6. 6.3.6 Rest of Asia-Pacific |
    4. 6.4 South America | |
      1. 6.4.1 Brazil | |
      2. 6.4.2 Argentina | |
      3. 6.4.3 Rest of South America |
    5. 6.5 Middle East & Africa | |
      1. 6.5.1 Saudi Arabia | |
      2. 6.5.2 UAE | |
      3. 6.5.3 South Africa | |
      4. 6.5.4 Egypt | |
      5. 6.5.5 Rest of MEA
  7. 7 Competitive Landscape |
    1. 7.1 Market Share Analysis (2025) |
    2. 7.2 Competitive Benchmarking Matrix |
    3. 7.3 Company Profiles | |
      1. 7.3.1 BYD | |
      2. 7.3.2 Tesla | |
      3. 7.3.3 SAIC Motor | |
      4. 7.3.4 Volkswagen Group | |
      5. 7.3.5 Stellantis | |
      6. 7.3.6 Hyundai Motor Group | |
      7. 7.3.7 BMW Group | |
      8. 7.3.8 Mercedes-Benz | |
      9. 7.3.9 Geely (incl. Volvo Cars) | |
      10. 7.3.10 NIO | |
      11. 7.3.11 Rivian
  8. 8 Future Outlook & Strategic Recommendations (2026–2035) |
    1. 8.1 Autonomous Electric Mobility Convergence |
    2. 8.2 Battery Recycling and Circular Economy |
    3. 8.3 Electrification Supercycle and Energy System Integration |
    4. 8.4 ESG Reporting and Supply-Chain Transparency
  9. 9 Recent Developments & News
  10. 10 Frequently Asked Questions (FAQs)
  11. 11 Report Scope & Methodology |
    1. 11.1 Study Period & Base Year |
    2. 11.2 Data Sources & Citations |
    3. 11.3 Abbreviations
  12. 12 LIST OF TABLES |
  13. TABLE 1 Global Electric Vehicle Market Size & Forecast, by Revenue (USD Billion), 2021–2035 |
  14. TABLE 2 Global Electric Vehicle Market — Year-over-Year Growth Analysis, 2021–2035 |
  15. TABLE 3 Global Electric Vehicle Market — Driver Impact Analysis |
  16. TABLE 4 Global Electric Vehicle Market — Restraint Impact Analysis |
  17. TABLE 5 Global Electric Vehicle Market Size, by Powertrain, 2021–2035 (USD Billion) |
  18. TABLE 6 Global Electric Vehicle Market Size, by Vehicle Type, 2021–2035 (USD Billion) |
  19. TABLE 7 Global Electric Vehicle Market Size, by Battery Chemistry, 2021–2035 (USD Billion) |
  20. TABLE 8 Global Electric Vehicle Market Size, by Motor Architecture, 2021–2035 (USD Billion) |
  21. TABLE 9 Global Electric Vehicle Market Size, by Range, 2021–2035 (USD Billion) |
  22. TABLE 10 Global Electric Vehicle Market Size, by Voltage Platform, 2021–2035 (USD Billion) |
  23. TABLE 11 Global Electric Vehicle Market Size, by Region, 2021–2035 (USD Billion) |
  24. TABLE 12 North America Electric Vehicle Market Size, by Country, 2021–2035 (USD Billion) |
  25. TABLE 13 Europe Electric Vehicle Market Size, by Country, 2021–2035 (USD Billion) |
  26. TABLE 14 Asia-Pacific Electric Vehicle Market Size, by Country, 2021–2035 (USD Billion) |
  27. TABLE 15 South America Electric Vehicle Market Size, by Country, 2021–2035 (USD Billion) |
  28. TABLE 16 Middle East & Africa Electric Vehicle Market Size, by Country, 2021–2035 (USD Billion) |
  29. TABLE 17 Competitive Benchmarking Matrix — Global Electric Vehicle Market, 2025 |
  30. TABLE 18 Company Profiles — Key Players, Global Electric Vehicle Market |
  31. TABLE 19 Recent Developments & Strategic Announcements, 2023–2025 |
  32. TABLE 20 Regional Summary — Key Metrics and Investment Themes |
  33. TABLE 21 Report Scope & Methodology Summary |
  34. TABLE 22 Detailed Sources and Citations |
  35. TABLE 23 North America Electric Vehicle Market Size, by Powertrain, 2021–2035 (USD Billion) |
  36. TABLE 24 North America Electric Vehicle Market Size, by Vehicle Type, 2021–2035 (USD Billion) |
  37. TABLE 25 North America Electric Vehicle Market Size, by Battery Chemistry, 2021–2035 (USD Billion) |
  38. TABLE 26 North America Electric Vehicle Market Size, by Motor Architecture, 2021–2035 (USD Billion) |
  39. TABLE 27 North America Electric Vehicle Market Size, by Range, 2021–2035 (USD Billion) |
  40. TABLE 28 North America Electric Vehicle Market Size, by Voltage Platform, 2021–2035 (USD Billion) |
  41. TABLE 29 Europe Electric Vehicle Market Size, by Powertrain, 2021–2035 (USD Billion) |
  42. TABLE 30 Europe Electric Vehicle Market Size, by Vehicle Type, 2021–2035 (USD Billion) |
  43. TABLE 31 Europe Electric Vehicle Market Size, by Battery Chemistry, 2021–2035 (USD Billion) |
  44. TABLE 32 Europe Electric Vehicle Market Size, by Motor Architecture, 2021–2035 (USD Billion) |
  45. TABLE 33 Europe Electric Vehicle Market Size, by Range, 2021–2035 (USD Billion) |
  46. TABLE 34 Europe Electric Vehicle Market Size, by Voltage Platform, 2021–2035 (USD Billion) |
  47. TABLE 35 Asia-Pacific Electric Vehicle Market Size, by Powertrain, 2021–2035 (USD Billion) |
  48. TABLE 36 Asia-Pacific Electric Vehicle Market Size, by Vehicle Type, 2021–2035 (USD Billion) |
  49. TABLE 37 Asia-Pacific Electric Vehicle Market Size, by Battery Chemistry, 2021–2035 (USD Billion) |
  50. TABLE 38 Asia-Pacific Electric Vehicle Market Size, by Motor Architecture, 2021–2035 (USD Billion) |
  51. TABLE 39 Asia-Pacific Electric Vehicle Market Size, by Range, 2021–2035 (USD Billion) |
  52. TABLE 40 Asia-Pacific Electric Vehicle Market Size, by Voltage Platform, 2021–2035 (USD Billion) |
  53. TABLE 41 South America Electric Vehicle Market Size, by Powertrain, 2021–2035 (USD Billion) |
  54. TABLE 42 South America Electric Vehicle Market Size, by Vehicle Type, 2021–2035 (USD Billion) |
  55. TABLE 43 South America Electric Vehicle Market Size, by Battery Chemistry, 2021–2035 (USD Billion) |
  56. TABLE 44 South America Electric Vehicle Market Size, by Motor Architecture, 2021–2035 (USD Billion) |
  57. TABLE 45 South America Electric Vehicle Market Size, by Range, 2021–2035 (USD Billion) |
  58. TABLE 46 South America Electric Vehicle Market Size, by Voltage Platform, 2021–2035 (USD Billion) |
  59. TABLE 47 Middle East & Africa Electric Vehicle Market Size, by Powertrain, 2021–2035 (USD Billion) |
  60. TABLE 48 Middle East & Africa Electric Vehicle Market Size, by Vehicle Type, 2021–2035 (USD Billion) |
  61. TABLE 49 Middle East & Africa Electric Vehicle Market Size, by Battery Chemistry, 2021–2035 (USD Billion) |
  62. TABLE 50 Middle East & Africa Electric Vehicle Market Size, by Motor Architecture, 2021–2035 (USD Billion) |
  63. TABLE 51 Middle East & Africa Electric Vehicle Market Size, by Range, 2021–2035 (USD Billion) |
  64. TABLE 52 Middle East & Africa Electric Vehicle Market Size, by Voltage Platform, 2021–2035 (USD Billion)
  65. 13 LIST OF FIGURES |
  66. FIGURE 1 Global Electric Vehicle Market Dynamics — Drivers, Restraints, and Opportunities |
  67. FIGURE 2 Electric Vehicle Industry Value Chain Analysis |
  68. FIGURE 3 Porter's Five Forces Analysis — Global Electric Vehicle Market |
  69. FIGURE 4 Global Electric Vehicle Market Size Trend & Forecast (USD Billion), 2021–2035 |
  70. FIGURE 5 Global Electric Vehicle Market Share, by Powertrain, 2025 (%) |
  71. FIGURE 6 Global Electric Vehicle Market Share, by Vehicle Type, 2025 (%) |
  72. FIGURE 7 Global Electric Vehicle Market Share, by Battery Chemistry, 2025 (%) |
  73. FIGURE 8 Global Electric Vehicle Market Share, by Motor Architecture, 2025 (%) |
  74. FIGURE 9 Global Electric Vehicle Market Share, by Range, 2025 (%) |
  75. FIGURE 10 Global Electric Vehicle Market Share, by Voltage Platform, 2025 (%) |
  76. FIGURE 11 Global Electric Vehicle Market Share, by Region, 2025 (%) |
  77. FIGURE 12 North America Electric Vehicle Market Size Trend (USD Billion), 2021–2035 |
  78. FIGURE 13 Europe Electric Vehicle Market Size Trend (USD Billion), 2021–2035 |
  79. FIGURE 14 Asia-Pacific Electric Vehicle Market Size Trend (USD Billion), 2021–2035 |
  80. FIGURE 15 South America Electric Vehicle Market Size Trend (USD Billion), 2021–2035 |
  81. FIGURE 16 Middle East & Africa Electric Vehicle Market Size Trend (USD Billion), 2021–2035 |
  82. FIGURE 17 Competitive Landscape — Market Share Analysis, 2025 |
  83. FIGURE 18 Competitive Positioning Matrix — Key Players, Global Electric Vehicle Market

Segmentation Quick Reference

DimensionSub-SegmentsDominant SegmentFastest Growing Segment
PowertrainBEV, PHEV, FCEVBEV (76.3% share, 2025)BEV
Vehicle TypePassenger Car, Commercial VehiclePassenger Car (~84% share, 2025)Commercial Vehicle (13.8% CAGR)
Battery ChemistryLFP, NMC, OtherNMC (~45% share, 2025)LFP (16.1% CAGR)
Motor ArchitecturePMSM, Induction, OtherPMSM (~72% share, 2025)PMSM
RangeShort, Mid-Range, Long Range, Ultra-LongMid-Range (~44% share, 2025)Ultra-Long Range (15.6% CAGR)
Voltage PlatformLow, Mid, High, Ultra-HighMid-Voltage (~51% share, 2025)Ultra-High Voltage (17.2% CAGR)


Market Segmentation Overview

By Powertrain

Sub-SegmentKey Trend
BEV (Battery Electric Vehicle)Dominant powertrain as subsidy structures increasingly favor zero-tailpipe-emission models
PHEV (Plug-in Hybrid Electric Vehicle)Declining share as fast-charging networks close the convenience gap with combustion hybrids
FCEV (Fuel Cell Electric Vehicle)Niche role concentrated in heavy-duty trucking and hydrogen-corridor pilot regions


Battery electric vehicles continue to consolidate share as pack costs fall and governments restrict full incentive eligibility to zero-emission drivetrains. Plug-in hybrids serve a transitional role in markets with limited charging density, while fuel cell electrics remain commercially viable primarily in long-haul and industrial applications where hydrogen refueling infrastructure exists.

By Vehicle Type

Sub-SegmentKey Trend
Passenger CarCrossover SUVs and mid-size sedans drive volume in the USD 30,000–50,000 price band
Commercial VehicleLast-mile delivery vans and urban transit buses achieve TCO parity with diesel equivalents


Passenger cars represent the revenue backbone, with electric crossovers emerging as the dominant global body style. Commercial vehicles are the growth catalyst, driven by fleet procurement decisions anchored in total cost of ownership calculations rather than retail consumer sentiment.

By Battery Chemistry

Sub-SegmentKey Trend
Lithium Nickel Manganese Cobalt Oxide (NMC)Retained dominance in premium, range-focused applications
Lithium Iron Phosphate (LFP)Fastest-growing chemistry due to cost advantage and improved energy density
Other (NCA, Solid-State, LMO)Emerging solid-state technologies targeting commercial production by 2027–2029


NMC retains the largest chemistry share thanks to superior energy density favored by premium OEMs. LFP is gaining rapidly on the back of Chinese supply-chain scale and improved cell-level performance that narrows the energy-density gap to within 15–20% of NMC equivalents.

By Motor Architecture

Sub-SegmentKey Trend
Permanent-Magnet Synchronous Motor (PMSM)Preferred for efficiency and compact packaging in passenger EVs
Induction MotorGrowing interest as rare-earth supply risks drive demand for magnet-free alternatives
Other (Switched Reluctance, Axial Flux)R&D-stage technologies with potential for next-generation EV platforms


PMSM motors dominate due to their superior torque density and efficiency, though rare-earth supply concentration in China is prompting several OEMs to develop induction and switched-reluctance alternatives for de-risked supply chains.

By Range

Sub-SegmentKey Trend
Short Range (<200 km)Urban commuter and micro-mobility segment
Mid-Range (200–400 km)Mass-market sweet spot balancing cost and daily usability
Long Range (400–600 km)Growing buyer preference for versatility and reduced charging frequency
Ultra-Long Range (>600 km)Premium and commercial applications enabled by high-density cells


Mid-range models account for the largest share, offering sufficient range for daily commuting at accessible price points. Long-range and ultra-long-range variants are the fastest-growing segments as buyers increasingly prioritize trip flexibility and highway usability.

By Voltage Platform

Sub-SegmentKey Trend
Low Voltage (<200V)Two-wheelers and micro-EVs in emerging markets
Mid-Voltage (200–400V)Legacy platform standard transitioning toward higher architectures
High Voltage (400–800V)Enabling ultra-fast charging and improved drivetrain efficiency
Ultra-High Voltage (>800V)Performance and heavy-duty platforms pioneered by Porsche, Hyundai, and Kia


The industry is migrating from 400V to 800V architectures to enable sub-20-minute fast-charge sessions and reduce wiring weight. Ultra-high-voltage platforms above 800V are emerging in performance and commercial segments where thermal efficiency and power delivery are critical differentiators.




Download PDF ×

We do not share your information with anyone. However, we may send you emails based on your report interest from time to time. You may contact us at any time to opt-out.