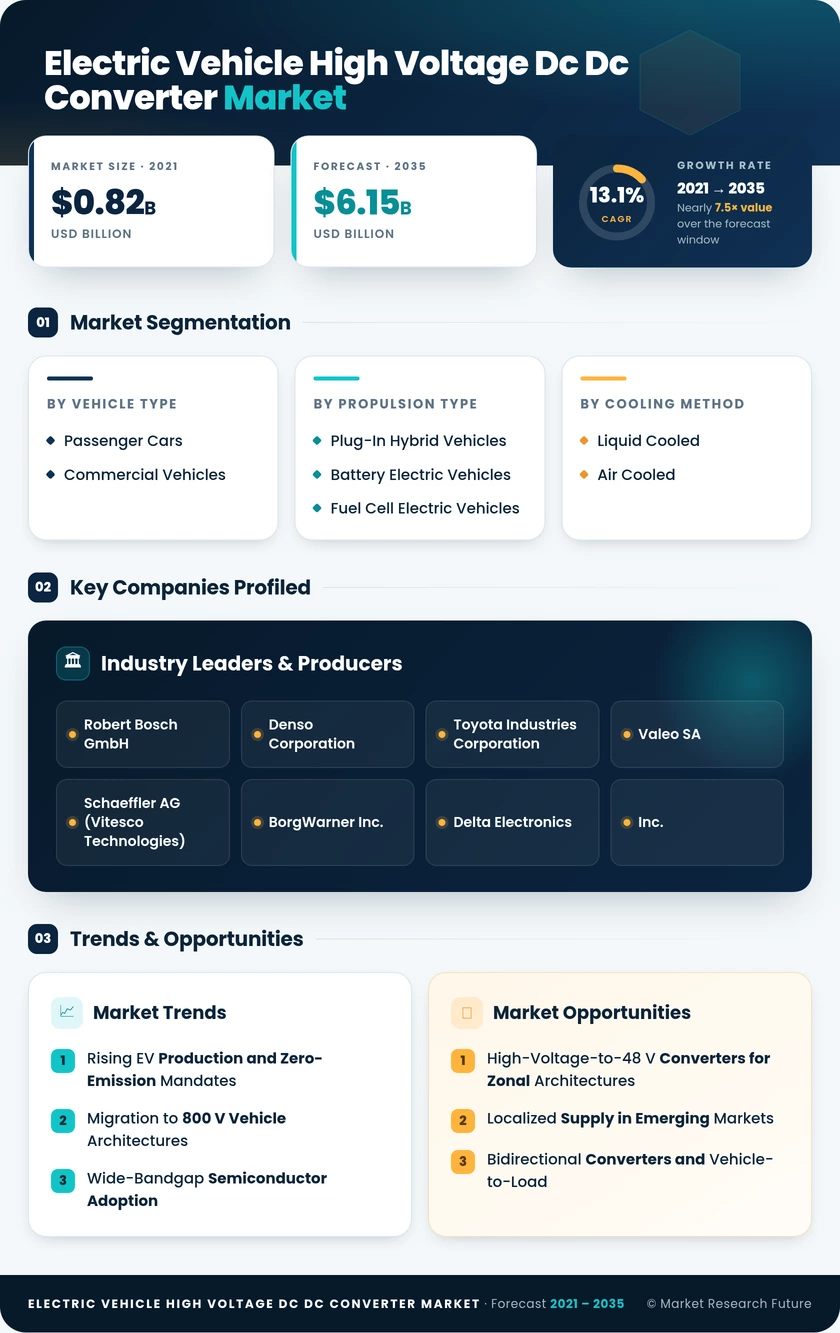
Electric Vehicle High Voltage Dc Dc Converter Market (2026 - 2035)

ID: MRFR/AT/33458-HCR 100 Pages Abbas Raut Last Updated: November 08, 2026
Electric Vehicle High Voltage DC-DC Converter Market Research Report By Vehicle Type (Passenger Cars, Commercial Vehicles), By Propulsion Type (Plug-In Hybrid Vehicles, Battery Electric Vehicles, Fuel Cell Electric Vehicles), By Cooling Method (Liquid Cooled, Air-Cooled), By Input Voltage (200 V – 450 V, 450 V - 800 V, 800 V - 1000 V), By Output Voltage (12 V – 24 V, 24 V – 48 V), By Output Power (Less Than 2kW, 2kW and Above) - Forecast to 2035
Electric Vehicle High Voltage Dc Dc Converter Market
Market Size
Forecast Period2026-2035
CAGR (2026-2035)3.86%
2025 Market SizeUSD 125.2 Billion
2035 Market SizeUSD 182.85 Billion
Key Players
Robert Bosch GmbH
Denso Corporation
Toyota Industries Corporation
Valeo SA
Schaeffler AG
BorgWarner Inc.
Opportunities
  • High-Voltage-to-48 V Converters for Zonal Architectures
  • Localized Supply in Emerging Markets
  • Bidirectional Converters and Vehicle-to-Load
  1. 1 Market Summary | |
  2. 2 Key Report Takeaways | |
    1. 2.1 By Vehicle Type | |
    2. 2.2 By Propulsion Type | |
    3. 2.3 By Cooling Method | |
    4. 2.4 By Region | |
  3. 3 Market Size and Forecast (2021–2035) | |
    1. 3.1 Historical Market Size (2021–2025) | |
    2. 3.2 Forecast Market Size (2026–2035) | |
    3. 3.3 Year-over-Year Growth Analysis | |
  4. 4 Driver Impact Analysis | |
    1. 4.1 Rising EV Production and Zero-Emission Mandates | |
    2. 4.2 Migration to 800 V Vehicle Architectures | |
    3. 4.3 Wide-Bandgap Semiconductor Adoption | |
    4. 4.4 Purchase Incentives and Industrial Policy | |
    5. 4.5 Growing Low-Voltage Auxiliary Loads | |
    6. 4.6 Commercial Vehicle Electrification | |
  5. 5 Restraints Impact Analysis | |
    1. 5.1 SiC Substrate Cost and Supply Concentration | |
    2. 5.2 OEM Price Pressure and EV Price Wars | |
    3. 5.3 EV Policy Volatility | |
    4. 5.4 Integration Compressing Standalone Converter Value | |
    5. 5.5 Functional Safety and Validation Burden | |
  6. 6 Opportunities | |
    1. 6.1 High-Voltage-to-48 V Converters for Zonal Architectures | |
    2. 6.2 Localized Supply in Emerging Markets | |
    3. 6.3 Bidirectional Converters and Vehicle-to-Load | |
    4. 6.4 Converter Telemetry and Service-Based Revenue | |
    5. 6.5 Fuel Cell and Heavy-Duty Platforms | |
  7. 7 Regional Market Share and Country-Level Analysis | |
    1. 7.1 North America | | |
      1. 7.1.1 US | | |
      2. 7.1.2 Canada | | |
      3. 7.1.3 Mexico | |
    2. 7.2 Europe | | |
      1. 7.2.1 Germany | | |
      2. 7.2.2 UK | | |
      3. 7.2.3 France | | |
      4. 7.2.4 Italy | | |
      5. 7.2.5 Spain | | |
      6. 7.2.6 Nordic Countries | | |
      7. 7.2.7 Russia | | |
      8. 7.2.8 Rest of Europe | |
    3. 7.3 Asia-Pacific | | |
      1. 7.3.1 China | | |
      2. 7.3.2 India | | |
      3. 7.3.3 Japan | | |
      4. 7.3.4 South Korea | | |
      5. 7.3.5 ASEAN | | |
      6. 7.3.6 Rest of Asia-Pacific | |
    4. 7.4 South America | | |
      1. 7.4.1 Brazil | | |
      2. 7.4.2 Argentina | | |
      3. 7.4.3 Rest of South America | |
    5. 7.5 Middle East and Africa | | |
      1. 7.5.1 Saudi Arabia | | |
      2. 7.5.2 UAE | | |
      3. 7.5.3 South Africa | | |
      4. 7.5.4 Egypt | | |
      5. 7.5.5 Rest of MEA | |
  8. 8 Future Outlook (2026–2035) | |
    1. 8.1 800 V Becomes the Mainstream Platform | |
    2. 8.2 Wide-Bandgap Cost Curves Reshape Design Choices | |
    3. 8.3 Software-Defined Vehicles and Zonal Power | |
    4. 8.4 Supply Chain Transparency and Circularity | |
  9. 9 Segmentation Analysis | |
    1. 9.1 By Vehicle Type | | |
      1. 9.1.1 Passenger Cars | | |
      2. 9.1.2 Commercial Vehicles | |
    2. 9.2 By Propulsion Type | | |
      1. 9.2.1 Plug-In Hybrid Vehicles | | |
      2. 9.2.2 Battery Electric Vehicles | | |
      3. 9.2.3 Fuel Cell Electric Vehicles | |
    3. 9.3 By Cooling Method | | |
      1. 9.3.1 Liquid Cooled | | |
      2. 9.3.2 Air-Cooled | |
    4. 9.4 By Input Voltage | | |
      1. 9.4.1 200 V – 450 V | | |
      2. 9.4.2 450 V - 800 V | | |
      3. 9.4.3 800 V - 1000 V | |
    5. 9.5 By Output Voltage | | |
      1. 9.5.1 12 V – 24 V | | |
      2. 9.5.2 24 V – 48 V | |
    6. 9.6 By Output Power | | |
      1. 9.6.1 Less Than 2kW | | |
      2. 9.6.2 2kW and Above | |
  10. 10 Competitive Landscape | |
    1. 10.1 Market Concentration Analysis | |
    2. 10.2 Competitive Benchmarking Matrix | |
    3. 10.3 Company Profiles | | |
      1. 10.3.1 Robert Bosch GmbH | | |
      2. 10.3.2 Denso Corporation | | |
      3. 10.3.3 Toyota Industries Corporation | | |
      4. 10.3.4 Valeo SA | | |
      5. 10.3.5 Schaeffler AG (Vitesco Technologies) | | |
      6. 10.3.6 BorgWarner Inc. | | |
      7. 10.3.7 Delta Electronics, Inc. | | |
      8. 10.3.8 Hyundai Mobis Co., Ltd. | | |
      9. 10.3.9 LG Magna e-Powertrain | | |
      10. 10.3.10 TDK Corporation | |
  11. 11 Recent News and Developments | |
  12. 12 Report Scope and Methodology | |
  13. 13 Detailed Sources and Citations | |
  14. 14 Frequently Asked Questions (FAQs) | | LIST OF TABLES | |
  15. TABLE 1 Global Market Size and Forecast, by Revenue (USD Billion), 2021–2035 | |
  16. TABLE 2 Driver Impact Analysis, 2026–2035 | |
  17. TABLE 3 Restraints Impact Analysis, 2026–2035 | |
  18. TABLE 4 Regional Summary, 2025 | |
  19. TABLE 5 North America Market, by Country, 2025 | |
  20. TABLE 6 Europe Market, by Country, 2025 | |
  21. TABLE 7 Asia-Pacific Market, by Country, 2025 | |
  22. TABLE 8 South America Market, by Country, 2025 | |
  23. TABLE 9 Middle East and Africa Market, by Country, 2025 | |
  24. TABLE 10 Global Market, by Vehicle Type, 2025 | |
  25. TABLE 11 Global Market, by Propulsion Type, 2025 | |
  26. TABLE 12 Global Market, by Cooling Method, 2025 | |
  27. TABLE 13 Competitive Benchmarking Matrix, 2025 | |
  28. TABLE 14 Report Scope and Methodology | |
  29. TABLE 15 Detailed Sources and Citations | | LIST OF FIGURES | |
  30. FIGURE 1 Market Dynamics Overview — Drivers, Restraints and Opportunities | |
  31. FIGURE 2 Industry Value Chain Analysis | |
  32. FIGURE 3 Porter's Five Forces Analysis | |
  33. FIGURE 4 Global Market Size Trend (USD Billion), 2021–2035 | |
  34. FIGURE 5 Market Share by Vehicle Type, 2025 | |
  35. FIGURE 6 Market Share by Propulsion Type, 2025 | |
  36. FIGURE 7 Market Share by Cooling Method, 2025 | |
  37. FIGURE 8 Regional Market Share, 2025 | |
  38. FIGURE 9 Regional CAGR Comparison, 2026–2035 | |
  39. FIGURE 10 Competitive Landscape — Estimated Revenue Share Ranges, 2025

Segmentation Quick Reference

DimensionSub-SegmentsDominant SegmentFastest Growing Segment
By Vehicle TypePassenger Cars; Commercial VehiclesPassenger Cars (78.4% share)Commercial Vehicles (15.4% CAGR)
By Propulsion TypePlug-In Hybrid Vehicles; Battery Electric Vehicles; Fuel Cell Electric VehiclesBattery Electric Vehicles (67.2% share)Plug-In Hybrid Vehicles (15.1% CAGR)
By Cooling MethodLiquid Cooled; Air CooledLiquid Cooled (13.9% CAGR)Liquid Cooled (13.9% CAGR)
By RegionNorth America; Europe; Asia-Pacific; South America; Middle East and AfricaAsia-Pacific (55.4% share)South America (15.6% CAGR)


Market Segmentation Overview

By Vehicle Type

Sub-SegmentKey Trend
Passenger CarsElectric SUVs drive converter ratings toward 3–4 kW
Commercial VehiclesVans, pickups and buses require high-power, heavy-duty designs.


Passenger Cars lead with a 78.4% share because electric SUVs and sedans make up most global EV output, and SUVs push converter ratings upward with heavy climate and driver-assistance loads. Commercial Vehicles grow fastest at a 15.4% CAGR, as heavy-duty CO2 rules force fleet electrification. Their compressors, refrigeration units and long duty cycles require converters with higher continuous ratings than any passenger platform.

By Propulsion Type

Sub-SegmentKey Trend
Plug-In Hybrid VehiclesChinese PHEV and range-extender volumes surge
Battery Electric Vehicles800 V platforms raise content per vehicle
Fuel Cell Electric VehiclesBoost plus step-down converters in hydrogen trucks and buses


Battery Electric Vehicles hold 67.2% of revenue because the converter is their only low-voltage power source, which demands higher ratings and redundancy than in hybrids. Plug-In Hybrid Vehicles grow fastest at a 15.1% CAGR, powered by Chinese buyers choosing PHEVs and range extenders to avoid charging constraints. Fuel Cell Electric Vehicles stay small but carry the highest converter content per vehicle.

By Cooling Method

Sub-SegmentKey Trend
Liquid CooledShared coolant loops in integrated power units
Air CooledRetained on compact, cost-sensitive platforms


Liquid-cooled converters both lead and grow fastest, at a 13.9% CAGR, because integrated power units share one coolant plate across the converter, inverter and onboard charger. Air-cooled units hold a 28.4% share in compact cars and lower-power PHEVs, where ratings stay below the thermal ceiling of forced-air designs and simpler packaging keeps costs down.




Download PDF ×

We do not share your information with anyone. However, we may send you emails based on your report interest from time to time. You may contact us at any time to opt-out.