DNA Sequencing Market (2026 - 2035)

ID: MRFR/LS/4319-HCR 90 Pages Vikita Thakur Last Updated: September 15, 2026
DNA Sequencing Market Research Report: Size, Share, Trend Analysis By Product (Consumable, Instrument, and Service), By Applications (Diagnostics, Biomarkers & Cancer, Reproductive Health, Personalized Medicine, and Forensics), By Technology (Semiconductor Sequencing, Sequencing by Ligation, and Pyrosequencing), By End-User (Academic & Government Research Institutes, Pharmaceutical Companies, Biotechnology Companies, and Hospitals & Clinics), And By Region (North America, Europe, Asia-Pacific, And Rest Of The World) - Growth Outlook & Industry Forecast 2025 To 2035
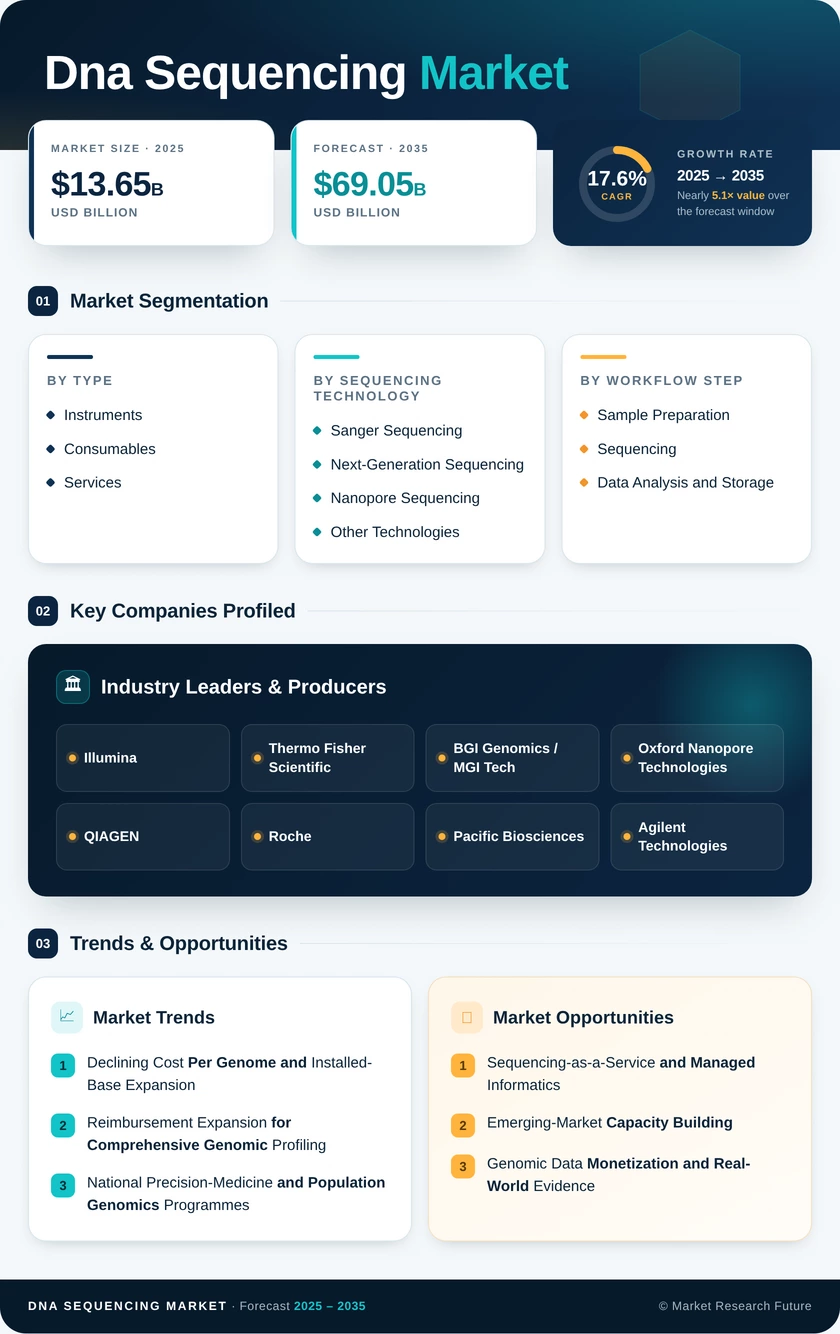
DNA Sequencing Market
Market Size
Forecast Period2026-2035
CAGR (2026-2035)17.6%
2025 Market SizeUSD 13.65 Billion
2035 Market SizeUSD 69.05 Billion
Key Players
Illumina
Thermo Fisher Scientific
BGI Genomics / MGI Tech
Oxford Nanopore Technologies
QIAGEN
Roche
Opportunities
  • Sequencing-as-a-Service and Managed Informatics
  • Emerging-Market Capacity Building
  • Genomic Data Monetization and Real-World Evidence
  1. 1 Market Summary | |
    1. 1.1 Study Assumptions & Market Definition | |
    2. 1.2 Scope of the Study | |
    3. 1.3 Research Methodology | |
  2. 2 Key Report Takeaways | |
    1. 2.1 By Product & Service | |
    2. 2.2 By Sequencing Technology | |
    3. 2.3 By Workflow Step | |
    4. 2.4 By Application | |
    5. 2.5 By End User | |
    6. 2.6 By Region | |
  3. 3 Market Size and Forecast (2021–2035) | |
    1. 3.1 Historical Market Size (2021–2024) | |
    2. 3.2 Base Year Assessment (2025) | |
    3. 3.3 Forecast Market Size (2026–2035) | |
    4. 3.4 Year-over-Year Growth Analysis | |
  4. 4 Driver Impact Analysis | |
    1. 4.1 Declining Cost Per Genome and Installed-Base Expansion | |
    2. 4.2 Reimbursement Expansion for Comprehensive Genomic Profiling | |
    3. 4.3 National Precision-Medicine and Population Genomics Programmes | |
    4. 4.4 Oncology Diagnostics and Residual-Disease Monitoring | |
    5. 4.5 Long-Read Platform Maturation | |
    6. 4.6 Cloud Bioinformatics and AI Variant Interpretation | |
    7. 4.7 Pathogen Genomics and Surveillance Mandates | |
  5. 5 Restraints Impact Analysis | |
    1. 5.1 Fragmented Genomic Data-Privacy and Sovereignty Rules | |
    2. 5.2 Reagent Supply Concentration and Export Controls | |
    3. 5.3 Reimbursement Gaps and Prior-Authorisation Friction | |
    4. 5.4 Bioinformatics Talent Shortage | |
    5. 5.5 Capital Intensity and Validation Burden for Mid-Tier Laboratories | |
  6. 6 Opportunities | |
    1. 6.1 Sequencing-as-a-Service and Managed Informatics | |
    2. 6.2 Emerging-Market Capacity Building | |
    3. 6.3 Genomic Data Monetisation and Real-World Evidence | |
    4. 6.4 Rapid and Point-of-Care Clinical Sequencing | |
    5. 6.5 Multi-Omics and Spatial Integration | |
  7. 7 Regional Market Share and Country-Level Analysis | |
    1. 7.1 North America | | |
      1. 7.1.1 US | | |
      2. 7.1.2 Canada | | |
      3. 7.1.3 Mexico | |
    2. 7.2 Europe | | |
      1. 7.2.1 Germany | | |
      2. 7.2.2 UK | | |
      3. 7.2.3 France | | |
      4. 7.2.4 Italy | | |
      5. 7.2.5 Spain | | |
      6. 7.2.6 Nordic Countries | | |
      7. 7.2.7 Russia | | |
      8. 7.2.8 Rest of Europe | |
    3. 7.3 Asia-Pacific | | |
      1. 7.3.1 China | | |
      2. 7.3.2 India | | |
      3. 7.3.3 Japan | | |
      4. 7.3.4 South Korea | | |
      5. 7.3.5 ASEAN | | |
      6. 7.3.6 Rest of Asia-Pacific | |
    4. 7.4 South America | | |
      1. 7.4.1 Brazil | | |
      2. 7.4.2 Argentina | | |
      3. 7.4.3 Rest of South America | |
    5. 7.5 Middle East & Africa | | |
      1. 7.5.1 Saudi Arabia | | |
      2. 7.5.2 UAE | | |
      3. 7.5.3 South Africa | | |
      4. 7.5.4 Egypt | | |
      5. 7.5.5 Rest of MEA | |
  8. 8 Future Outlook (2026–2035) | |
    1. 8.1 Autonomous Laboratory Operations and AI Interpretation | |
    2. 8.2 Platform Economics and Consumable Lock-In | |
    3. 8.3 Population-Scale Genomics as Standing Infrastructure | |
    4. 8.4 Data Governance, Sustainability, and Reporting Obligations | |
  9. 9 Segmentation Analysis | |
    1. 9.1 By Product & Service | | |
      1. 9.1.1 Instruments | | |
      2. 9.1.2 Consumables | | |
      3. 9.1.3 Services | |
    2. 9.2 By Sequencing Technology | | |
      1. 9.2.1 Sanger Sequencing | | |
      2. 9.2.2 Next-Generation Sequencing | | |
      3. 9.2.3 Nanopore Sequencing | | |
      4. 9.2.4 Other Technologies | |
    3. 9.3 By Workflow Step | | |
      1. 9.3.1 Sample Preparation | | |
      2. 9.3.2 Sequencing | | |
      3. 9.3.3 Data Analysis and Storage | |
    4. 9.4 By Application | | |
      1. 9.4.1 Clinical Diagnostics | | |
      2. 9.4.2 Research Applications | | |
      3. 9.4.3 Other Applications | |
    5. 9.5 By End User | | |
      1. 9.5.1 Hospitals & Clinical Laboratories | | |
      2. 9.5.2 Academic Institutions | | |
      3. 9.5.3 Pharmaceutical & Biotechnology Companies | | |
      4. 9.5.4 Other End Users | |
  10. 10 Competitive Landscape | |
    1. 10.1 Market Concentration Analysis (2026) | |
    2. 10.2 Competitive Benchmarking Matrix | |
    3. 10.3 Company Profiles | | |
      1. 10.3.1 Illumina | | |
      2. 10.3.2 Thermo Fisher Scientific | | |
      3. 10.3.3 BGI Genomics / MGI Tech | | |
      4. 10.3.4 Oxford Nanopore Technologies | | |
      5. 10.3.5 QIAGEN | | |
      6. 10.3.6 Roche | | |
      7. 10.3.7 Pacific Biosciences | | |
      8. 10.3.8 Agilent Technologies | | |
      9. 10.3.9 Eurofins Genomics | | |
      10. 10.3.10 Element Biosciences | | |
      11. 10.3.11 Ultima Genomics | |
  11. 11 Recent News & Developments | |
  12. 12 Report Scope and Methodology | |
    1. 12.1 Study Period & Base Year | |
    2. 12.2 Data Sources & Citations | |
    3. 12.3 Abbreviations | |
  13. 13 Detailed Sources and Citations | |
  14. 14 Frequently Asked Questions | | LIST OF TABLES | |
  15. TABLE 1 Global DNA Sequencing Market Size & Forecast, by Revenue (USD Billion), 2021–2035 | |
  16. TABLE 2 Global DNA Sequencing Market – Year-over-Year Growth Analysis, 2021–2035 | |
  17. TABLE 3 Driver Impact Analysis – Global DNA Sequencing Market, 2026–2035 | |
  18. TABLE 4 Restraint Impact Analysis – Global DNA Sequencing Market, 2026–2035 | |
  19. TABLE 5 Global DNA Sequencing Market Size, by Region, 2021–2035 (USD Billion) | |
  20. TABLE 6 North America DNA Sequencing Market Size, by Country, 2021–2035 (USD Billion) | |
  21. TABLE 7 Europe DNA Sequencing Market Size, by Country, 2021–2035 (USD Billion) | |
  22. TABLE 8 Asia-Pacific DNA Sequencing Market Size, by Country, 2021–2035 (USD Billion) | |
  23. TABLE 9 South America DNA Sequencing Market Size, by Country, 2021–2035 (USD Billion) | |
  24. TABLE 10 Middle East & Africa DNA Sequencing Market Size, by Country, 2021–2035 (USD Billion) | |
  25. TABLE 11 Global DNA Sequencing Market Size, by Product & Service, 2021–2035 (USD Billion) | |
  26. TABLE 12 Global DNA Sequencing Market Size, by Sequencing Technology, 2021–2035 (USD Billion) | |
  27. TABLE 13 Global DNA Sequencing Market Size, by Workflow Step, 2021–2035 (USD Billion) | |
  28. TABLE 14 Global DNA Sequencing Market Size, by Application, 2021–2035 (USD Billion) | |
  29. TABLE 15 Global DNA Sequencing Market Size, by End User, 2021–2035 (USD Billion) | |
  30. TABLE 16 Competitive Benchmarking Matrix – Global DNA Sequencing Market, 2026 | |
  31. TABLE 17 Company Profiles – Key Players, Global DNA Sequencing Market | |
  32. TABLE 18 Recent Developments & Strategic Announcements, 2023–2025 | |
  33. TABLE 19 Report Scope & Methodology Summary | |
  34. TABLE 20 Detailed Sources and Citations Index | |
  35. TABLE 21 North America DNA Sequencing Market Size, by Product & Service, 2021–2035 (USD Billion) | |
  36. TABLE 22 Europe DNA Sequencing Market Size, by Sequencing Technology, 2021–2035 (USD Billion) | |
  37. TABLE 23 Asia-Pacific DNA Sequencing Market Size, by Application, 2021–2035 (USD Billion) | |
  38. TABLE 24 South America DNA Sequencing Market Size, by End User, 2021–2035 (USD Billion) | |
  39. TABLE 25 Middle East & Africa DNA Sequencing Market Size, by Workflow Step, 2021–2035 (USD Billion) | | LIST OF FIGURES | |
  40. FIGURE 1 Global DNA Sequencing Market – Market Dynamics Overview | |
  41. FIGURE 2 Global DNA Sequencing Market – Industry Value Chain Analysis | |
  42. FIGURE 3 Global DNA Sequencing Market – Porter's Five Forces Analysis | |
  43. FIGURE 4 Global DNA Sequencing Market Size Trend, 2021–2035 (USD Billion) | |
  44. FIGURE 5 Year-over-Year Growth Trajectory, 2022–2035 (%) | |
  45. FIGURE 6 Market Share by Product & Service, 2025 vs 2035 (%) | |
  46. FIGURE 7 Market Share by Sequencing Technology, 2025 vs 2035 (%) | |
  47. FIGURE 8 Market Share by Workflow Step, 2025 (%) | |
  48. FIGURE 9 Market Share by Application, 2025 (%) | |
  49. FIGURE 10 Market Share by End User, 2025 (%) | |
  50. FIGURE 11 Regional Revenue Share Distribution, 2025 (%) | |
  51. FIGURE 12 Regional CAGR Comparison, 2026–2035 (%) | |
  52. FIGURE 13 North America Country-Level Share Breakdown, 2025 (%) | |
  53. FIGURE 14 Asia-Pacific Country-Level Share Breakdown, 2025 (%) | |
  54. FIGURE 15 Competitive Landscape – Estimated Revenue Share Positioning, 2026 | |
  55. FIGURE 16 Cost Per Genome Decline vs Test Volume Growth, 2021–2035

Segmentation Quick Reference

DimensionSub-SegmentsDominant SegmentFastest Growing Segment
By Product & ServiceInstruments; Consumables; ServicesConsumables (54.2% share, 2025)Services (16.8% CAGR)
By Sequencing TechnologySanger Sequencing; Next-Generation Sequencing; Nanopore Sequencing; Other TechnologiesNext-Generation Sequencing (76.1% share, 2025)Nanopore Sequencing (25.9% CAGR)
By Workflow StepSample Preparation; Sequencing; Data Analysis and StorageSequencing (42.2% share, 2025)Data Analysis and Storage (20.7% CAGR)
By ApplicationClinical Diagnostics; Research Applications; Other ApplicationsClinical Diagnostics (47.4% share, 2025)Oncology (17.8% CAGR)
By End UserHospitals & Clinical Laboratories; Academic Institutions; Pharmaceutical & Biotechnology Companies; Other End UsersAcademic Institutions (37.4% share, 2025)Hospitals & Clinical Laboratories (15.7% CAGR)


Market Segmentation Overview

By Product & Service

Sub-SegmentKey Trend
InstrumentsAggressive hardware discounting used to secure multi-year chemistry commitments
ConsumablesUnpatterned wafer and flowcell manufacturing lowering per-run cost
ServicesBundled cloud compute, compliance, and interpretation replacing raw-data delivery.


Consumables lead this dimension at 54.2% of 2025 revenue because proprietary flowcells and reagent kits must be reordered for every run, while Instruments increasingly function as a discounted entry point to that recurring stream. Services grow fastest at a 16.8% CAGR as hospitals and mid-tier laboratories outsource informatics and regulatory workloads rather than compete for scarce bioinformatics staff. The practical consequence for buyers is that reagent list price, not instrument capital cost, determines total cost of ownership over a five-year horizon.

By Sequencing Technology

Sub-SegmentKey Trend
Sanger SequencingRetained for orthogonal confirmation of reportable clinical variants
Next-Generation SequencingBroad accredited assay menus and payer familiarity sustain dominance.
Nanopore SequencingReal-time long reads with onboard compute entering clinical validation.
Other TechnologiesEmerging chemistries targeting incumbent consumable margin


Next-Generation Sequencing holds 76.1% of 2025 revenue because a decade of clinical accreditation, proficiency testing, and reimbursement precedent accumulated around short-read chemistry. Nanopore Sequencing expands fastest at a 25.9% CAGR by resolving structural variants, phasing, and native methylation that short reads cannot recover, which opens assay categories rather than merely competing on price. Sanger Sequencing does not disappear, since several regulators still expect orthogonal confirmation before a variant is clinically reported.

By Workflow Step

Sub-SegmentKey Trend
Sample PreparationLow-input multichannel library kits trimming hands-on time and reagent waste
SequencingRun volume growth partially offset by falling price per gigabase.
Data Analysis and StorageGraph mapping and AI classifiers shifting value to interpreted reports


Sequencing remains the largest workflow layer at 42.2% of 2025 revenue. Yet, Data Analysis and Storage grows fastest at a 20.7% CAGR because payers reimburse an actionable clinical report rather than a raw sequence file. Sample Preparation gains from automation, though shrinking hands-on time caps its revenue expansion relative to informatics. Multi-omics file sizes push storage demand upward independently of how many runs a laboratory performs.

By Application

Sub-SegmentKey Trend
Clinical DiagnosticsOncology profiling, rare disease, and reproductive health driving reimbursed volume
Research ApplicationsGrant-funded discovery growing at a fraction of the clinical rate.
Other ApplicationsForensics, agrigenomics, and wellness adding incremental non-clinical volume.


Clinical Diagnostics overtook Research Applications for the first time in 2025 at 47.4% of revenue, with Oncology the dominant sub-application and the fastest-growing at a 17.8% CAGR as comprehensive genomic profiling secured payer endorsement. Research Applications retain substantial absolute volume but grow more slowly, since public grant budgets expand well below the rate of reimbursed testing. Molecular residual-disease monitoring is the structural change to watch, converting single diagnostic events into recurring surveillance.

By End User

Sub-SegmentKey Trend
Hospitals & Clinical LaboratoriesTurnkey closed workflows shortening accreditation timelines
Academic InstitutionsGrant funding piloting single-cell and spatial-omics methods
Pharmaceutical & Biotechnology CompaniesPatient stratification and companion-diagnostic co-development
Other End UsersForensic genetics and consumer wellness raising governance requirements


Academic Institutions still hold the largest share at 37.4% of 2025 revenue, using grant funds to prove methods that later migrate into routine care. Hospitals & Clinical Laboratories grow fastest at a 15.7% CAGR because vendors now ship validated, closed workflows that compress accreditation from months to weeks, removing the main barrier for facilities without dedicated genomics teams. Pharmaceutical & Biotechnology Companies supply steady contract volume tied to trial recruitment and companion-diagnostic programmes.




Download PDF ×

We do not share your information with anyone. However, we may send you emails based on your report interest from time to time. You may contact us at any time to opt-out.