Segmentation Quick Reference
| Dimension | Sub-Segments | Dominant Segment | Fastest Growing Segment |
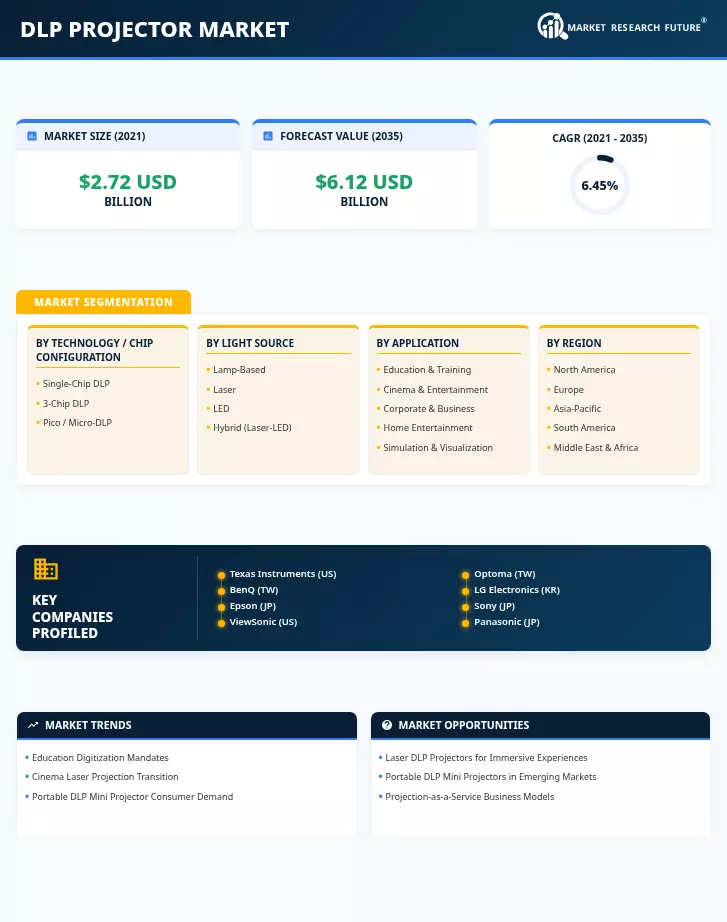
| Technology / Chip Configuration | Single-Chip DLP, 3-Chip DLP, Pico / Micro-DLP | Single-Chip DLP (~52% share) | Pico / Micro-DLP (11.3% CAGR) |
| Light Source | Lamp-Based, Laser, LED, Hybrid (Laser-LED) | Lamp-Based (declining legacy base) | Laser (9.1% CAGR) |
| Application | Education & Training, Cinema & Entertainment, Corporate & Business, Home Entertainment, Simulation & Visualization | Education & Training (~38% of units) | Simulation & Visualization (7.6% CAGR) |
| Region | North America, Europe, Asia-Pacific, South America, Middle East & Africa | North America (~34% share) | Asia-Pacific (8.2% CAGR) |
Market Segmentation Overview
By Technology / Chip Configuration
| Sub-Segment | Key Trend |
| Single-Chip DLP | Cost-driven volume leader in education and corporate; native 4K now available below USD 1,200 |
| 3-Chip DLP | Premium cinema and large-venue installations; laser-phosphor migration ongoing |
| Pico / Micro-DLP | Consumer portability and AR/wearable integration driving fastest growth |
Single-chip DLP dominates unit shipments due to its alignment with budget-conscious education and SME procurement. The 3-chip segment commands disproportionate revenue share through high ASP cinema and simulation systems. Pico/Micro-DLP is an emerging category with long-term expansion potential into wearable and automotive applications.
By Light Source
| Sub-Segment | Key Trend |
| Lamp-Based | Declining segment; mercury regulations and high TCO accelerate phase-out |
| Laser (Including Laser-Phosphor) | Fastest-growing; cinema, large venue, and premium corporate adoption |
| LED | Powers the portable DLP mini projector segment; sub-2 kg consumer devices |
| Hybrid (Laser-LED) | Emerging mid-range category balancing efficiency and brightness |
The lamp-to-laser transition is the defining structural shift within the DLP projector market's light-source segmentation. LED remains entrenched in portable consumer products, while hybrid engines represent the next efficiency frontier for commercial mid-range systems.
By Application
| Sub-Segment | Key Trend |
| Education & Training | Largest by volume; driven by global smart-classroom mandates |
| Cinema & Entertainment | Highest ASP segment; laser transition and immersive experiences |
| Corporate & Business | Hybrid-work AV refresh; ultra-short-throw and wireless integration |
| Home Entertainment | Consumer portable demand; streaming ecosystem integration |
| Simulation & Visualization | Defense, flight simulation, engineering design — high-growth niche |
Education and cinema together account for over 60% of the DLP projector market by value. Corporate and home entertainment segments are growing in parallel as hybrid work and consumer streaming habits create new projection use cases. Simulation remains a specialized but high-value niche driven by defense and industrial R&D budgets.