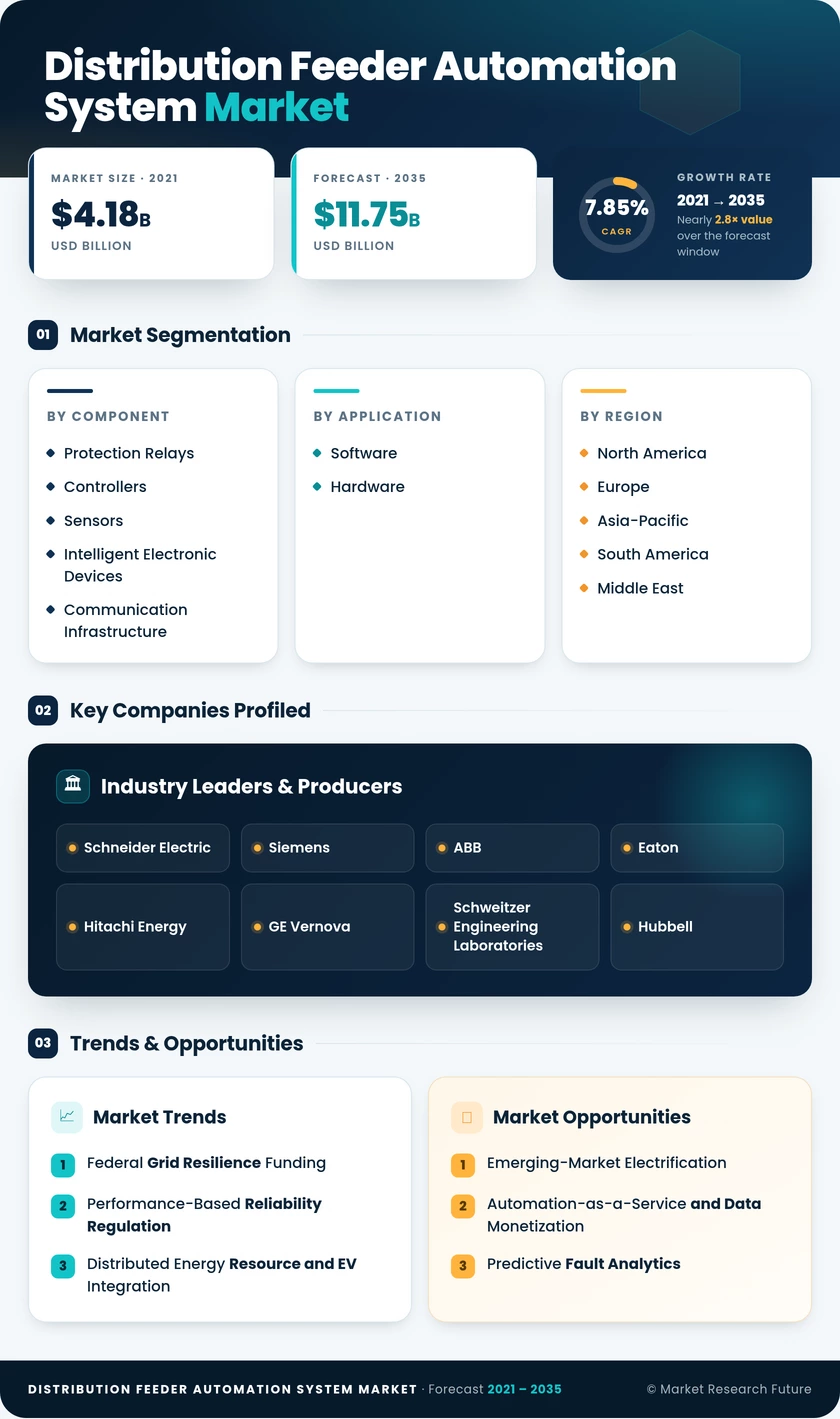
Distribution Feeder Automation System Market (2026 - 2035)

ID: MRFR/EnP/7258-HCR 188 Pages Priya Nagrale Last Updated: October 23, 2026
Distribution Feeder Automation System Market Research Report By Component (Protection Relays and Controllers, Sensors and Intelligent Electronic Devices, Communication Infrastructure, SCADA/HMI Platforms), By Application (Software, Hardware) and Region (North America, Europe, Asia-Pacific, Middle East & Africa and South America) - Forecast till 2035
Distribution Feeder Automation System Market
Market Size
Forecast Period2026-2035
CAGR (2026-2035)7.85%
2025 Market SizeUSD 5.54 Billion
2035 Market SizeUSD 11.75 Billion
Key Players
Schneider Electric
Siemens
ABB
Eaton
Hitachi Energy
GE Vernova
Opportunities
  • Emerging-Market Electrification
  • Automation-as-a-Service and Data Monetization
  • Predictive Fault Analytics
  1. 1 Market Summary | |
  2. 2 Key Report Takeaways | |
    1. 2.1 By Component | |
    2. 2.2 By Application | |
    3. 2.3 By Region | |
  3. 3 Market Size and Forecast (2021–2035) | |
    1. 3.1 Historical Market Size (2021–2024) | |
    2. 3.2 Base Year and Forecast Market Size (2025–2035) | |
    3. 3.3 Year-over-Year Growth Analysis | |
  4. 4 Driver Impact Analysis | |
    1. 4.1 Federal Grid Resilience Funding | |
    2. 4.2 Performance-Based Reliability Regulation | |
    3. 4.3 Distributed Energy Resource and EV Integration | |
    4. 4.4 Asia-Pacific Distribution Modernization Programs | |
    5. 4.5 Extreme Weather and Resilience Mandates | |
    6. 4.6 Declining Sensor and Communication Costs | |
  5. 5 Restraints Impact Analysis | |
    1. 5.1 High Upfront Capital and Long Payback | |
    2. 5.2 Cybersecurity Exposure | |
    3. 5.3 Legacy System Interoperability | |
    4. 5.4 Equipment Supply Chain Constraints | |
    5. 5.5 Skilled Workforce Shortage | |
  6. 6 Opportunities | |
    1. 6.1 Emerging-Market Electrification | |
    2. 6.2 Automation-as-a-Service and Data Monetization | |
    3. 6.3 Predictive Fault Analytics | |
    4. 6.4 Wildfire and Storm Resilience Retrofits | |
    5. 6.5 Private Wireless Networks for Feeder Communications | |
  7. 7 Regional Market Share and Country-Level Analysis | |
    1. 7.1 North America | | |
      1. 7.1.1 United States | | |
      2. 7.1.2 Canada | | |
      3. 7.1.3 Mexico | |
    2. 7.2 Europe | | |
      1. 7.2.1 Germany | | |
      2. 7.2.2 United Kingdom | | |
      3. 7.2.3 France | | |
      4. 7.2.4 Italy | | |
      5. 7.2.5 NORDIC Countries | | |
      6. 7.2.6 Russia | | |
      7. 7.2.7 Rest of Europe | |
    3. 7.3 Asia-Pacific | | |
      1. 7.3.1 China | | |
      2. 7.3.2 India | | |
      3. 7.3.3 Japan | | |
      4. 7.3.4 South Korea | | |
      5. 7.3.5 ASEAN Countries | | |
      6. 7.3.6 Rest of Asia-Pacific | |
    4. 7.4 South America | | |
      1. 7.4.1 Brazil | | |
      2. 7.4.2 Argentina | | |
      3. 7.4.3 Rest of South America | |
    5. 7.5 Middle East and Africa | | |
      1. 7.5.1 Saudi Arabia | | |
      2. 7.5.2 United Arab Emirates | | |
      3. 7.5.3 South Africa | | |
      4. 7.5.4 Egypt | | |
      5. 7.5.5 Rest of Middle East and Africa | |
  8. 8 Future Outlook (2026–2035) | |
    1. 8.1 AI and Self-Healing Feeders | |
    2. 8.2 Platform Economics | |
    3. 8.3 Electrification Supercycle | |
    4. 8.4 Climate Resilience and ESG Reporting | |
  9. 9 Segmentation Analysis | |
    1. 9.1 By Component | | |
      1. 9.1.1 Protection Relays and Controllers | | |
      2. 9.1.2 Sensors and Intelligent Electronic Devices | | |
      3. 9.1.3 Communication Infrastructure | | |
      4. 9.1.4 SCADA/HMI Platforms | |
    2. 9.2 By Application | | |
      1. 9.2.1 Software | | |
      2. 9.2.2 Hardware | |
  10. 10 Competitive Landscape | |
    1. 10.1 Market Concentration Analysis | |
    2. 10.2 Competitive Benchmarking Matrix | |
    3. 10.3 Company Profiles | | |
      1. 10.3.1 Schneider Electric | | |
      2. 10.3.2 Siemens | | |
      3. 10.3.3 ABB | | |
      4. 10.3.4 Eaton | | |
      5. 10.3.5 Hitachi Energy | | |
      6. 10.3.6 GE Vernova | | |
      7. 10.3.7 Schweitzer Engineering Laboratories | | |
      8. 10.3.8 S&C Electric Company | | |
      9. 10.3.9 Hubbell | | |
      10. 10.3.10 Mitsubishi Electric | | |
      11. 10.3.11 Honeywell | |
  11. 11 Recent News & Developments | |
  12. 12 Report Scope and Methodology | |
  13. 13 Detailed Sources and Citations | |
  14. 14 Frequently Asked Questions (FAQs) | | LIST OF TABLES | |
  15. TABLE 1 Global Market Size and Forecast, by Revenue (USD Billion), 2021–2035 | |
  16. TABLE 2 Year-over-Year Growth Analysis, 2021–2035 | |
  17. TABLE 3 Driver Impact Analysis | |
  18. TABLE 4 Restraints Impact Analysis | |
  19. TABLE 5 Regional Summary, 2025 | |
  20. TABLE 6 North America Market, by Country, 2025 | |
  21. TABLE 7 Europe Market, by Country, 2025 | |
  22. TABLE 8 Asia-Pacific Market, by Country, 2025 | |
  23. TABLE 9 South America Market, by Country, 2025 | |
  24. TABLE 10 Middle East and Africa Market, by Country, 2025 | |
  25. TABLE 11 Global Market, by Component, 2025 | |
  26. TABLE 12 Global Market, by Application, 2025 | |
  27. TABLE 13 Competitive Benchmarking Matrix | |
  28. TABLE 14 Report Scope and Methodology | |
  29. TABLE 15 Detailed Sources and Citations | | LIST OF FIGURES | |
  30. FIGURE 1 Market Dynamics Overview | |
  31. FIGURE 2 Industry Value Chain Analysis | |
  32. FIGURE 3 Porter's Five Forces Analysis | |
  33. FIGURE 4 Global Market Size Trend, 2021–2035 (USD Billion) | |
  34. FIGURE 5 Market Share by Component, 2025 | |
  35. FIGURE 6 Market Share by Application, 2025 | |
  36. FIGURE 7 Regional Market Share, 2025 | |
  37. FIGURE 8 Regional Growth Comparison, 2026–2035 | |
  38. FIGURE 9 North America Country Share, 2025 | |
  39. FIGURE 10 Asia-Pacific Country Share, 2025 | |
  40. FIGURE 11 Competitive Landscape Positioning Map | |
  41. FIGURE 12 Estimated Revenue Share of Key Players

Segmentation Quick Reference

DimensionSub-SegmentsDominant SegmentFastest Growing Segment
By ComponentProtection Relays and Controllers; Sensors and Intelligent Electronic Devices; Communication Infrastructure; SCADA/HMI PlatformsProtection Relays and Controllers — 38.9% shareCommunication Infrastructure — 9.8% CAGR (2026–2035)
By ApplicationSoftware; HardwareHardware — 62.2% shareSoftware — 10.3% CAGR (2026–2035)
By RegionNorth America; Europe; Asia-Pacific; South America; Middle East and AfricaNorth America — 37.6% shareAsia-Pacific — 9.6% CAGR (2026–2035)

Market Segmentation Overview

By Component

Sub-SegmentKey Trend
Protection Relays and ControllersAdaptive settings for two-way power flows
Sensors and Intelligent Electronic DevicesLow-cost line monitors with edge processing
Communication InfrastructureShift to private LTE and mesh radio
SCADA/HMI PlatformsIntegration with distribution management software

Protection Relays and Controllers lead the component mix because every automated switching point requires protection, and coordination standards keep that spend non-discretionary. Communication Infrastructure grows fastest as peer-to-peer restoration demands low-latency, deterministic links that legacy polling radios cannot provide. Sensors and Intelligent Electronic Devices expand as falling unit prices allow utilities to instrument whole feeders.

By Application

Sub-SegmentKey Trend
SoftwareSubscription analytics and automated restoration logic
HardwareReclosers and regulators with embedded intelligence

Hardware dominates because reclosers, sectionalizers and voltage regulators remain the physical foundation of any automated feeder. Software grows fastest as utilities seek analytics, DER coordination and restoration logic that raise the value of installed devices. Regulatory acceptance of operating-cost recovery for software accelerates this shift without displacing hardware demand.


Download PDF ×

We do not share your information with anyone. However, we may send you emails based on your report interest from time to time. You may contact us at any time to opt-out.