Segmentation Quick Reference
| Dimension | Sub-Segments | Dominant Segment | Fastest Growing Segment |
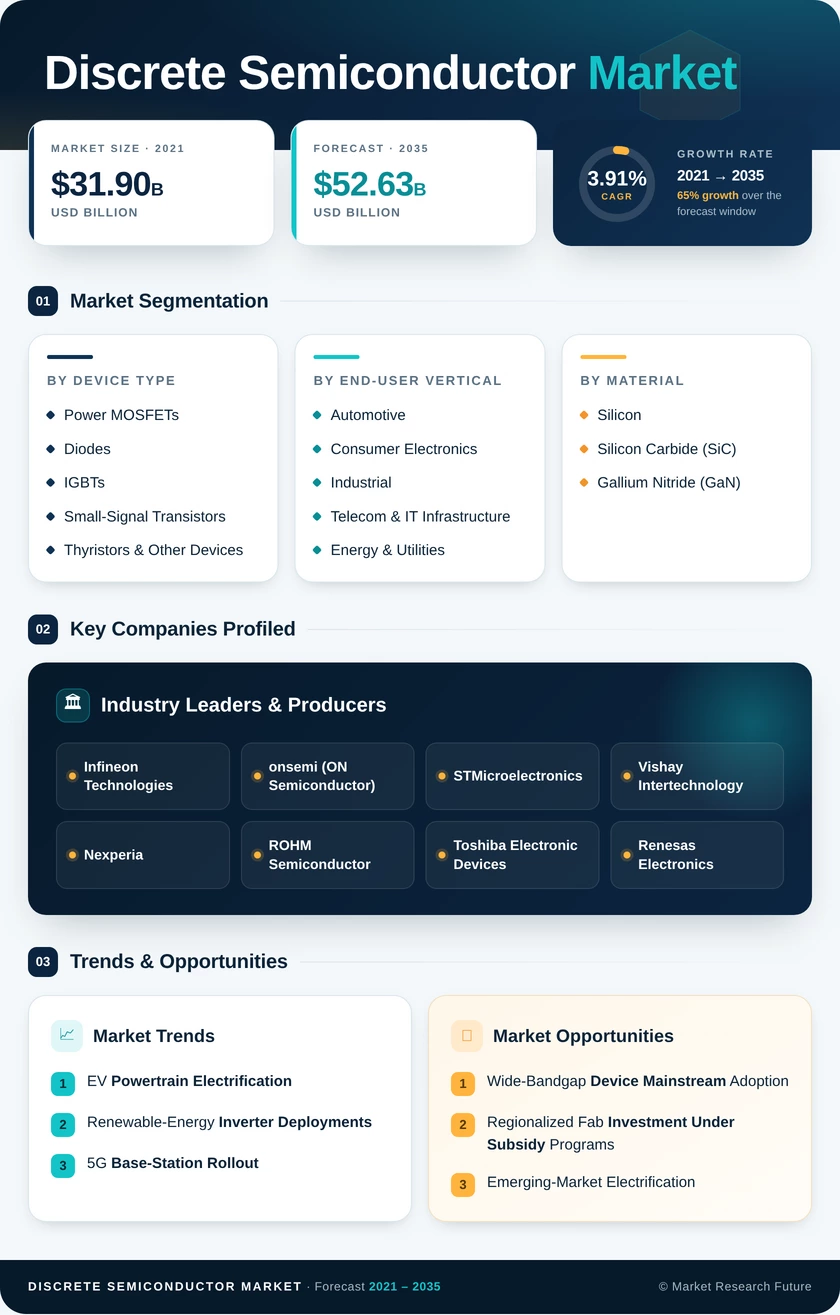
| Device Type | Power MOSFETs; Diodes; IGBTs; Small-Signal Transistors; Thyristors & Other Devices | Power MOSFETs | Power MOSFETs |
| End-User Vertical | Automotive; Consumer Electronics; Industrial; Telecom & IT Infrastructure; Energy & Utilities; Aerospace & Defense | Automotive | Energy & Utilities |
| Material | Silicon; Silicon Carbide (SiC); Gallium Nitride (GaN) | Silicon | Silicon Carbide (SiC) |
| Power Rating | Low-Power (< 20 V); Mid-Power (20–600 V); High-Power (> 600 V) | Mid-Power (20–600 V) | High-Power (> 600 V) |
Market Segmentation Overview
By Device Type
| Sub-Segment | Key Trend |
| Power MOSFETs | Transition to trench-gate and shielded-gate architectures for lower RDS(on) |
| Diodes (Rectifier, Schottky, Zener) | SiC Schottky diodes replacing Si PiN diodes in solar and EV applications |
| IGBTs | 7th-generation chipsets with fine-pattern trench technology, reducing losses |
| Small-Signal Transistors | Miniaturization for IoT and wearable edge-device integration |
| Thyristors & Other Devices | Continued role in legacy grid and high-voltage DC transmission systems |
Power MOSFETs constitute the largest device-type segment, serving voltage and current management functions across virtually every electronic system. The migration toward wide-bandgap variants is expanding the addressable application space beyond traditional silicon boundaries.
By End-User Vertical
| Sub-Segment | Key Trend |
| Automotive | 800 V architectures driving SiC MOSFET adoption in traction inverters |
| Consumer Electronics | GaN fast chargers and USB-C Power Delivery proliferating globally |
| Industrial | Variable-frequency drives and servo systems upgrading to higher-efficiency discretes |
| Telecom & IT Infrastructure | 48 V rack power and 5G massive-MIMO front-ends increasing device counts |
| Energy & Utilities | Grid-scale battery inverters scaling with storage capacity additions |
| Aerospace & Defense | Radiation-hardened discretes for space and avionics power systems |
Automotive electrification remains the single most influential vertical for the Discrete Semiconductor Market, with each BEV platform integrating significantly more discrete content than its internal-combustion predecessor.
By Material
| Sub-Segment | Key Trend |
| Silicon | Mature cost structure; ongoing innovation in packaging extends relevance |
| Silicon Carbide (SiC) | 200 mm wafer transition accelerates cost reduction trajectory |
| Gallium Nitride (GaN) | Expansion beyond consumer fast chargers into telecom and automotive domains |
Silicon still dominates by revenue share, but the material mix is shifting as SiC captures high-voltage sockets and GaN wins in high-frequency, lower-voltage applications. The pace of substitution hinges on wafer-cost trajectories and device qualification timelines.
By Power Rating
| Sub-Segment | Key Trend |
| Low-Power (< 20 V) | Driven by mobile, wearable, and IoT applications with compact form factors |
| Mid-Power (20–600 V) | Broad-based demand across consumer, telecom, and general industrial applications |
| High-Power (> 600 V) | Fastest-growing bracket, propelled by EV traction, rail, and grid storage |
Mid-power devices lead by market share, reflecting the breadth of applications in the 20–600 V range. High-power devices above 600 V are growing fastest, benefiting from the structural shift toward electrified transportation and utility-scale energy conversion.