Request Free Sample ×

Kindly complete the form below to receive a free sample of this Report

* Please use a valid business email

Leading companies partner with us for data-driven Insights

clients tt-cursor
Hero Background
English
Chinese
French
Japanese
Korean
German
Spanish

Disaster Recovery Service Market Size

ID: MRFR/ICT/2339-HCR
100 Pages
Apoorva Priyadarshi
March 2026

Disaster recovery as a service Market Size, Share and Research Report: By Service Type (Training & Consulting, Support & Maintenance, Backup, Data Security, Professional Services, Real-Time Replication, and System Integration), By Verticals v(BFSI, IT, Government, Healthcare, and Others), By Deployment (Private, Public, Hybrid) and By Region (Asia-Pacific, North America, Europe, and Rest of the World) - Forecast till 2035

Share:
Download PDF ×

We do not share your information with anyone. However, we may send you emails based on your report interest from time to time. You may contact us at any time to opt-out.

Disaster Recovery Service Market Infographic
Purchase Options

Disaster Recovery Service Size

Market Size Snapshot
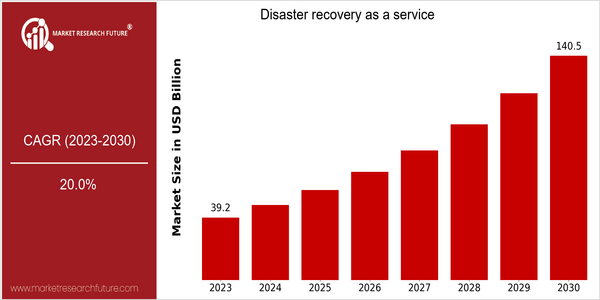
Year Value
2023 USD 39.2 Billion
2030 USD 140.5 Billion
CAGR (2023-2030) 20.0 %

Note – Market size depicts the revenue generated over the financial year

Disaster Recovery as a Service (DRaaS) is a market that is expected to grow substantially in the near future, with a forecasted market size of $39 billion by 2023, which is expected to grow to $140 billion by 2030. This represents a high CAGR of 20.4 per cent during the forecast period. This growth is being driven by the increasing dependence on digital systems and the rising number of cyber-attacks and natural disasters. Also, the growing need for organizations to ensure business continuity and reduce downtime is driving the demand for DRaaS. Also, the rise in the use of cloud, automation and artificial intelligence is expected to play a key role in shaping the DRaaS market. These innovations help organizations to adopt cost-effective and efficient DR strategies, thereby enhancing their resilience to disruptions. DRaaS market leaders such as IBM, Microsoft and VMware are investing in product innovation and partnership strategies to strengthen their service offerings. For example, cloud service providers have been collaborating with cyber security companies to enhance the security and reliability of DRaaS solutions. These solutions will enable organizations to protect their critical data and applications in an increasingly volatile environment.

home-ubuntu-www-mrf_ne_design-batch-6-cp-disaster-recovery-as-a-service-market size

Regional Market Size

Regional Deep Dive

The market for DRaaS is growing at a fast rate in many regions, driven by the growing importance of security, compliance and the need for business continuity. Each region has its own characteristics, influenced by the economic situation, the technological environment and the cultural attitude towards risk management. DRaaS is a natural consequence of the growing reliance of organizations on cloud-based solutions. The need for a disaster recovery solution that can reduce the impact of a disaster on the business is expected to grow.

Europe

  • The European General Data Protection Regulation has had a considerable influence on the DRaaS market. It requires companies to ensure that their data is protected and can be recovered. Consequently, companies like Acronis and Zerto are developing products that are specifically designed to meet these strict regulatory requirements.
  • DRaaS in Europe is a major trend, and is gaining momentum as businesses seek to ensure the continuity of operations in a distributed environment. This will inevitably lead to closer collaboration between service providers and enterprises.

Asia Pacific

  • The digital transformation in Asia-Pacific is in full swing. India and China, for example, are investing heavily in cloud computing. This has led to a booming DRaaS market in which local competitors such as NTT Communications and Alibaba Cloud have emerged as key players.
  • Business is becoming more and more aware of the importance of disaster recovery planning. In particular, small and medium-sized enterprises (SMEs) are becoming aware of the need for disaster recovery as a service (DRaaS).

Latin America

  • Latin America is undergoing a gradual shift to cloud computing, with a corresponding growth in DRaaS, as businesses seek to protect their data and ensure continuity of operations. Local companies like Totvs and UOL Diveo are leading the way in providing DRaaS.
  • The economic situation is influenced by the instability of political conditions and the exchange rate. Disaster recovery has become a higher priority for companies that wish to protect their business against unforeseen disruptions.

North America

  • North America has been seeing a significant increase in demand for DRaaS, particularly as a result of the increased frequency of natural disasters and cyberattacks. IT companies like IBM and Microsoft are now developing solutions that combine machine learning and artificial intelligence to make DRaaS even more effective.
  • Regulations such as the Californian Personal Data and Information Protection Act (CCPA) are pushing organizations to adopt more comprehensive disaster recovery plans, which is in turn driving a greater use of DRaaS. The resulting cloud spending will be largely driven by this trend.

Middle East And Africa

  • IT investment and a greater awareness of the threat of cyber attacks are the two main factors influencing the DRaaS market in the Middle East and Africa. Oracle and IBM are increasing their presence in the region and are offering a range of DRaaS services tailored to local needs.
  • In the public and private sectors, the implementation of the UAE National Cyber Security Strategy has prompted a surge in the use of disaster recovery as a service. This increased focus on resilience is expected to drive market growth in the years to come.

Did You Know?

“Did you know that nearly 60% of small businesses that experience a data breach go out of business within six months? This statistic underscores the critical importance of disaster recovery planning and the growing demand for DRaaS solutions.” — National Cyber Security Alliance

Segmental Market Size

Disaster Recovery as a Service (DRaaS) is a critical part of the cloud computing market, which is experiencing rapid growth as a result of the increasing reliance on digital infrastructure. The threat of natural disasters and cyber-attacks is driving demand for DRaaS. Regulations such as the General Data Protection Regulation and the Health Insurance Portability and Accountability Act (HIPAA) require companies to have a robust disaster recovery plan in place, which is further driving DRaaS adoption. As the market moves towards full-scale deployment, the likes of IBM, Microsoft and VMware are delivering a wide range of DRaaS solutions to businesses across all industry verticals. Amongst the most active are healthcare and financial services, with a particular focus on the protection of critical patient data and financial transactions. Similarly, the COVID 19 pandemic has accelerated the trend towards remote working, further highlighting the importance of disaster recovery plans. Moreover, advances in cloud technology, such as serverless computing and the use of machine learning to automate recovery processes, are transforming the DRaaS market.

Future Outlook

The Disaster Recovery as a Service (DRaaS) market is expected to grow rapidly from 2023 to 2030, with an estimated market value of $39.2 billion and a CAGR of 20.0%. The main driving force for this growth is the increasing reliance on cloud-based solutions, as organizations seek to enhance their resilience to data loss and business interruptions. The report estimates that by 2030, over 60% of enterprises will have adopted DRaaS, up from about 30% in 2023. This demonstrates a significant shift towards a more pro-active approach to disaster recovery, in the face of the growing threat of cyber-attacks and natural disasters. During this time, a number of technological developments are expected to enhance the performance of DRaaS offerings. These developments include the integration of artificial intelligence and machine learning into DRaaS offerings. In addition, increasing regulatory pressures and the need for compliance with new standards are expected to spur demand for more comprehensive DRaaS offerings. Also, the increasing adoption of hybrid cloud and the growing importance of data sovereignty will shape the competitive landscape, encouraging a greater focus on innovation and differentiation. As business continuity continues to be a priority for organizations, the DRaaS market will continue to evolve as a key component of enterprise risk management strategies.

Disaster Recovery Service Market Size Graph
Author
Author Profile
Apoorva Priyadarshi
Research Analyst

With 4+ years of experience in Market Intelligence and Strategic Research, Apoorv specializes in ICT, Semiconductor, and BFSI markets. Combining strong analytical capabilities with a deep understanding of technology-driven industries, he focuses on delivering data-driven insights that support strategic decision-making. With a background in technology and business research, Apoorv has contributed to numerous global market studies, competitive landscape analyses, and opportunity assessments across sectors such as semiconductors, digital banking, cybersecurity, and telecommunications.

Leave a Comment

FAQs

What is the current valuation of the Disaster Recovery as a Service Market?

<p>The market valuation was 47.04 USD Billion in 2024.</p>

What is the projected market size for the Disaster Recovery as a Service Market by 2035?

<p>The projected valuation for 2035 is 349.51 USD Billion.</p>

What is the expected CAGR for the Disaster Recovery as a Service Market from 2025 to 2035?

<p>The expected CAGR during the forecast period 2025 - 2035 is 20.0%.</p>

Which companies are considered key players in the Disaster Recovery as a Service Market?

<p>Key players include IBM, Microsoft, Amazon Web Services, Dell Technologies, VMware, Acronis, Zerto, Carbonite, and Sungard Availability Services.</p>

What segment had the highest valuation in the Disaster Recovery as a Service Market in 2024?

<p>The Backup segment had the highest valuation at 10.0 USD Billion.</p>

How does the Public Cloud segment compare to the Private Cloud segment in terms of market size?

<p>In 2024, the Public Cloud segment was valued at 18.82 USD Billion, while the Private Cloud segment was valued at 14.26 USD Billion.</p>

What is the valuation of the Healthcare vertical in the Disaster Recovery as a Service Market?

<p>The Healthcare vertical was valued at 7.05 USD Billion in 2024.</p>

Which service type segment is projected to grow the most in the Disaster Recovery as a Service Market?

<p>The Support & Maintenance segment is projected to grow significantly, with a valuation of 4.7 USD Billion in 2024.</p>

What is the valuation of the BFSI vertical in the Disaster Recovery as a Service Market?

<p>The BFSI vertical was valued at 8.41 USD Billion in 2024.</p>

What is the projected growth trend for the Hybrid Cloud segment in the Disaster Recovery as a Service Market?

<p>The Hybrid Cloud segment was valued at 14.96 USD Billion in 2024 and is expected to continue growing through 2035.</p>

Market Summary

As per Market Research Future analysis, the Disaster Recovery as a Service Market Size was estimated at 47.04 USD Billion in 2024. The Disaster Recovery as a Service industry is projected to grow from 56.45 USD Billion in 2025 to 349.51 USD Billion by 2035, exhibiting a compound annual growth rate (CAGR) of 20.0% during the forecast period 2025 - 2035

Key Market Trends & Highlights

The Disaster Recovery as a Service Market is experiencing robust growth driven by technological advancements and increasing demand for data protection.

  • North America remains the largest market for Disaster Recovery as a Service, reflecting a strong emphasis on data security and compliance. The Asia-Pacific region is emerging as the fastest-growing market, fueled by rapid cloud adoption and digital transformation initiatives. The Backup segment continues to dominate the market, while the Data Security segment is witnessing the fastest growth due to rising cybersecurity threats. Key market drivers include rising data volumes and regulatory compliance requirements, which are compelling organizations to invest in disaster recovery solutions.

Market Size & Forecast

2024 Market Size 47.04 (USD Billion)
2035 Market Size 349.51 (USD Billion)
CAGR (2025 - 2035) 20.0%
Largest Regional Market Share in 2024 North America

Major Players

IBM (US),<a href="https://www.microsoft.com/en-inhttps://www.microsoft.com/en-in"> M</a><a href="https://www.microsoft.com/en-inhttps://www.microsoft.com/en-inhttps://www.microsoft.com/en-in">icrosoft</a> (US), Amazon Web Services (US), Dell Technologies (US), VMware (US), Acronis (CH), Zerto (IL), <a href="https://www.carbonite.com/">Carbonite </a>(US), Sungard Availability Services (US)

Market Trends

The Disaster Recovery as a Service Market is currently experiencing a notable evolution, driven by the increasing reliance on digital infrastructure across various sectors. Organizations are recognizing the necessity of robust recovery solutions to mitigate potential disruptions caused by unforeseen events. This market appears to be expanding as businesses seek to enhance their resilience and ensure continuity in operations. The integration of advanced technologies, such as artificial intelligence and machine learning, is likely to play a pivotal role in shaping the future landscape of disaster recovery services. Furthermore, the growing awareness of data security and compliance requirements is propelling organizations to adopt comprehensive disaster recovery strategies, thereby fostering market growth. In addition, the Disaster Recovery as a Service Market seems to be influenced by the rising trend of remote work and cloud adoption. As more companies transition to cloud-based environments, the demand for effective recovery solutions that can seamlessly integrate with these platforms is increasing. This shift indicates a potential for innovation within the sector, as service providers strive to offer tailored solutions that meet the unique needs of diverse industries.

Overall, the market is poised for continued growth, driven by technological advancements and an evolving understanding of risk management in the digital age. The global disaster recovery as a service market is expanding rapidly as organizations adopt advanced cloud disaster recovery services and scalable disaster recovery solutions to ensure business continuity and minimize downtime. The shift toward hybrid infrastructure is accelerating demand for cloud disaster recovery solutions and IT disaster recovery solutions that provide scalable, automated recovery capabilities. Organizations are increasingly deploying disaster recovery software and backup and disaster recovery services to strengthen data resilience and enable faster recovery during system failures. Enterprises are partnering with specialized disaster recovery companies and managed disaster recovery service providers to implement secure hybrid recovery frameworks. High-risk industries rely heavily on data backup and disaster recovery services to maintain compliance and operational continuity.

Increased Cloud Adoption

The trend of cloud adoption is significantly impacting the Disaster Recovery as a Service Market. As organizations migrate their operations to cloud environments, the need for effective recovery solutions that align with these platforms is becoming more pronounced. This shift suggests a growing demand for services that can ensure data integrity and availability in the event of disruptions.

Focus on Compliance and Security

There is a heightened emphasis on compliance and security within the Disaster Recovery as a Service Market. Organizations are increasingly aware of the regulatory requirements surrounding data protection and are seeking solutions that not only facilitate recovery but also ensure adherence to these standards. This trend indicates a potential for service providers to enhance their offerings to meet these critical needs.

Integration of Advanced Technologies

The integration of advanced technologies, such as artificial intelligence and machine learning, is emerging as a key trend in the Disaster Recovery as a Service Market. These technologies have the potential to optimize recovery processes, enhance decision-making, and improve overall efficiency. As organizations look for innovative solutions, this trend may drive significant advancements in service delivery.

Disaster Recovery Service Market Market Drivers

Rising Data Volumes

The exponential growth of data generated by organizations is a primary driver for the Disaster Recovery as a Service Market. As businesses increasingly rely on data for decision-making, the need for robust disaster recovery solutions becomes paramount. According to recent estimates, data generation is expected to reach 175 zettabytes by 2025. This surge necessitates scalable and efficient disaster recovery solutions to ensure data integrity and availability. Organizations are recognizing that traditional recovery methods may not suffice, leading to a shift towards cloud-based disaster recovery services. The Disaster Recovery as a Service Market is thus witnessing heightened demand as companies seek to protect their critical data assets against potential disruptions.

Shift Towards Remote Work

The transition to remote work has fundamentally altered the operational landscape for many organizations, driving demand for the Disaster Recovery as a Service Market. As businesses adapt to flexible work arrangements, the reliance on cloud-based solutions has intensified. This shift necessitates reliable disaster recovery services that can support remote operations and ensure data accessibility from various locations. Companies are increasingly recognizing that traditional recovery methods may not be adequate in a remote work environment. Consequently, the Disaster Recovery as a Service Market is witnessing growth as organizations seek solutions that provide seamless access to data and applications, regardless of employee location.

Increased Cybersecurity Threats

The rise in cybersecurity threats is a significant driver for the Disaster Recovery as a Service Market. With cyberattacks becoming more sophisticated and frequent, organizations are compelled to adopt proactive measures to safeguard their data. Ransomware attacks, in particular, have surged, with reports indicating that the average cost of a ransomware attack can exceed millions of dollars. This alarming trend underscores the necessity for effective disaster recovery solutions that can quickly restore operations after an attack. The Disaster Recovery as a Service Market is thus experiencing increased interest as businesses seek to implement robust recovery strategies that mitigate the impact of cyber threats and ensure business continuity.

Regulatory Compliance Requirements

The stringent regulatory landscape across various sectors is propelling the Disaster Recovery as a Service Market. Organizations are increasingly mandated to comply with regulations that require data protection and recovery plans. For instance, regulations such as GDPR and HIPAA impose strict guidelines on data handling and recovery processes. Failure to comply can result in severe penalties, prompting businesses to invest in comprehensive disaster recovery solutions. The Disaster Recovery as a Service Market is responding to this need by offering services that not only ensure compliance but also enhance overall data security. As regulatory scrutiny intensifies, the demand for disaster recovery services is likely to grow, positioning the industry for sustained expansion.

Technological Advancements in Cloud Services

Technological advancements in cloud services are significantly influencing the Disaster Recovery as a Service Market. Innovations such as artificial intelligence and machine learning are enhancing the capabilities of disaster recovery solutions, enabling faster recovery times and improved data management. These advancements allow organizations to automate recovery processes, reducing the time and effort required to restore operations after a disruption. As businesses increasingly adopt cloud technologies, the demand for sophisticated disaster recovery services is likely to rise. The Disaster Recovery as a Service Market is thus positioned to benefit from these technological trends, offering solutions that align with the evolving needs of modern enterprises.

Market Segment Insights

By Service Type: Backup (Largest) vs. Data Security (Fastest-Growing)

The Disaster Recovery as a Service market is primarily segmented into several key service types: Backup, Data Security, System Integration, Training &amp; Consulting, Support &amp; Maintenance, <a href="https://www.marketresearchfuture.com/press-release/disaster-recovery-service-market">Real-Time Replication</a>, and Professional Services. Among these, Backup services hold the largest market share, leveraged by organizations focusing on restoring lost data to ensure business continuity. Training &amp; Consulting and Support &amp; Maintenance are also significant, catering to businesses that prioritize operational efficiency and risk management strategies.

Backup (Dominant) vs. Data Security (Emerging)

Backup services dominate the Disaster Recovery as a Service market by addressing essential needs for data restoration and security, making them critical for organizations of all sizes. These services ensure that in case of disruptions, businesses can quickly recover their data and resume operations, which is essential for maintaining customer trust and compliance with regulations. In contrast, Data Security is emerging as a rapidly growing segment, driven by increasing cyber threats and regulatory requirements. Organizations are prioritizing advanced data protection measures to safeguard sensitive information, prompting service providers to innovate continuously. As such, while Backup remains the cornerstone of disaster recovery strategies, Data Security is becoming increasingly vital.

By Deployment: Hybrid Cloud (Largest) vs. Private Cloud (Fastest-Growing)

In the Disaster Recovery as a Service (DRaaS) market, the deployment segment is marked by distinct preferences among users for different cloud models. Hybrid Cloud stands out as the largest, owing to its ability to offer businesses a combination of flexibility, scalability, and secure backup solutions. Private Cloud also holds a notable share, appealing to organizations that prioritize data security and regulatory compliance, while Public Cloud continues to be a viable option for many looking for cost-effective and on-demand resources. The growth trends in this segment are driven primarily by the increasing demand for systematic disaster recovery solutions across various industries. Hybrid Cloud's adaptability makes it increasingly appealing to businesses undergoing digital transformations. Meanwhile, the rise in cybersecurity concerns and the need for robust recovery solutions propel the growth of Private Cloud deployments, making it the fastest-growing deployment model in the DRaaS segment.

Hybrid Cloud (Dominant) vs. Private Cloud (Emerging)

Hybrid Cloud represents a dominant force in the Disaster Recovery as a Service market, blending the advantages of both public and private infrastructures. This model empowers organizations by allowing them to store sensitive data in their private cloud while leveraging public resources for backup, thus optimizing cost-effectiveness and ensuring resilience. The flexibility and control it offers make it an attractive option for businesses looking to balance performance while mitigating risks associated with high dependency on a single deployment model. In contrast, Private Cloud is an emerging player, catering specifically to organizations with stringent compliance needs. Its focus on enhanced security and customization aligns well with enterprises managing sensitive information, making it a preferred choice for sectors such as finance and healthcare.

By Verticals: BFSI (Largest) vs. Healthcare (Fastest-Growing)

The Disaster Recovery as a Service (DRaaS) market shows a diverse distribution across several verticals, with the Banking, Financial Services, and Insurance (BFSI) sector commanding the largest market share. Other notable segments include IT &amp; Telecom, Manufacturing, and Government, which also hold substantial portions of the market. Meanwhile, segments such as Retail and Media contribute to the competitive landscape but are smaller in terms of overall market penetration. As the market continues to evolve, the Healthcare sector is observed as the fastest-growing vertical in the DRaaS space. The surge in demand is driven by increasing regulatory requirements and the need for robust data protection strategies. Additionally, the ongoing digitization of healthcare services intensifies the necessity for resilient disaster recovery solutions.

BFSI (Dominant) vs. Healthcare (Emerging)

The BFSI sector remains the dominant player in the Disaster Recovery as a Service market, characterized by a high reliance on advanced technologies to mitigate risks related to data loss and operational downtime. This vertical encompasses a wide array of businesses, including banks, insurance companies, and investment firms, that prioritize data integrity and availability. In contrast, the Healthcare sector is emerging rapidly due to its increasing dependence on electronic health records and telemedicine services, making it susceptible to data breaches and operational disruptions. Thus, as Healthcare organizations seek to enhance their IT resilience, they are increasingly adopting DRaaS solutions, positioning this segment for significant growth in the coming years.

Get more detailed insights about Disaster Recovery as a Service Market Research Report- Global Forecast 2035

Regional Insights

This market has been segmented by region into North America, Europe, Asia-Pacific, and the rest of the world. The North American region dominated the market in 2022 and is expected to grow at a CAGR of 18.62% through the forecast period. The adoption of cutting-edge resilience solutions by SMEs and major corporations across numerous industries has increased market demand. The rapid development of cloud technologies and the presence of critical end-use industries are fostering market expansion. High market growth in Europe is mainly attributable to rising demand from end-use industries with developed IT, business, telecommunications, and other sectors.

It is anticipated that the presence of a sizable number of companies in the area and the high penetration rate in the telecommunications, information technology, and financial services sectors will be the primary drivers for the expansion of the disaster recovery-as-a-service market share in the area. The presence of a few key players, including IBM Corporation, Amazon Web Services, and Microsoft Corporation aids the expansion of the disaster recovery-as-a-service market.

Figure 4: DISASTER RECOVERY AS A SERVICE MARKET SHARE BY REGION 2022 (%)

On the other side, the Europe region is also expected to grow at a CAGR of 17.37% during the forecast period. Europe is making progress in integrating DRaaS products into its market. The adoption of DRaaS solutions is significantly increasing in the APAC market, followed by the MEA, while the region of South America is taking a more cautious approach. According to the European General Data Protection Regulation, businesses must develop a variety of safeguards to guard their sensitive data against cyber-attacks and natural catastrophes.

Key Players and Competitive Insights

Major players in the disaster recovery as a service market, including HP Enterprises Company, Microsoft Corporation, Treo Information Technology , VMware Inc., Sungard Availability Services, Amazon Web Services, Cable & Wireless Communications, IBM Corporation, Cisco Systems, NTT Communications, InterVision, TierPoint, LLC, Infrascale, Acronis International GmbH , KDDI Corp., Insight Partners , SpaceX and The LEMOINE Company. The major business strategies used by the market participants in the disaster recovery space as a service include partnerships, acquisitions, and product launches. Furthermore, among the main challenges impeding the market's expansion for disaster recovery as a service are worries about security and privacy. The prevalence of cyber-attacks and security lapses has made security and privacy the most crucial factors in ensuring an organization's success.  

Key Companies in the Disaster Recovery Service Market include

Industry Developments

  • Q2 2024: Acronis launches new AI-powered Disaster Recovery as a Service platform Acronis announced the launch of its next-generation DRaaS platform, integrating advanced AI-driven orchestration and ransomware recovery features to enhance business continuity for enterprise clients.
  • Q1 2024: IBM partners with AWS to expand Disaster Recovery as a Service offerings IBM and Amazon Web Services entered a strategic partnership to deliver hybrid cloud disaster recovery solutions, aiming to improve interoperability and global coverage for enterprise customers.
  • Q2 2024: Zerto unveils real-time replication feature for DRaaS customers Zerto announced a major product update introducing real-time replication and continuous data protection capabilities to its disaster recovery as a service platform.
  • Q3 2024: Veeam acquires CloudEndure to strengthen DRaaS portfolio Veeam completed the acquisition of CloudEndure, a cloud-based disaster recovery provider, to expand its DRaaS offerings and accelerate innovation in cloud-native recovery solutions.
  • Q1 2025: Microsoft launches new multi-cloud DRaaS solution for regulated industries Microsoft introduced a multi-cloud disaster recovery service tailored for financial and healthcare sectors, focusing on compliance with new EU DORA regulations.
  • Q2 2025: Datto secures $100M contract to provide DRaaS for US federal agencies Datto announced a $100 million contract win to deliver disaster recovery as a service solutions to multiple US federal government agencies, enhancing national cyber resilience.
  • Q2 2024: Google Cloud launches edge disaster recovery service for decentralized enterprises Google Cloud rolled out a new edge DRaaS offering designed for decentralized organizations, enabling rapid failover and recovery across distributed IT environments.
  • Q3 2024: Rubrik appoints new Chief Product Officer to lead DRaaS innovation Rubrik named a new Chief Product Officer to spearhead the development of advanced disaster recovery as a service features, including AI-powered analytics and automated failover.
  • Q1 2025: Druva files for IPO to expand global DRaaS operations Druva submitted its initial public offering paperwork, aiming to raise capital for international expansion and further development of its cloud-based disaster recovery services.
  • Q2 2025: Acronis opens new DRaaS data center in Frankfurt to support EU compliance Acronis inaugurated a new disaster recovery data center in Frankfurt, Germany, to meet growing demand for EU-compliant DRaaS solutions amid tightening regulatory requirements.
  • Q1 2024: Veeam launches pay-as-you-go DRaaS model for SMBs Veeam introduced a flexible, pay-as-you-go disaster recovery as a service offering targeting small and medium-sized businesses, enabling cost-effective protection against cyber threats.
  • Q3 2025: Dell Technologies partners with Azure for integrated DRaaS solutions Dell Technologies announced a partnership with Microsoft Azure to deliver integrated disaster recovery as a service solutions, focusing on seamless cloud failover and rapid recovery for enterprise clients.

Future Outlook

Disaster Recovery Service Market Future Outlook

The Disaster Recovery as a Service Market is projected to grow at a 20.0% CAGR from 2025 to 2035, driven by increasing data security needs and regulatory compliance.

New opportunities lie in:

  • <p>Development of AI-driven recovery solutions for real-time data protection. Expansion of multi-cloud strategies to enhance service resilience. Integration of automated compliance tools to streamline disaster recovery processes.</p>

By 2035, the market is expected to be robust, reflecting substantial growth and innovation.

Market Segmentation

Disaster Recovery Service Market Verticals Outlook

  • IT & Telecom
  • Healthcare
  • Retail
  • Government
  • Manufacturing
  • BFSI
  • Media
  • Others

Disaster Recovery Service Market Deployment Outlook

  • Public Cloud
  • Private Cloud
  • Hybrid Cloud

Disaster Recovery Service Market Service Type Outlook

  • Training & Consulting
  • Support & Maintenance
  • Backup
  • Data Security
  • Professional Services
  • Real-Time Replication
  • System Integration

Report Scope

MARKET SIZE 2024 47.04(USD Billion)
MARKET SIZE 2025 56.45(USD Billion)
MARKET SIZE 2035 349.51(USD Billion)
COMPOUND ANNUAL GROWTH RATE (CAGR) 20.0% (2025 - 2035)
REPORT COVERAGE Revenue Forecast, Competitive Landscape, Growth Factors, and Trends
BASE YEAR 2024
Market Forecast Period 2025 - 2035
Historical Data 2019 - 2024
Market Forecast Units USD Billion
Key Companies Profiled IBM (US), Microsoft (US), Amazon Web Services (US), Dell Technologies (US), VMware (US), Acronis (CH), Zerto (IL), Carbonite (US), Sungard Availability Services (US)
Segments Covered Service Type, Verticals v, Deployment, Region
Key Market Opportunities Integration of artificial intelligence enhances efficiency in the Disaster Recovery as a Service Market.
Key Market Dynamics Rising demand for cloud-based solutions drives competitive dynamics in the Disaster Recovery as a Service market.
Countries Covered North America, Europe, APAC, South America, MEA

FAQs

What is the current valuation of the Disaster Recovery as a Service Market?

<p>The market valuation was 47.04 USD Billion in 2024.</p>

What is the projected market size for the Disaster Recovery as a Service Market by 2035?

<p>The projected valuation for 2035 is 349.51 USD Billion.</p>

What is the expected CAGR for the Disaster Recovery as a Service Market from 2025 to 2035?

<p>The expected CAGR during the forecast period 2025 - 2035 is 20.0%.</p>

Which companies are considered key players in the Disaster Recovery as a Service Market?

<p>Key players include IBM, Microsoft, Amazon Web Services, Dell Technologies, VMware, Acronis, Zerto, Carbonite, and Sungard Availability Services.</p>

What segment had the highest valuation in the Disaster Recovery as a Service Market in 2024?

<p>The Backup segment had the highest valuation at 10.0 USD Billion.</p>

How does the Public Cloud segment compare to the Private Cloud segment in terms of market size?

<p>In 2024, the Public Cloud segment was valued at 18.82 USD Billion, while the Private Cloud segment was valued at 14.26 USD Billion.</p>

What is the valuation of the Healthcare vertical in the Disaster Recovery as a Service Market?

<p>The Healthcare vertical was valued at 7.05 USD Billion in 2024.</p>

Which service type segment is projected to grow the most in the Disaster Recovery as a Service Market?

<p>The Support & Maintenance segment is projected to grow significantly, with a valuation of 4.7 USD Billion in 2024.</p>

What is the valuation of the BFSI vertical in the Disaster Recovery as a Service Market?

<p>The BFSI vertical was valued at 8.41 USD Billion in 2024.</p>

What is the projected growth trend for the Hybrid Cloud segment in the Disaster Recovery as a Service Market?

<p>The Hybrid Cloud segment was valued at 14.96 USD Billion in 2024 and is expected to continue growing through 2035.</p>

  1. SECTION I: EXECUTIVE SUMMARY AND KEY HIGHLIGHTS
    1. | 1.1 EXECUTIVE SUMMARY
    2. | | 1.1.1 Market Overview
    3. | | 1.1.2 Key Findings
    4. | | 1.1.3 Market Segmentation
    5. | | 1.1.4 Competitive Landscape
    6. | | 1.1.5 Challenges and Opportunities
    7. | | 1.1.6 Future Outlook
  2. SECTION II: SCOPING, METHODOLOGY AND MARKET STRUCTURE
    1. | 2.1 MARKET INTRODUCTION
    2. | | 2.1.1 Definition
    3. | | 2.1.2 Scope of the study
    4. | | | 2.1.2.1 Research Objective
    5. | | | 2.1.2.2 Assumption
    6. | | | 2.1.2.3 Limitations
    7. | 2.2 RESEARCH METHODOLOGY
    8. | | 2.2.1 Overview
    9. | | 2.2.2 Data Mining
    10. | | 2.2.3 Secondary Research
    11. | | 2.2.4 Primary Research
    12. | | | 2.2.4.1 Primary Interviews and Information Gathering Process
    13. | | | 2.2.4.2 Breakdown of Primary Respondents
    14. | | 2.2.5 Forecasting Model
    15. | | 2.2.6 Market Size Estimation
    16. | | | 2.2.6.1 Bottom-Up Approach
    17. | | | 2.2.6.2 Top-Down Approach
    18. | | 2.2.7 Data Triangulation
    19. | | 2.2.8 Validation
  3. SECTION III: QUALITATIVE ANALYSIS
    1. | 3.1 MARKET DYNAMICS
    2. | | 3.1.1 Overview
    3. | | 3.1.2 Drivers
    4. | | 3.1.3 Restraints
    5. | | 3.1.4 Opportunities
    6. | 3.2 MARKET FACTOR ANALYSIS
    7. | | 3.2.1 Value chain Analysis
    8. | | 3.2.2 Porter's Five Forces Analysis
    9. | | | 3.2.2.1 Bargaining Power of Suppliers
    10. | | | 3.2.2.2 Bargaining Power of Buyers
    11. | | | 3.2.2.3 Threat of New Entrants
    12. | | | 3.2.2.4 Threat of Substitutes
    13. | | | 3.2.2.5 Intensity of Rivalry
    14. | | 3.2.3 COVID-19 Impact Analysis
    15. | | | 3.2.3.1 Market Impact Analysis
    16. | | | 3.2.3.2 Regional Impact
    17. | | | 3.2.3.3 Opportunity and Threat Analysis
  4. SECTION IV: QUANTITATIVE ANALYSIS
    1. | 4.1 Information and Communications Technology, BY Service Type (USD Billion)
    2. | | 4.1.1 Training & Consulting
    3. | | 4.1.2 Support & Maintenance
    4. | | 4.1.3 Backup
    5. | | 4.1.4 Data Security
    6. | | 4.1.5 Professional Services
    7. | | 4.1.6 Real-Time Replication
    8. | | 4.1.7 System Integration
    9. | 4.2 Information and Communications Technology, BY Deployment (USD Billion)
    10. | | 4.2.1 Public Cloud
    11. | | 4.2.2 Private Cloud
    12. | | 4.2.3 Hybrid Cloud
    13. | 4.3 Information and Communications Technology, BY Verticals (USD Billion)
    14. | | 4.3.1 IT & Telecom
    15. | | 4.3.2 Healthcare
    16. | | 4.3.3 Retail
    17. | | 4.3.4 Government
    18. | | 4.3.5 Manufacturing
    19. | | 4.3.6 BFSI
    20. | | 4.3.7 Media
    21. | | 4.3.8 Others
    22. | 4.4 Information and Communications Technology, BY Region (USD Billion)
    23. | | 4.4.1 North America
    24. | | | 4.4.1.1 US
    25. | | | 4.4.1.2 Canada
    26. | | 4.4.2 Europe
    27. | | | 4.4.2.1 Germany
    28. | | | 4.4.2.2 UK
    29. | | | 4.4.2.3 France
    30. | | | 4.4.2.4 Russia
    31. | | | 4.4.2.5 Italy
    32. | | | 4.4.2.6 Spain
    33. | | | 4.4.2.7 Rest of Europe
    34. | | 4.4.3 APAC
    35. | | | 4.4.3.1 China
    36. | | | 4.4.3.2 India
    37. | | | 4.4.3.3 Japan
    38. | | | 4.4.3.4 South Korea
    39. | | | 4.4.3.5 Malaysia
    40. | | | 4.4.3.6 Thailand
    41. | | | 4.4.3.7 Indonesia
    42. | | | 4.4.3.8 Rest of APAC
    43. | | 4.4.4 South America
    44. | | | 4.4.4.1 Brazil
    45. | | | 4.4.4.2 Mexico
    46. | | | 4.4.4.3 Argentina
    47. | | | 4.4.4.4 Rest of South America
    48. | | 4.4.5 MEA
    49. | | | 4.4.5.1 GCC Countries
    50. | | | 4.4.5.2 South Africa
    51. | | | 4.4.5.3 Rest of MEA
  5. SECTION V: COMPETITIVE ANALYSIS
    1. | 5.1 Competitive Landscape
    2. | | 5.1.1 Overview
    3. | | 5.1.2 Competitive Analysis
    4. | | 5.1.3 Market share Analysis
    5. | | 5.1.4 Major Growth Strategy in the Information and Communications Technology
    6. | | 5.1.5 Competitive Benchmarking
    7. | | 5.1.6 Leading Players in Terms of Number of Developments in the Information and Communications Technology
    8. | | 5.1.7 Key developments and growth strategies
    9. | | | 5.1.7.1 New Product Launch/Service Deployment
    10. | | | 5.1.7.2 Merger & Acquisitions
    11. | | | 5.1.7.3 Joint Ventures
    12. | | 5.1.8 Major Players Financial Matrix
    13. | | | 5.1.8.1 Sales and Operating Income
    14. | | | 5.1.8.2 Major Players R&D Expenditure. 2023
    15. | 5.2 Company Profiles
    16. | | 5.2.1 IBM (US)
    17. | | | 5.2.1.1 Financial Overview
    18. | | | 5.2.1.2 Products Offered
    19. | | | 5.2.1.3 Key Developments
    20. | | | 5.2.1.4 SWOT Analysis
    21. | | | 5.2.1.5 Key Strategies
    22. | | 5.2.2 Microsoft (US)
    23. | | | 5.2.2.1 Financial Overview
    24. | | | 5.2.2.2 Products Offered
    25. | | | 5.2.2.3 Key Developments
    26. | | | 5.2.2.4 SWOT Analysis
    27. | | | 5.2.2.5 Key Strategies
    28. | | 5.2.3 Amazon Web Services (US)
    29. | | | 5.2.3.1 Financial Overview
    30. | | | 5.2.3.2 Products Offered
    31. | | | 5.2.3.3 Key Developments
    32. | | | 5.2.3.4 SWOT Analysis
    33. | | | 5.2.3.5 Key Strategies
    34. | | 5.2.4 Dell Technologies (US)
    35. | | | 5.2.4.1 Financial Overview
    36. | | | 5.2.4.2 Products Offered
    37. | | | 5.2.4.3 Key Developments
    38. | | | 5.2.4.4 SWOT Analysis
    39. | | | 5.2.4.5 Key Strategies
    40. | | 5.2.5 VMware (US)
    41. | | | 5.2.5.1 Financial Overview
    42. | | | 5.2.5.2 Products Offered
    43. | | | 5.2.5.3 Key Developments
    44. | | | 5.2.5.4 SWOT Analysis
    45. | | | 5.2.5.5 Key Strategies
    46. | | 5.2.6 Acronis (CH)
    47. | | | 5.2.6.1 Financial Overview
    48. | | | 5.2.6.2 Products Offered
    49. | | | 5.2.6.3 Key Developments
    50. | | | 5.2.6.4 SWOT Analysis
    51. | | | 5.2.6.5 Key Strategies
    52. | | 5.2.7 Zerto (IL)
    53. | | | 5.2.7.1 Financial Overview
    54. | | | 5.2.7.2 Products Offered
    55. | | | 5.2.7.3 Key Developments
    56. | | | 5.2.7.4 SWOT Analysis
    57. | | | 5.2.7.5 Key Strategies
    58. | | 5.2.8 Carbonite (US)
    59. | | | 5.2.8.1 Financial Overview
    60. | | | 5.2.8.2 Products Offered
    61. | | | 5.2.8.3 Key Developments
    62. | | | 5.2.8.4 SWOT Analysis
    63. | | | 5.2.8.5 Key Strategies
    64. | | 5.2.9 Sungard Availability Services (US)
    65. | | | 5.2.9.1 Financial Overview
    66. | | | 5.2.9.2 Products Offered
    67. | | | 5.2.9.3 Key Developments
    68. | | | 5.2.9.4 SWOT Analysis
    69. | | | 5.2.9.5 Key Strategies
    70. | 5.3 Appendix
    71. | | 5.3.1 References
    72. | | 5.3.2 Related Reports
  6. LIST OF FIGURES
    1. | 6.1 MARKET SYNOPSIS
    2. | 6.2 NORTH AMERICA MARKET ANALYSIS
    3. | 6.3 US MARKET ANALYSIS BY SERVICE TYPE
    4. | 6.4 US MARKET ANALYSIS BY DEPLOYMENT
    5. | 6.5 US MARKET ANALYSIS BY VERTICALS
    6. | 6.6 CANADA MARKET ANALYSIS BY SERVICE TYPE
    7. | 6.7 CANADA MARKET ANALYSIS BY DEPLOYMENT
    8. | 6.8 CANADA MARKET ANALYSIS BY VERTICALS
    9. | 6.9 EUROPE MARKET ANALYSIS
    10. | 6.10 GERMANY MARKET ANALYSIS BY SERVICE TYPE
    11. | 6.11 GERMANY MARKET ANALYSIS BY DEPLOYMENT
    12. | 6.12 GERMANY MARKET ANALYSIS BY VERTICALS
    13. | 6.13 UK MARKET ANALYSIS BY SERVICE TYPE
    14. | 6.14 UK MARKET ANALYSIS BY DEPLOYMENT
    15. | 6.15 UK MARKET ANALYSIS BY VERTICALS
    16. | 6.16 FRANCE MARKET ANALYSIS BY SERVICE TYPE
    17. | 6.17 FRANCE MARKET ANALYSIS BY DEPLOYMENT
    18. | 6.18 FRANCE MARKET ANALYSIS BY VERTICALS
    19. | 6.19 RUSSIA MARKET ANALYSIS BY SERVICE TYPE
    20. | 6.20 RUSSIA MARKET ANALYSIS BY DEPLOYMENT
    21. | 6.21 RUSSIA MARKET ANALYSIS BY VERTICALS
    22. | 6.22 ITALY MARKET ANALYSIS BY SERVICE TYPE
    23. | 6.23 ITALY MARKET ANALYSIS BY DEPLOYMENT
    24. | 6.24 ITALY MARKET ANALYSIS BY VERTICALS
    25. | 6.25 SPAIN MARKET ANALYSIS BY SERVICE TYPE
    26. | 6.26 SPAIN MARKET ANALYSIS BY DEPLOYMENT
    27. | 6.27 SPAIN MARKET ANALYSIS BY VERTICALS
    28. | 6.28 REST OF EUROPE MARKET ANALYSIS BY SERVICE TYPE
    29. | 6.29 REST OF EUROPE MARKET ANALYSIS BY DEPLOYMENT
    30. | 6.30 REST OF EUROPE MARKET ANALYSIS BY VERTICALS
    31. | 6.31 APAC MARKET ANALYSIS
    32. | 6.32 CHINA MARKET ANALYSIS BY SERVICE TYPE
    33. | 6.33 CHINA MARKET ANALYSIS BY DEPLOYMENT
    34. | 6.34 CHINA MARKET ANALYSIS BY VERTICALS
    35. | 6.35 INDIA MARKET ANALYSIS BY SERVICE TYPE
    36. | 6.36 INDIA MARKET ANALYSIS BY DEPLOYMENT
    37. | 6.37 INDIA MARKET ANALYSIS BY VERTICALS
    38. | 6.38 JAPAN MARKET ANALYSIS BY SERVICE TYPE
    39. | 6.39 JAPAN MARKET ANALYSIS BY DEPLOYMENT
    40. | 6.40 JAPAN MARKET ANALYSIS BY VERTICALS
    41. | 6.41 SOUTH KOREA MARKET ANALYSIS BY SERVICE TYPE
    42. | 6.42 SOUTH KOREA MARKET ANALYSIS BY DEPLOYMENT
    43. | 6.43 SOUTH KOREA MARKET ANALYSIS BY VERTICALS
    44. | 6.44 MALAYSIA MARKET ANALYSIS BY SERVICE TYPE
    45. | 6.45 MALAYSIA MARKET ANALYSIS BY DEPLOYMENT
    46. | 6.46 MALAYSIA MARKET ANALYSIS BY VERTICALS
    47. | 6.47 THAILAND MARKET ANALYSIS BY SERVICE TYPE
    48. | 6.48 THAILAND MARKET ANALYSIS BY DEPLOYMENT
    49. | 6.49 THAILAND MARKET ANALYSIS BY VERTICALS
    50. | 6.50 INDONESIA MARKET ANALYSIS BY SERVICE TYPE
    51. | 6.51 INDONESIA MARKET ANALYSIS BY DEPLOYMENT
    52. | 6.52 INDONESIA MARKET ANALYSIS BY VERTICALS
    53. | 6.53 REST OF APAC MARKET ANALYSIS BY SERVICE TYPE
    54. | 6.54 REST OF APAC MARKET ANALYSIS BY DEPLOYMENT
    55. | 6.55 REST OF APAC MARKET ANALYSIS BY VERTICALS
    56. | 6.56 SOUTH AMERICA MARKET ANALYSIS
    57. | 6.57 BRAZIL MARKET ANALYSIS BY SERVICE TYPE
    58. | 6.58 BRAZIL MARKET ANALYSIS BY DEPLOYMENT
    59. | 6.59 BRAZIL MARKET ANALYSIS BY VERTICALS
    60. | 6.60 MEXICO MARKET ANALYSIS BY SERVICE TYPE
    61. | 6.61 MEXICO MARKET ANALYSIS BY DEPLOYMENT
    62. | 6.62 MEXICO MARKET ANALYSIS BY VERTICALS
    63. | 6.63 ARGENTINA MARKET ANALYSIS BY SERVICE TYPE
    64. | 6.64 ARGENTINA MARKET ANALYSIS BY DEPLOYMENT
    65. | 6.65 ARGENTINA MARKET ANALYSIS BY VERTICALS
    66. | 6.66 REST OF SOUTH AMERICA MARKET ANALYSIS BY SERVICE TYPE
    67. | 6.67 REST OF SOUTH AMERICA MARKET ANALYSIS BY DEPLOYMENT
    68. | 6.68 REST OF SOUTH AMERICA MARKET ANALYSIS BY VERTICALS
    69. | 6.69 MEA MARKET ANALYSIS
    70. | 6.70 GCC COUNTRIES MARKET ANALYSIS BY SERVICE TYPE
    71. | 6.71 GCC COUNTRIES MARKET ANALYSIS BY DEPLOYMENT
    72. | 6.72 GCC COUNTRIES MARKET ANALYSIS BY VERTICALS
    73. | 6.73 SOUTH AFRICA MARKET ANALYSIS BY SERVICE TYPE
    74. | 6.74 SOUTH AFRICA MARKET ANALYSIS BY DEPLOYMENT
    75. | 6.75 SOUTH AFRICA MARKET ANALYSIS BY VERTICALS
    76. | 6.76 REST OF MEA MARKET ANALYSIS BY SERVICE TYPE
    77. | 6.77 REST OF MEA MARKET ANALYSIS BY DEPLOYMENT
    78. | 6.78 REST OF MEA MARKET ANALYSIS BY VERTICALS
    79. | 6.79 KEY BUYING CRITERIA OF INFORMATION AND COMMUNICATIONS TECHNOLOGY
    80. | 6.80 RESEARCH PROCESS OF MRFR
    81. | 6.81 DRO ANALYSIS OF INFORMATION AND COMMUNICATIONS TECHNOLOGY
    82. | 6.82 DRIVERS IMPACT ANALYSIS: INFORMATION AND COMMUNICATIONS TECHNOLOGY
    83. | 6.83 RESTRAINTS IMPACT ANALYSIS: INFORMATION AND COMMUNICATIONS TECHNOLOGY
    84. | 6.84 SUPPLY / VALUE CHAIN: INFORMATION AND COMMUNICATIONS TECHNOLOGY
    85. | 6.85 INFORMATION AND COMMUNICATIONS TECHNOLOGY, BY SERVICE TYPE, 2024 (% SHARE)
    86. | 6.86 INFORMATION AND COMMUNICATIONS TECHNOLOGY, BY SERVICE TYPE, 2024 TO 2035 (USD Billion)
    87. | 6.87 INFORMATION AND COMMUNICATIONS TECHNOLOGY, BY DEPLOYMENT, 2024 (% SHARE)
    88. | 6.88 INFORMATION AND COMMUNICATIONS TECHNOLOGY, BY DEPLOYMENT, 2024 TO 2035 (USD Billion)
    89. | 6.89 INFORMATION AND COMMUNICATIONS TECHNOLOGY, BY VERTICALS, 2024 (% SHARE)
    90. | 6.90 INFORMATION AND COMMUNICATIONS TECHNOLOGY, BY VERTICALS, 2024 TO 2035 (USD Billion)
    91. | 6.91 BENCHMARKING OF MAJOR COMPETITORS
  7. LIST OF TABLES
    1. | 7.1 LIST OF ASSUMPTIONS
    2. | | 7.1.1
    3. | 7.2 North America MARKET SIZE ESTIMATES; FORECAST
    4. | | 7.2.1 BY SERVICE TYPE, 2025-2035 (USD Billion)
    5. | | 7.2.2 BY DEPLOYMENT, 2025-2035 (USD Billion)
    6. | | 7.2.3 BY VERTICALS, 2025-2035 (USD Billion)
    7. | 7.3 US MARKET SIZE ESTIMATES; FORECAST
    8. | | 7.3.1 BY SERVICE TYPE, 2025-2035 (USD Billion)
    9. | | 7.3.2 BY DEPLOYMENT, 2025-2035 (USD Billion)
    10. | | 7.3.3 BY VERTICALS, 2025-2035 (USD Billion)
    11. | 7.4 Canada MARKET SIZE ESTIMATES; FORECAST
    12. | | 7.4.1 BY SERVICE TYPE, 2025-2035 (USD Billion)
    13. | | 7.4.2 BY DEPLOYMENT, 2025-2035 (USD Billion)
    14. | | 7.4.3 BY VERTICALS, 2025-2035 (USD Billion)
    15. | 7.5 Europe MARKET SIZE ESTIMATES; FORECAST
    16. | | 7.5.1 BY SERVICE TYPE, 2025-2035 (USD Billion)
    17. | | 7.5.2 BY DEPLOYMENT, 2025-2035 (USD Billion)
    18. | | 7.5.3 BY VERTICALS, 2025-2035 (USD Billion)
    19. | 7.6 Germany MARKET SIZE ESTIMATES; FORECAST
    20. | | 7.6.1 BY SERVICE TYPE, 2025-2035 (USD Billion)
    21. | | 7.6.2 BY DEPLOYMENT, 2025-2035 (USD Billion)
    22. | | 7.6.3 BY VERTICALS, 2025-2035 (USD Billion)
    23. | 7.7 UK MARKET SIZE ESTIMATES; FORECAST
    24. | | 7.7.1 BY SERVICE TYPE, 2025-2035 (USD Billion)
    25. | | 7.7.2 BY DEPLOYMENT, 2025-2035 (USD Billion)
    26. | | 7.7.3 BY VERTICALS, 2025-2035 (USD Billion)
    27. | 7.8 France MARKET SIZE ESTIMATES; FORECAST
    28. | | 7.8.1 BY SERVICE TYPE, 2025-2035 (USD Billion)
    29. | | 7.8.2 BY DEPLOYMENT, 2025-2035 (USD Billion)
    30. | | 7.8.3 BY VERTICALS, 2025-2035 (USD Billion)
    31. | 7.9 Russia MARKET SIZE ESTIMATES; FORECAST
    32. | | 7.9.1 BY SERVICE TYPE, 2025-2035 (USD Billion)
    33. | | 7.9.2 BY DEPLOYMENT, 2025-2035 (USD Billion)
    34. | | 7.9.3 BY VERTICALS, 2025-2035 (USD Billion)
    35. | 7.10 Italy MARKET SIZE ESTIMATES; FORECAST
    36. | | 7.10.1 BY SERVICE TYPE, 2025-2035 (USD Billion)
    37. | | 7.10.2 BY DEPLOYMENT, 2025-2035 (USD Billion)
    38. | | 7.10.3 BY VERTICALS, 2025-2035 (USD Billion)
    39. | 7.11 Spain MARKET SIZE ESTIMATES; FORECAST
    40. | | 7.11.1 BY SERVICE TYPE, 2025-2035 (USD Billion)
    41. | | 7.11.2 BY DEPLOYMENT, 2025-2035 (USD Billion)
    42. | | 7.11.3 BY VERTICALS, 2025-2035 (USD Billion)
    43. | 7.12 Rest of Europe MARKET SIZE ESTIMATES; FORECAST
    44. | | 7.12.1 BY SERVICE TYPE, 2025-2035 (USD Billion)
    45. | | 7.12.2 BY DEPLOYMENT, 2025-2035 (USD Billion)
    46. | | 7.12.3 BY VERTICALS, 2025-2035 (USD Billion)
    47. | 7.13 APAC MARKET SIZE ESTIMATES; FORECAST
    48. | | 7.13.1 BY SERVICE TYPE, 2025-2035 (USD Billion)
    49. | | 7.13.2 BY DEPLOYMENT, 2025-2035 (USD Billion)
    50. | | 7.13.3 BY VERTICALS, 2025-2035 (USD Billion)
    51. | 7.14 China MARKET SIZE ESTIMATES; FORECAST
    52. | | 7.14.1 BY SERVICE TYPE, 2025-2035 (USD Billion)
    53. | | 7.14.2 BY DEPLOYMENT, 2025-2035 (USD Billion)
    54. | | 7.14.3 BY VERTICALS, 2025-2035 (USD Billion)
    55. | 7.15 India MARKET SIZE ESTIMATES; FORECAST
    56. | | 7.15.1 BY SERVICE TYPE, 2025-2035 (USD Billion)
    57. | | 7.15.2 BY DEPLOYMENT, 2025-2035 (USD Billion)
    58. | | 7.15.3 BY VERTICALS, 2025-2035 (USD Billion)
    59. | 7.16 Japan MARKET SIZE ESTIMATES; FORECAST
    60. | | 7.16.1 BY SERVICE TYPE, 2025-2035 (USD Billion)
    61. | | 7.16.2 BY DEPLOYMENT, 2025-2035 (USD Billion)
    62. | | 7.16.3 BY VERTICALS, 2025-2035 (USD Billion)
    63. | 7.17 South Korea MARKET SIZE ESTIMATES; FORECAST
    64. | | 7.17.1 BY SERVICE TYPE, 2025-2035 (USD Billion)
    65. | | 7.17.2 BY DEPLOYMENT, 2025-2035 (USD Billion)
    66. | | 7.17.3 BY VERTICALS, 2025-2035 (USD Billion)
    67. | 7.18 Malaysia MARKET SIZE ESTIMATES; FORECAST
    68. | | 7.18.1 BY SERVICE TYPE, 2025-2035 (USD Billion)
    69. | | 7.18.2 BY DEPLOYMENT, 2025-2035 (USD Billion)
    70. | | 7.18.3 BY VERTICALS, 2025-2035 (USD Billion)
    71. | 7.19 Thailand MARKET SIZE ESTIMATES; FORECAST
    72. | | 7.19.1 BY SERVICE TYPE, 2025-2035 (USD Billion)
    73. | | 7.19.2 BY DEPLOYMENT, 2025-2035 (USD Billion)
    74. | | 7.19.3 BY VERTICALS, 2025-2035 (USD Billion)
    75. | 7.20 Indonesia MARKET SIZE ESTIMATES; FORECAST
    76. | | 7.20.1 BY SERVICE TYPE, 2025-2035 (USD Billion)
    77. | | 7.20.2 BY DEPLOYMENT, 2025-2035 (USD Billion)
    78. | | 7.20.3 BY VERTICALS, 2025-2035 (USD Billion)
    79. | 7.21 Rest of APAC MARKET SIZE ESTIMATES; FORECAST
    80. | | 7.21.1 BY SERVICE TYPE, 2025-2035 (USD Billion)
    81. | | 7.21.2 BY DEPLOYMENT, 2025-2035 (USD Billion)
    82. | | 7.21.3 BY VERTICALS, 2025-2035 (USD Billion)
    83. | 7.22 South America MARKET SIZE ESTIMATES; FORECAST
    84. | | 7.22.1 BY SERVICE TYPE, 2025-2035 (USD Billion)
    85. | | 7.22.2 BY DEPLOYMENT, 2025-2035 (USD Billion)
    86. | | 7.22.3 BY VERTICALS, 2025-2035 (USD Billion)
    87. | 7.23 Brazil MARKET SIZE ESTIMATES; FORECAST
    88. | | 7.23.1 BY SERVICE TYPE, 2025-2035 (USD Billion)
    89. | | 7.23.2 BY DEPLOYMENT, 2025-2035 (USD Billion)
    90. | | 7.23.3 BY VERTICALS, 2025-2035 (USD Billion)
    91. | 7.24 Mexico MARKET SIZE ESTIMATES; FORECAST
    92. | | 7.24.1 BY SERVICE TYPE, 2025-2035 (USD Billion)
    93. | | 7.24.2 BY DEPLOYMENT, 2025-2035 (USD Billion)
    94. | | 7.24.3 BY VERTICALS, 2025-2035 (USD Billion)
    95. | 7.25 Argentina MARKET SIZE ESTIMATES; FORECAST
    96. | | 7.25.1 BY SERVICE TYPE, 2025-2035 (USD Billion)
    97. | | 7.25.2 BY DEPLOYMENT, 2025-2035 (USD Billion)
    98. | | 7.25.3 BY VERTICALS, 2025-2035 (USD Billion)
    99. | 7.26 Rest of South America MARKET SIZE ESTIMATES; FORECAST
    100. | | 7.26.1 BY SERVICE TYPE, 2025-2035 (USD Billion)
    101. | | 7.26.2 BY DEPLOYMENT, 2025-2035 (USD Billion)
    102. | | 7.26.3 BY VERTICALS, 2025-2035 (USD Billion)
    103. | 7.27 MEA MARKET SIZE ESTIMATES; FORECAST
    104. | | 7.27.1 BY SERVICE TYPE, 2025-2035 (USD Billion)
    105. | | 7.27.2 BY DEPLOYMENT, 2025-2035 (USD Billion)
    106. | | 7.27.3 BY VERTICALS, 2025-2035 (USD Billion)
    107. | 7.28 GCC Countries MARKET SIZE ESTIMATES; FORECAST
    108. | | 7.28.1 BY SERVICE TYPE, 2025-2035 (USD Billion)
    109. | | 7.28.2 BY DEPLOYMENT, 2025-2035 (USD Billion)
    110. | | 7.28.3 BY VERTICALS, 2025-2035 (USD Billion)
    111. | 7.29 South Africa MARKET SIZE ESTIMATES; FORECAST
    112. | | 7.29.1 BY SERVICE TYPE, 2025-2035 (USD Billion)
    113. | | 7.29.2 BY DEPLOYMENT, 2025-2035 (USD Billion)
    114. | | 7.29.3 BY VERTICALS, 2025-2035 (USD Billion)
    115. | 7.30 Rest of MEA MARKET SIZE ESTIMATES; FORECAST
    116. | | 7.30.1 BY SERVICE TYPE, 2025-2035 (USD Billion)
    117. | | 7.30.2 BY DEPLOYMENT, 2025-2035 (USD Billion)
    118. | | 7.30.3 BY VERTICALS, 2025-2035 (USD Billion)
    119. | 7.31 PRODUCT LAUNCH/PRODUCT DEVELOPMENT/APPROVAL
    120. | | 7.31.1
    121. | 7.32 ACQUISITION/PARTNERSHIP
    122. | | 7.32.1

Information and Communications Technology Market Segmentation

Information and Communications Technology By Service Type (USD Billion, 2025-2035)

  • Training & Consulting
  • Support & Maintenance
  • Backup
  • Data Security
  • Professional Services
  • Real-Time Replication
  • System Integration

Information and Communications Technology By Deployment (USD Billion, 2025-2035)

  • Public Cloud
  • Private Cloud
  • Hybrid Cloud

Information and Communications Technology By Verticals (USD Billion, 2025-2035)

  • IT & Telecom
  • Healthcare
  • Retail
  • Government
  • Manufacturing
  • BFSI
  • Media
  • Others
Infographic

Free Sample Request

Kindly complete the form below to receive a free sample of this Report

Get Free Sample

Customer Strories

Compare Licence

×
Features License Type
Single User Multiuser License Enterprise User
Price $4,950 $5,950 $7,250
Maximum User Access Limit 1 User Upto 10 Users Unrestricted Access Throughout the Organization
Free Customization
Direct Access to Analyst
Deliverable Format
Platform Access
Discount on Next Purchase 10% 15% 15%
Printable Versions