Segmentation Quick Reference
| Dimension | Sub-Segments | Dominant Segment | Fastest Growing Segment |
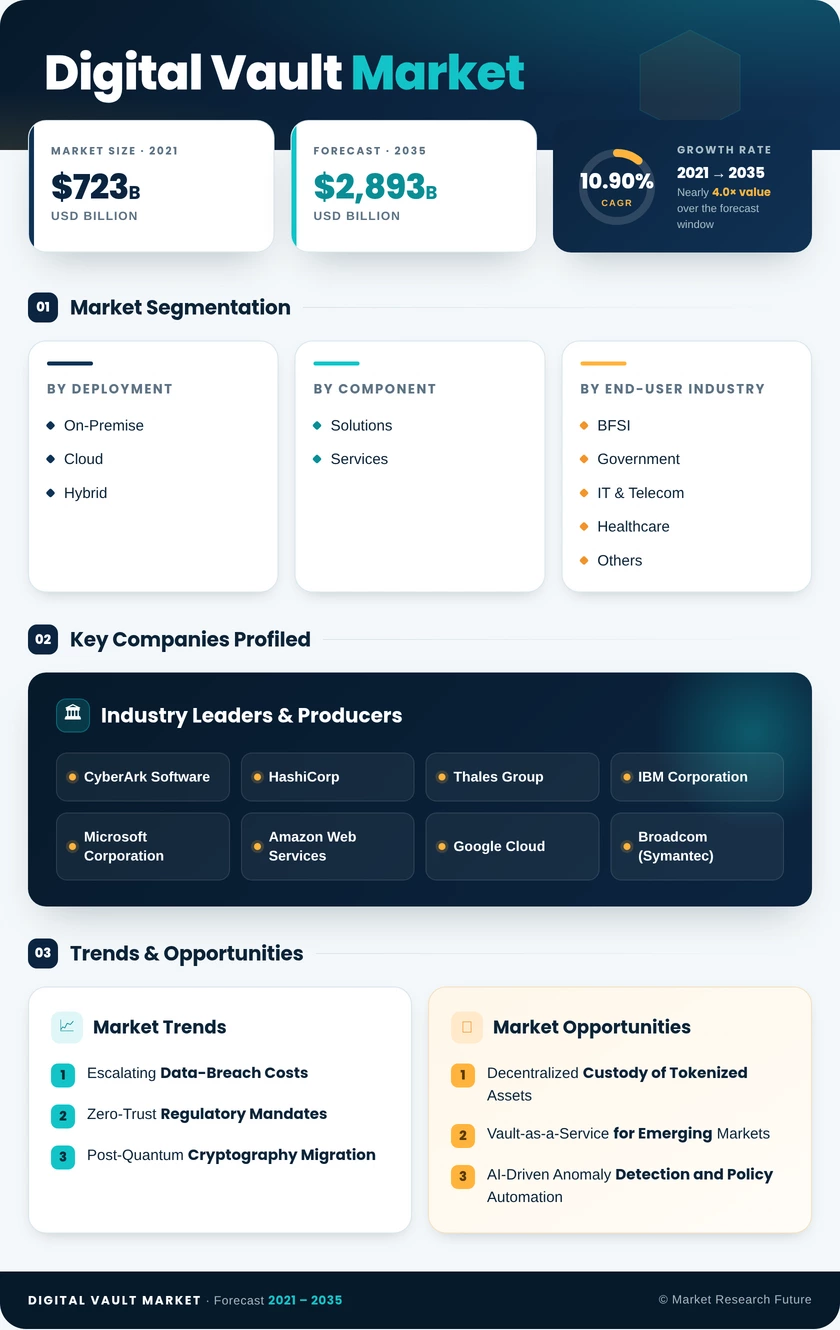
| Deployment | On-Premise, Cloud, Hybrid | Cloud (57.5% share, 2025) | Hybrid (13.20% CAGR) |
| Component | Solutions, Services | Solutions (67.3% share, 2025) | Services (13.00% CAGR) |
| End-User Industry | BFSI, Government, IT & Telecom, Healthcare, Others | BFSI (47.1% share, 2025) | Healthcare (11.80% CAGR) |
| Organization Size | Large Enterprises, Small & Medium Enterprises | Large Enterprises (55.0% share, 2025) | SMEs (13.10% CAGR) |
| Region | North America, Europe, Asia-Pacific, South America, Middle East & Africa | North America (36.8% share, 2025) | Asia-Pacific (13.90% CAGR) |
Market Segmentation Overview
By Deployment
| Sub-Segment | Key Trend |
| On-Premise | Sustained by regulated industries requiring physical key custody and air-gapped vault environments |
| Cloud | Dominant mode driven by hyperscaler-native vault services and consumption-based pricing |
| Hybrid | Fastest-growing model as BFSI and government buyers combine on-premise roots of trust with cloud orchestration |
Cloud deployment continues to capture the majority of new vault contracts as organizations prioritize operational agility and reduced infrastructure overhead. Hybrid configurations are accelerating among enterprises that must satisfy data-residency mandates while leveraging cloud-based policy automation and cross-region secrets replication.
By Component
| Sub-Segment | Key Trend |
| Solutions | Platform suites integrating secrets management, key orchestration, and certificate automation dominate spending |
| Services | Professional services and managed-vault offerings grow as integration complexity rises across multi-cloud estates |
Solutions remain the revenue anchor because buyers increasingly prefer unified platforms over bolt-on point products. The services segment is gaining momentum as vault deployments span legacy mainframes, modern Kubernetes clusters, and AI training pipelines — each requiring specialist integration expertise.
By End-User Industry
| Sub-Segment | Key Trend |
| BFSI | Highest spend driven by overlapping PCI-DSS, SOX, DORA, and Basel III compliance mandates |
| Government | Sovereign-key management and classified-data protection drive large-scale vault procurement |
| IT and Telecommunication | DevOps and CI/CD secrets proliferation fuels adoption across software-driven telecom operators |
| Healthcare | HIPAA audit intensification and IoT medical-device credentialing accelerate vault investments |
| Others | Energy, manufacturing, and retail sectors adopt vaults to protect operational-technology credentials |
BFSI leads due to the sheer density of compliance obligations that require cryptographic key governance. Healthcare is the fastest-growing vertical as electronic health record systems, connected medical devices, and e-prescribing networks all demand centralized credential lifecycle management at enterprise scale.
By Organization Size
| Sub-Segment | Key Trend |
| Large Enterprises | Complex multi-cloud and legacy estates generate millions of secrets requiring centralized vault management |
| Small and Medium Enterprises | Vault-as-a-service and consumption-based pricing remove historical cost barriers to adoption |
Large enterprises continue to account for the majority of vault spending because their hybrid IT environments produce an exponentially growing inventory of API keys, certificates, and database credentials. SMEs represent the fastest-growing buyer cohort, driven by affordable managed-vault services that eliminate the need for dedicated security operations teams.