Digital Health Market (2026 - 2035)

ID: MRFR/HC/6167-CR 138 Pages Vikita Thakur Last Updated: September 29, 2026
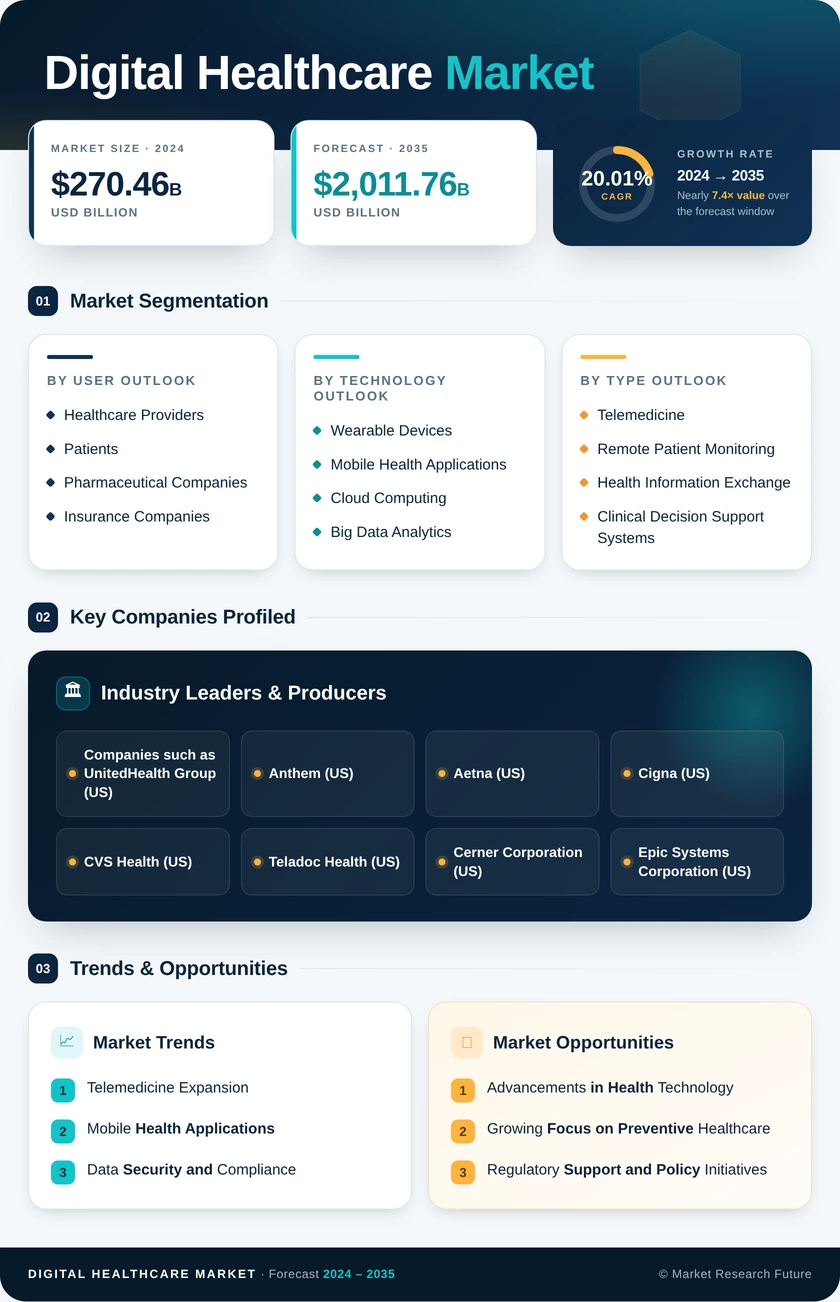
Digital Healthcare Market Research Report By Service Type (Telemedicine, Remote Patient Monitoring, Health Information Exchange, Clinical Decision Support Systems), By Technology (Wearable Devices, Mobile Health Applications, Cloud Computing, Big Data Analytics), By End User (Healthcare Providers, Patients, Pharmaceutical Companies, Insurance Companies), By Delivery Mode (On-Premise, Cloud-Based, Web-Based) and By Regional (North America, Europe, South America, Asia Pacific, Middle East and Africa) - Growth & Industry Forecast 2025 To 2035
Digital Health Market
Market Size
Forecast Period2026-2035
CAGR (2026-2035)16.0%
2025 Market SizeUSD 380.5 Billion
2035 Market SizeUSD 1,690.8 Billion
Key Players
Epic Systems Corporation
Oracle Health
Koninklijke Philips N.V.
GE HealthCare
Siemens Healthineers
Medtronic plc
Opportunities
  • Public Digital Infrastructure in Emerging Markets
  • Real-World Data and Outcome-Based Business Models
  • Reimbursed Prescription Digital Therapeutics
  1. 1 Market Summary | |
  2. 2 Key Report Takeaways | |
    1. 2.1 By Component | |
    2. 2.2 By Technology | |
    3. 2.3 By End User | |
    4. 2.4 By Region | |
  3. 3 Market Size and Forecast (2021–2035) | |
    1. 3.1 Historical Market Size (2021–2025) | |
    2. 3.2 Forecast Market Size (2026–2035) | |
    3. 3.3 Year-over-Year Growth Analysis | |
  4. 4 Driver Impact Analysis | |
    1. 4.1 Expanding Reimbursement for Virtual Care and Remote Monitoring | |
    2. 4.2 AI Integration Across Clinical Workflows | |
    3. 4.3 National Digital Health Infrastructure Programs | |
    4. 4.4 Rising Chronic Disease Burden | |
    5. 4.5 Interoperability and Data Portability Mandates | |
    6. 4.6 Consumer Wearables Gaining Regulated Clinical Features | |
    7. 4.7 Sustained Venture and Strategic Capital | |
  5. 5 Restraints Impact Analysis | |
    1. 5.1 Cybersecurity and Data Breach Exposure | |
    2. 5.2 Reimbursement Policy Uncertainty | |
    3. 5.3 Digital Divide in Connectivity and Literacy | |
    4. 5.4 Fragmented Interoperability and Legacy System Lock-In | |
    5. 5.5 Compliance Burden for AI-Enabled Software | |
  6. 6 Opportunities | |
    1. 6.1 Public Digital Infrastructure in Emerging Markets | |
    2. 6.2 Real-World Data and Outcome-Based Business Models | |
    3. 6.3 Reimbursed Prescription Digital Therapeutics | |
    4. 6.4 Ambient AI Documentation | |
    5. 6.5 Hospital-at-Home and Virtual Wards | |
  7. 7 Regional Market Share and Country-Level Analysis | |
    1. 7.1 North America | | |
      1. 7.1.1 United States | | |
      2. 7.1.2 Canada | | |
      3. 7.1.3 Mexico | |
    2. 7.2 Europe | | |
      1. 7.2.1 Germany | | |
      2. 7.2.2 United Kingdom | | |
      3. 7.2.3 France | | |
      4. 7.2.4 Italy | | |
      5. 7.2.5 Spain | | |
      6. 7.2.6 Rest of Europe | |
    3. 7.3 Asia-Pacific | | |
      1. 7.3.1 China | | |
      2. 7.3.2 Japan | | |
      3. 7.3.3 India | | |
      4. 7.3.4 South Korea | | |
      5. 7.3.5 Australia | | |
      6. 7.3.6 Rest of Asia-Pacific | |
    4. 7.4 South America | | |
      1. 7.4.1 Brazil | | |
      2. 7.4.2 Argentina | | |
      3. 7.4.3 Rest of South America | |
    5. 7.5 Middle East & Africa | | |
      1. 7.5.1 GCC Countries | | |
      2. 7.5.2 South Africa | | |
      3. 7.5.3 Rest of Middle East & Africa | |
  8. 8 Future Outlook (2026–2035) | |
    1. 8.1 AI-Native Care Delivery | |
    2. 8.2 Platform Consolidation and Ecosystem Economics | |
    3. 8.3 Continuous Sensing and Decentralized Care | |
    4. 8.4 Data Sovereignty, Trust, and Governance | |
  9. 9 Segmentation Analysis | |
    1. 9.1 By Component | | |
      1. 9.1.1 Hardware | | |
      2. 9.1.2 Software | | |
      3. 9.1.3 Services | |
    2. 9.2 By Technology | | |
      1. 9.2.1 Telehealth | | |
      2. 9.2.2 mHealth | | |
      3. 9.2.3 Healthcare Analytics | | |
      4. 9.2.4 Digital Health Systems | |
    3. 9.3 By End User | | |
      1. 9.3.1 Healthcare Providers | | |
      2. 9.3.2 Payers | | |
      3. 9.3.3 Patients & Consumers | |
  10. 10 Competitive Landscape | |
    1. 10.1 Market Concentration Analysis | |
    2. 10.2 Competitive Benchmarking Matrix | |
    3. 10.3 Company Profiles | | |
      1. 10.3.1 Epic Systems Corporation | | |
      2. 10.3.2 Oracle Health (Oracle Corporation) | | |
      3. 10.3.3 Koninklijke Philips N.V. | | |
      4. 10.3.4 GE HealthCare | | |
      5. 10.3.5 Siemens Healthineers | | |
      6. 10.3.6 Medtronic plc | | |
      7. 10.3.7 Apple Inc. | | |
      8. 10.3.8 Microsoft Corporation (Nuance) | | |
      9. 10.3.9 Teladoc Health, Inc. | | |
      10. 10.3.10 Dexcom, Inc. | |
  11. 11 Recent News & Developments | |
  12. 12 Report Scope and Methodology | |
  13. 13 Detailed Sources and Citations | |
  14. 14 Frequently Asked Questions (FAQs) | | LIST OF TABLES | |
  15. TABLE 1 Global Market Snapshot, 2025–2035 | |
  16. TABLE 2 Global Market Size & Forecast, by Revenue (USD Billion), 2021–2035 | |
  17. TABLE 3 Driver Impact Analysis, 2026–2035 | |
  18. TABLE 4 Restraints Impact Analysis, 2026–2035 | |
  19. TABLE 5 Regional Summary, 2025 | |
  20. TABLE 6 North America Market, by Country, 2025 | |
  21. TABLE 7 Europe Market, by Country, 2025 | |
  22. TABLE 8 Asia-Pacific Market, by Country, 2025 | |
  23. TABLE 9 South America Market, by Country, 2025 | |
  24. TABLE 10 Middle East & Africa Market, by Country, 2025 | |
  25. TABLE 11 Global Market, by Component, 2025–2035 | |
  26. TABLE 12 Global Market, by Technology, 2025–2035 | |
  27. TABLE 13 Global Market, by End User, 2025–2035 | |
  28. TABLE 14 Competitive Benchmarking Matrix, 2025 | |
  29. TABLE 15 Report Scope and Methodology | |
  30. TABLE 16 Detailed Sources and Citations | |
  31. TABLE 17 Segmentation Quick Reference | |
  32. TABLE 18 Market Segmentation Overview, by Component | |
  33. TABLE 19 Market Segmentation Overview, by Technology | |
  34. TABLE 20 Market Segmentation Overview, by End User | | LIST OF FIGURES | |
  35. FIGURE 1 Market Dynamics Overview (Drivers, Restraints, Opportunities) | |
  36. FIGURE 2 Industry Value Chain Analysis | |
  37. FIGURE 3 Porter's Five Forces Analysis | |
  38. FIGURE 4 Global Market Size Trend, 2021–2035 (USD Billion) | |
  39. FIGURE 5 Year-over-Year Growth Rate, 2021–2035 | |
  40. FIGURE 6 Market Share, by Component, 2025 | |
  41. FIGURE 7 Market Share, by Technology, 2025 | |
  42. FIGURE 8 Market Share, by End User, 2025 | |
  43. FIGURE 9 Regional Market Share, 2025 | |
  44. FIGURE 10 Regional Growth Comparison, 2026–2035 | |
  45. FIGURE 11 North America Country Share, 2025 | |
  46. FIGURE 12 Asia-Pacific Country Share, 2025 | |
  47. FIGURE 13 Competitive Landscape Positioning Matrix | |
  48. FIGURE 14 Estimated Revenue Share Ranges of Key Players, 2025

Segmentation Quick Reference

DimensionSub-SegmentsDominant SegmentFastest Growing Segment
By ComponentHardware, Software, ServicesServices (41.3% share)Software (16.6% CAGR)
By TechnologyTelehealth, mHealth, Healthcare Analytics, Digital Health SystemsTelehealth (50.2% share)mHealth (16.5% CAGR)
By End UserHealthcare Providers, Payers, Patients & ConsumersPatients & Consumers (45.4% share)Payers (16.3% CAGR)
By RegionNorth America, Europe, Asia-Pacific, South America, Middle East & AfricaNorth America (38.9% share)Asia-Pacific (18.3% CAGR)


Market Segmentation Overview

By Component

Sub-SegmentKey Trend
HardwareConnected monitors and regulated wearables increasingly bundled with software subscriptions.
SoftwareCloud-native platforms with modular APIs and embedded AI replacing one-time licenses
ServicesImplementation, integration, and managed security outsourced by talent-constrained health systems


Services lead the component mix with a 41.3% share because hospitals lack the informatics and security staff to deploy complex platforms alone. Software grows fastest at a 16.6% CAGR, as subscription cloud products scale across mid-size providers without heavy on-site installation. Hardware remains essential for data capture but is shifting toward device-plus-service bundles priced per patient per month.

By Technology

Sub-SegmentKey Trend
TelehealthVirtual visits and remote specialist consults sustained by permanent and extended reimbursement codes
mHealthPhone-based sensing, AI coaching, and app-delivered therapy moving into payer-funded programs
Healthcare AnalyticsRisk prediction and care-gap detection embedded in payer and provider workflows
Digital Health SystemsEHR modernization and e-prescribing aligned with interoperability mandates


Telehealth leads with a 50.2% share, supported by durable reimbursement for video visits and remote monitoring. mHealth grows fastest at a 16.5% CAGR as smartphones gain sensing and coaching capability and regulators create reimbursement routes for prescription apps. Healthcare Analytics and Digital Health Systems act as the data layer that makes both telehealth and mHealth clinically actionable.

By End User

Sub-SegmentKey Trend
Healthcare ProvidersAmbient documentation and virtual care deployed to relieve workforce pressure
PayersDigital front doors, remote monitoring kits, and outcome-linked vendor contracts
Patients & ConsumersSelf-tracking, OTC biosensors, and direct-to-consumer virtual services


Patients & Consumers hold the largest 45.4% share, reflecting mass adoption of wearables, self-ordered testing, and app-based care. Payers grow fastest at a 16.3% CAGR because remote monitoring and adherence programs reduce avoidable claims under value-based contracts. Healthcare Providers remain the largest institutional buyers, focusing spend on tools that recover clinician time.

just now

Download PDF ×

We do not share your information with anyone. However, we may send you emails based on your report interest from time to time. You may contact us at any time to opt-out.