Dental Services Market (2026 - 2035)

ID: MRFR/HC/10761-HCR 135 Pages Vikita Thakur Last Updated: September 15, 2026
Dental Services Market Research Report: Size, Share, Trend Analysis By Service Type (Preventive Services, Restorative Services, Orthodontic Services, Cosmetic Dentistry, Oral Surgery), By End Users (Individuals, Institutions, Dental Clinics, Hospitals), By Insurance Coverage (Private Insurance, Public Insurance, Out-of-Pocket Payment), By Age Group (Children, Adults, Elderly) and By Regional (North America, Europe, South America, Asia Pacific, Middle East and Africa) - Growth Outlook & Industry Forecast 2025 To 2035
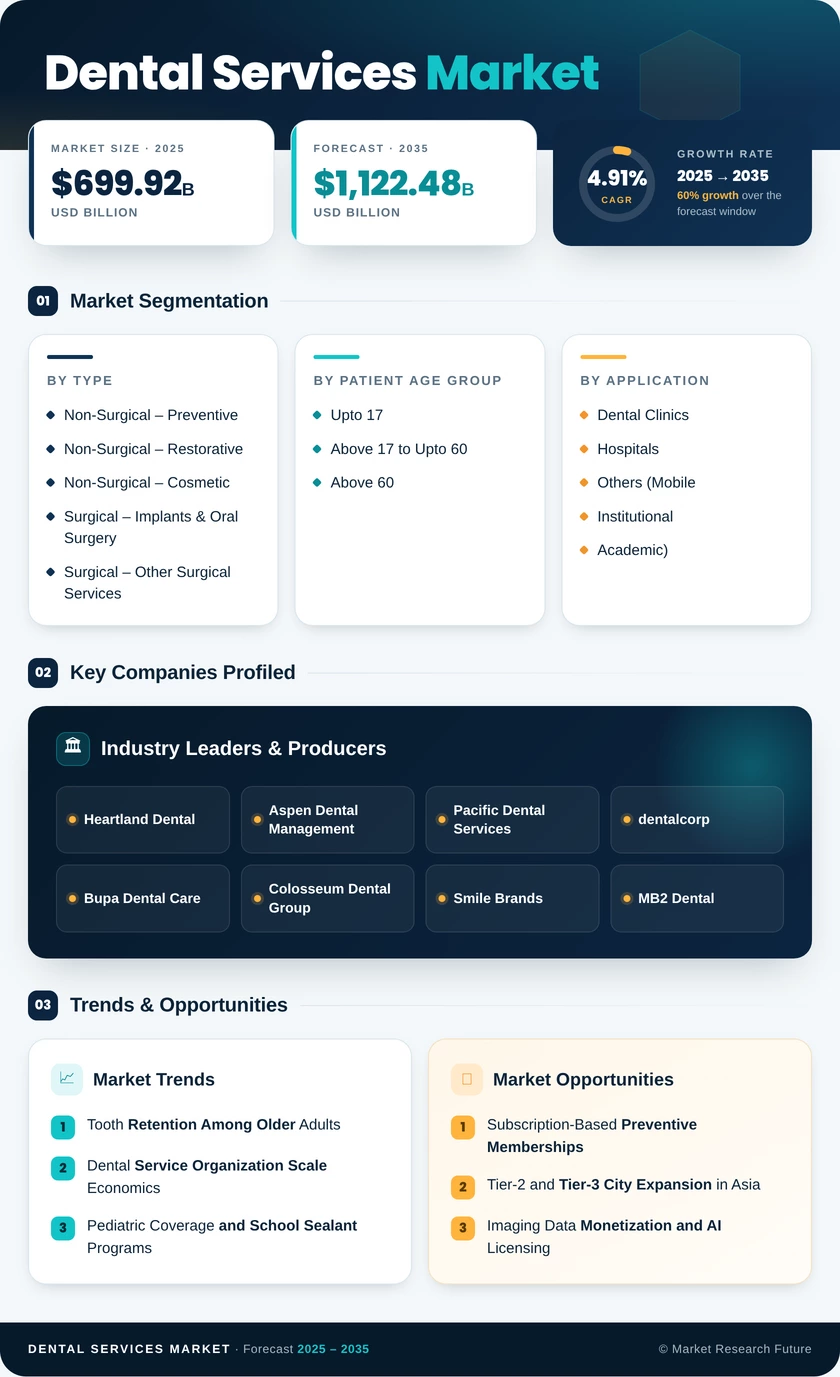
Dental Services Market
Market Size
Forecast Period2026-2035
CAGR (2026-2035)4.91%
2025 Market SizeUSD 699.92 Billion
2035 Market SizeUSD 1,122.48 Billion
Key Players
Heartland Dental
Aspen Dental Management
Pacific Dental Services
dentalcorp
Bupa Dental Care
Colosseum Dental Group
Opportunities
  • Subscription-Based Preventive Memberships
  • Tier-2 and Tier-3 City Expansion in Asia
  • Imaging Data Monetization and AI Licensing
  1. 1 Market Summary |
    1. 1.1 Study Assumptions & Market Definition |
    2. 1.2 Scope of the Study |
    3. 1.3 Research Methodology
  2. 2 Key Report Takeaways |
    1. 2.1 By Service Type |
    2. 2.2 By Patient Age Group |
    3. 2.3 By Geography
  3. 3 Market Size & Forecast (2021–2035) |
    1. 3.1 Historical Market Size (2021–2024) |
    2. 3.2 Base Year Estimate (2025) |
    3. 3.3 Forecast Market Size (2026–2035) |
    4. 3.4 Year-over-Year Growth Analysis
  4. 4 Driver Impact Analysis |
    1. 4.1 Tooth Retention Among Older Adults |
    2. 4.2 Dental Service Organization Scale Economics |
    3. 4.3 Pediatric Coverage and School Sealant Programs |
    4. 4.4 Digital Workflow Adoption |
    5. 4.5 Clear-Aligner Demand Expansion
  5. 5 Restraints Impact Analysis |
    1. 5.1 Clinical Workforce Scarcity |
    2. 5.2 Payer Fee Schedule Compression |
    3. 5.3 Input Cost and Supply Volatility |
    4. 5.4 Cybersecurity and Data-Breach Exposure
  6. 6 Opportunities |
    1. 6.1 Subscription-Based Preventive Memberships |
    2. 6.2 Tier-2 and Tier-3 City Expansion in Asia |
    3. 6.3 Imaging Data Monetization and AI Licensing |
    4. 6.4 Value-Based Contracting with Medical Payers |
    5. 6.5 Gulf Cooperation Council Capacity Build-Out |
    6. 6.6 Industry Value Chain Analysis |
    7. 6.7 Porter's Five Forces Analysis
  7. 7 Regional Market Share & Country-Level Analysis |
    1. 7.1 North America | |
      1. 7.1.1 US | |
      2. 7.1.2 Canada | |
      3. 7.1.3 Mexico |
    2. 7.2 Europe | |
      1. 7.2.1 Germany | |
      2. 7.2.2 UK | |
      3. 7.2.3 France | |
      4. 7.2.4 Italy | |
      5. 7.2.5 Spain | |
      6. 7.2.6 Nordic Countries | |
      7. 7.2.7 Russia | |
      8. 7.2.8 Rest of Europe |
    3. 7.3 Asia-Pacific | |
      1. 7.3.1 China | |
      2. 7.3.2 India | |
      3. 7.3.3 Japan | |
      4. 7.3.4 South Korea | |
      5. 7.3.5 ASEAN | |
      6. 7.3.6 Rest of Asia-Pacific |
    4. 7.4 South America | |
      1. 7.4.1 Brazil | |
      2. 7.4.2 Argentina | |
      3. 7.4.3 Rest of South America |
    5. 7.5 Middle East & Africa | |
      1. 7.5.1 Saudi Arabia | |
      2. 7.5.2 UAE | |
      3. 7.5.3 South Africa | |
      4. 7.5.4 Egypt | |
      5. 7.5.5 Rest of Middle East & Africa
  8. 8 Future Outlook (2026–2035) |
    1. 8.1 Algorithmic Diagnosis Becomes Standard of Care |
    2. 8.2 Platform Economics and the DSO Endgame |
    3. 8.3 Prevention Repriced by Medical Cost Avoidance |
    4. 8.4 Sustainability and Single-Use Reduction
  9. 9 Market Segmentation Analysis |
    1. 9.1 By Service Type | |
      1. 9.1.1 Non-Surgical Services – Preventive | |
      2. 9.1.2 Non-Surgical Services – Restorative | |
      3. 9.1.3 Non-Surgical Services – Cosmetic | |
      4. 9.1.4 Surgical Services – Implants & Oral Surgery | |
      5. 9.1.5 Surgical Services – Other Surgical Services |
    2. 9.2 By Patient Age Group | |
      1. 9.2.1 Upto 17 | |
      2. 9.2.2 Above 17 To Upto 60 | |
      3. 9.2.3 Above 60 |
    3. 9.3 By End-User | |
      1. 9.3.1 Dental Clinics | |
      2. 9.3.2 Hospitals | |
      3. 9.3.3 Others (Mobile, Institutional, Academic)
  10. 10 Competitive Landscape |
    1. 10.1 Market Concentration Analysis (2026) |
    2. 10.2 Competitive Benchmarking Matrix |
    3. 10.3 Company Profiles | |
      1. 10.3.1 Heartland Dental | |
      2. 10.3.2 Aspen Dental Management | |
      3. 10.3.3 Pacific Dental Services | |
      4. 10.3.4 dentalcorp | |
      5. 10.3.5 Bupa Dental Care | |
      6. 10.3.6 Colosseum Dental Group | |
      7. 10.3.7 Smile Brands | |
      8. 10.3.8 MB2 Dental | |
      9. 10.3.9 Q&M Dental Group | |
      10. 10.3.10 Apollo White Dental | |
      11. 10.3.11 Dental Care Alliance
  11. 11 Recent News & Developments
  12. 12 Report Scope & Methodology |
    1. 12.1 Study Period & Base Year |
    2. 12.2 Estimation Approach |
    3. 12.3 Abbreviations
  13. 13 Detailed Sources & Citations
  14. 14 Frequently Asked Questions
  15. 15 LIST OF TABLES |
  16. TABLE 1 Global Dental Services Market Size & Forecast, by Revenue (USD Billion), 2021–2035 |
  17. TABLE 2 Global Dental Services Market – Year-over-Year Growth Analysis, 2021–2035 |
  18. TABLE 3 Driver Impact Analysis – Weighting, Geographic Relevance & Timeline |
  19. TABLE 4 Restraint Impact Analysis – Weighting, Geographic Relevance & Timeline |
  20. TABLE 5 Global Dental Services Market Size, by Region, 2021–2035 (USD Billion) |
  21. TABLE 6 North America Dental Services Market Size, by Country, 2021–2035 (USD Billion) |
  22. TABLE 7 Europe Dental Services Market Size, by Country, 2021–2035 (USD Billion) |
  23. TABLE 8 Asia-Pacific Dental Services Market Size, by Country, 2021–2035 (USD Billion) |
  24. TABLE 9 South America Dental Services Market Size, by Country, 2021–2035 (USD Billion) |
  25. TABLE 10 Middle East & Africa Dental Services Market Size, by Country, 2021–2035 (USD Billion) |
  26. TABLE 11 Global Dental Services Market Size, by Service Type, 2021–2035 (USD Billion) |
  27. TABLE 12 Global Dental Services Market Size, by Patient Age Group, 2021–2035 (USD Billion) |
  28. TABLE 13 Global Dental Services Market Size, by End-User, 2021–2035 (USD Billion) |
  29. TABLE 14 North America Dental Services Market Size, by Service Type, 2021–2035 (USD Billion) |
  30. TABLE 15 Europe Dental Services Market Size, by Service Type, 2021–2035 (USD Billion) |
  31. TABLE 16 Asia-Pacific Dental Services Market Size, by Service Type, 2021–2035 (USD Billion) |
  32. TABLE 17 South America Dental Services Market Size, by End-User, 2021–2035 (USD Billion) |
  33. TABLE 18 Middle East & Africa Dental Services Market Size, by End-User, 2021–2035 (USD Billion) |
  34. TABLE 19 Competitive Benchmarking Matrix – Global Dental Services Market, 2026 |
  35. TABLE 20 Company Profiles – Key Players, Global Dental Services Market |
  36. TABLE 21 Recent Developments & Strategic Announcements, 2023–2025 |
  37. TABLE 22 Report Scope & Methodology Summary |
  38. TABLE 23 Detailed Sources & Citations Index
  39. 16 LIST OF FIGURES |
  40. FIGURE 1 Global Dental Services Market Dynamics – Drivers, Restraints & Opportunities |
  41. FIGURE 2 Industry Value Chain Analysis – Dental Care Delivery |
  42. FIGURE 3 Porter's Five Forces Analysis |
  43. FIGURE 4 Global Market Size Trend Line, 2021–2035 (USD Billion) |
  44. FIGURE 5 Year-over-Year Growth Curve, 2022–2035 (%) |
  45. FIGURE 6 Market Share by Service Type, 2025 vs 2035 (%) |
  46. FIGURE 7 Market Share by Patient Age Group, 2025 (%) |
  47. FIGURE 8 Market Share by End-User, 2025 vs 2035 (%) |
  48. FIGURE 9 Regional Revenue Share Distribution, 2025 (%) |
  49. FIGURE 10 Regional CAGR Comparison, 2026–2035 (%) |
  50. FIGURE 11 Country-Level Revenue Heat Map, 2025 |
  51. FIGURE 12 Competitive Landscape – Estimated Revenue Share Bands, 2026 |
  52. FIGURE 13 Market Concentration Trend – HHI Trajectory, 2021–2035 |
  53. FIGURE 14 Digital Workflow Adoption Curve by Region, 2021–2035

Segmentation Quick Reference

DimensionSub-SegmentsDominant SegmentFastest Growing Segment
By Service TypeNon-Surgical Services (Preventive, Restorative, Cosmetic); Surgical Services (Implants & Oral Surgery, Other Surgical Services)Surgical Services – Implants & Oral SurgeryNon-Surgical Services – Cosmetic
By Patient Age GroupUpto 17; Above 17 To Upto 60; Above 60Above 17 To Upto 60Upto 17
By End-UserDental Clinics; Hospitals; Others (Mobile, Institutional, Academic)Dental ClinicsDental Clinics
By GeographyNorth America; Europe; Asia-Pacific; South America; Middle East & AfricaNorth AmericaAsia-Pacific


Market Segmentation Overview

By Service Type

Sub-SegmentKey Trend
Non-Surgical – PreventiveMembership plans converting episodic patients into recurring recall panels
Non-Surgical – RestorativeComposite and ceramic substitution accelerating under amalgam phase-down rules
Non-Surgical – CosmeticWhitening and veneer demand broadening beyond high-income cohorts
Surgical – Implants & Oral SurgeryGuided surgery and immediate-load protocols shortening treatment timelines
Surgical – Other Surgical ServicesPeriodontal and third-molar volumes stable with modest price escalation


Service mix determines practice profitability more than patient count. Groups engineering a heavier surgical and cosmetic blend consistently outperform hygiene-weighted peers on EBITDA margin, though they carry higher clinician recruitment risk.

By Patient Age Group

Sub-SegmentKey Trend
Upto 17Public sealant and screening programs widening the covered pediatric base
Above 17 To Upto 60Adult orthodontics and elective aesthetics driving self-pay revenue
Above 60Rising dentition retention sustaining lifelong maintenance demand


Age cohorts map cleanly onto payment sources: pediatric care is largely publicly funded, working-age care blends insurance with cash, and senior care skews toward high-value prosthetic work with variable coverage depth.

By End-User

Sub-SegmentKey Trend
Dental ClinicsConsolidation into supported networks with centralized procurement
HospitalsConcentration on maxillofacial, oncology-adjacent, and anesthesia-dependent cases
Others (Mobile, Institutional, Academic)Expanding role in underserved and long-term-care outreach


Setting choice follows clinical acuity and payer rules rather than patient preference. Clinics will retain the overwhelming majority of episodes, while hospitals defend a small, high-complexity, high-reimbursement niche.

By Geography

Sub-SegmentKey Trend
North AmericaDSO penetration deepening; Canadian federal coverage enlarging the insured base
EuropeStatutory reform reshaping prosthetic pricing; private conversion accelerating in the UK
Asia-PacificProcurement reform expanding implant volumes; chains moving into secondary cities
South AmericaInstallment financing sustaining elective demand through currency volatility
Middle East & AfricaMandatory insurance schemes and licensing waves building formal capacity


Regional divergence is widening rather than converging. Coverage architecture, not GDP per capita, best predicts which national markets deliver steady compounding versus episodic surges.




Download PDF ×

We do not share your information with anyone. However, we may send you emails based on your report interest from time to time. You may contact us at any time to opt-out.