Dental Chair Market

Key Players: Danaher Corporation (KaVo Kerr), Dentsply Sirona, Planmeca Group, A-dec Inc., Midmark Corporation, Takara Belmont, DentalEZ Group, Pelton & Crane

Dental Chair Market

Dental Chair Market Size, Growth Research Report By Product Type (Electromechanical Dental Chairs, Hydraulic Dental Chairs, Manual Dental Chairs, Adjustable Dental Chairs), By End User (Dental Clinics, Hospitals, Research Institutions, Mobile Dental Units), By Application (General Dentistry, Orthodontics, Oral Surgery, Periodontics), By Features (Ergonomic Design, Integrated Technology, Adjustable Height, Easy Clean Surface) and By Regional (North America, Europe, South America, Asia Pacific, Middle East and Africa) - Competitor Industry Analysis and Trends Forecast Till 2035
ID: MRFR/MED/7267-HCR
200 Pages
Satyendra Maurya, Rahul Gotadki
Last Updated: June 24, 2026

Dental Chair Market Summary

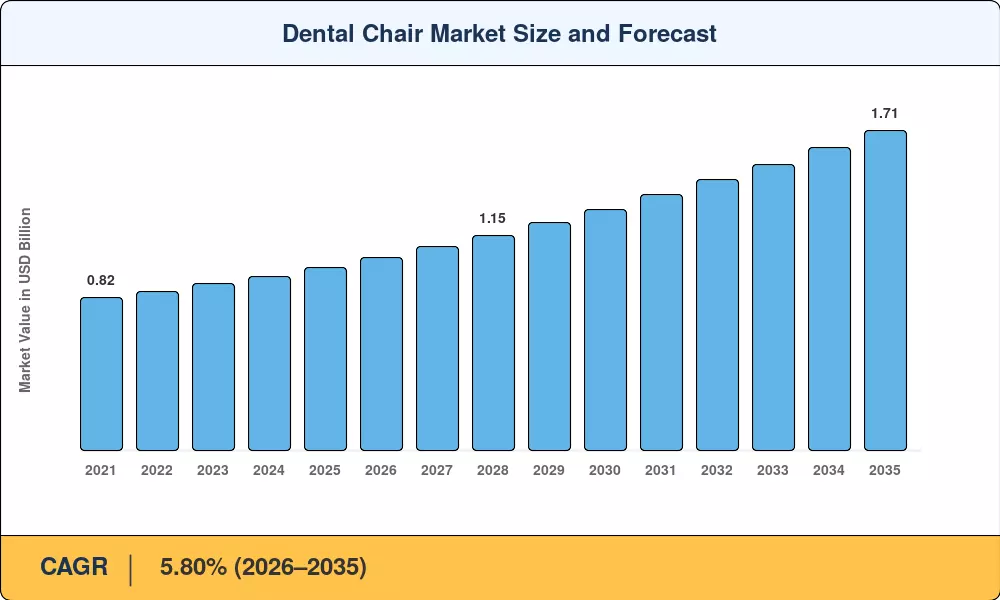
The Global Dental Chair Market size was valued at USD 0.98 Billion in 2025, and the market is projected to grow from USD 1.03 Billion in 2026 to USD 1.71 Billion by 2035, registering a CAGR of 5.80% during the forecast period 2026–2035. Practice consolidation among dental service organizations (DSOs) and tightening infection-control mandates from bodies like the FDA and CE-marking authorities are the two catalysts compressing replacement cycles and pulling premium units into the mainstream. Vendor-backed leasing structures now cover roughly 40% of new installations in North America, lowering upfront capital barriers for solo and group practices alike [1].

Technology in the Dental Chair Market is shifting from basic hydraulic platforms to fully electric, CAD/CAM-integrated operatory systems capable of real-time patient data capture. The American Dental Association estimates that practices investing in digitally connected treatment units report a 12–15% improvement in average procedure throughput [2]. Legacy pneumatic units still account for a significant installed base, but their share of new shipments has fallen below 20% as buyers prioritize programmable memory positioning and touchscreen interfaces.

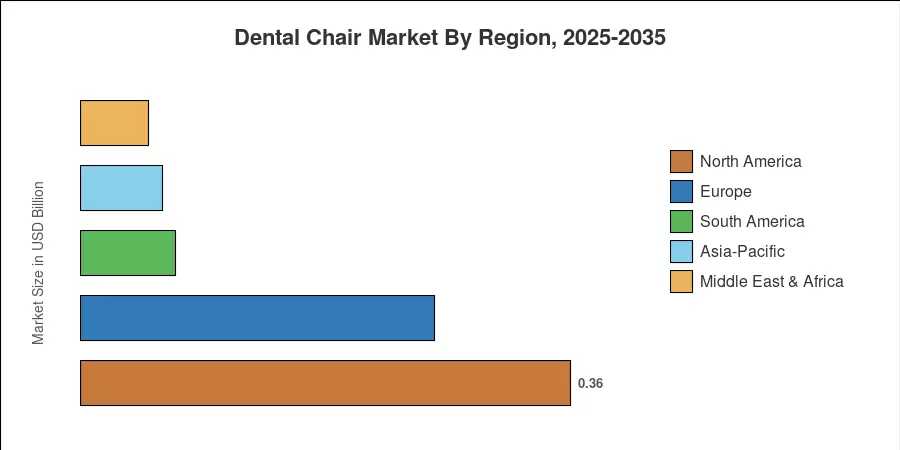
North America remains the dominant region in the Dental Chair Market, holding 36.40% of global revenue in 2025, driven by DSO expansion and strict sterilization protocols. Asia-Pacific is the fastest-growing region, fueled by public oral-health funding programs in China and India. Europe holds the second-largest share at approximately 27%, led by Germany and Nordic countries, upgrading aging clinic infrastructure. The Dental Chair Market trajectory over the next decade will hinge on how quickly integrated digital workflows replace standalone units worldwide.


Key Report Takeaways

• By Design

  • Chair-mounted systems commanded 41.30% of the global Dental Chair Market revenue in 2025, reflecting embedded-instrument preferences among DSO networks.
  • Mobile-independent units are the fastest-growing design segment, projected to expand at a 6.80% CAGR through 2035.

• By Product Type

  • Powered chairs accounted for 60.80% of the Dental Chair Market in 2025 as electric-drive adoption accelerates.
  • Non-powered chairs continue to serve budget-sensitive rural clinics, though their share is declining steadily.

• By End User

  • Dental clinics maintained 53.10% share of the Dental Chair Market in 2025.
  • Ambulatory surgery centers register the highest end-user CAGR at 7.75% through 2035.

• By Region

  • North America led the Dental Chair Market with 36.40% share in 2025, while Asia-Pacific is poised for the fastest expansion.
  • Europe accounted for approximately USD 0.26 Billion in 2025 revenue.


Market Size and Forecast (2021–2035)

Market Research Future constructed this forecast using a triangulated approach combining bottom-up revenue estimates from 120+ dental equipment manufacturers, top-down validation against healthcare capital expenditure databases, and demand-side modeling from national dental visit statistics across 42 countries. Historical figures reflect actual shipment data, while forecast values apply a compound annual growth rate calibrated against macroeconomic dental spending trajectories.

Dental Chair Market Size and Forecast
Our Impact
Enabled $4.3B Revenue Impact for Fortune 500 and Leading Multinationals
Partnering with 2000+ Global Organizations Each Year
30K+ Citations by Top-Tier Firms in the Industry

Driver Impact Analysis

Driver ~% Impact on CAGR Geographic Relevance Impact Timeline
DSO consolidation and bulk procurement contracts +0.9% North America, Europe Short-term (≤2 yr)
An aging global population requiring complex oral care +0.7% Global Long-term (≥4 yr)
Infection-control regulatory tightening +0.6% North America, EU Medium-term (2–4 yr)
Digitization and CAD/CAM chair integration +0.8% Global Medium-term (2–4 yr)
Public oral-health programs in emerging markets +0.5% Asia-Pacific, South America Long-term (≥4 yr)
Vendor-backed leasing and financing models +0.4% North America, Europe Short-term (≤2 yr)
Tele-dentistry infrastructure requiring connected chairs +0.3% Global Long-term (≥4 yr)


DSO Consolidation and Bulk Procurement

Dental service organizations now operate over 10,000 practice locations across the United States alone, and their purchasing model has shifted the Dental Chair Market toward standardized, network-wide replacement schedules. This bulk-buy cycle compresses the average replacement interval from 12 years to roughly 8 years, directly lifting annual demand.

Aging Population and Complex Oral Care Needs

The World Health Organisation estimates that by 2050, there will be 2.1 billion people aged over 60. This group is responsible for disproportionately complex procedures – implants, full-arch restorations, and long surgical procedures – that require chairs with extended recline, programmable position memory, and integrated suction [11]. Japan, Germany, and Italy already have 30%+ dental visits ascribed to patients >65 years old, which accelerates the Dental Chair Market upgrade cycle for chairs intended to accommodate two hours plus treatment windows.


Infection-Control Regulatory Mandates

In the EU, Medical Device Regulation 2017/745 enforcement timelines are pushing practices to replace non-compliant legacy chairs before 2028 [9]. These regulatory clocks create a predictable replacement wave across the Dental Chair Market.

Digitization and CAD/CAM Integration

Modern powered dental chairs increasingly ship with factory-installed USB ports, intraoral camera mounts, and fiber-optic connections that link directly to CAD/CAM milling units. This performance gain is converting skeptics, especially in multi-provider DSO settings where chair utilization rate is a key financial metric for the Dental Chair Market.


Restraints Impact Analysis

The restraint impacts below represent estimated headwinds against the baseline CAGR. These are directional assessments and should not be subtracted linearly from the growth rate.

Restraint ~% Impact on CAGR Geographic Relevance Impact Timeline
High upfront capital cost for premium units −0.5% Global Short-term (≤2 yr)
Fragmented regulatory standards across regions −0.3% Asia-Pacific, MEA Medium-term (2–4 yr)
Skilled technician shortage for servicing −0.3% Emerging markets Long-term (≥4 yr)
Refurbished chair competition −0.2% North America, Europe Short-term (≤2 yr)
Slow adoption in rural and underserved areas −0.2% South America, Africa Long-term (≥4 yr)


High Capital Cost Barrier

However, the cost of a fully equipped powered dental chair with integrated delivery systems, ranging from USD 15,000 to USD 45,000 per unit, is still prohibitive for independent practitioners in price-sensitive locations [14]. Monthly lease expenses of $600–900 per chair, even with vendor-backed financing, can eat up 8–12% of a solo practice’s net revenue. This pricing structure hinders the rate of adoption of sophisticated units in the Dental Chair market outside integrated DSO networks.


Refurbished Equipment Competition

In 2024, refurbished equipment procured from practice closures and DSO fleet rotations made up around 18% of dental chair installations in North America [17]. Some companies, such as Dental Planet and Quality Dental Equipment, now sell factory-certified refurbished chairs at a price 40–55% lower than a new unit, directly cannibalizing demand for entry-level new chairs in the Dental Chair Market. The secondary market grows in line with the replacement cycle of the primary market, creating a constant drain on new unit revenues.


Dental Chair Market Opportunities

Smart Chair IoT Connectivity

The convergence of IoT sensors with dental chair platforms presents a significant opportunity for the Dental Chair Market. Chairs equipped with occupancy sensors, real-time tilt monitoring, and predictive maintenance alerts can reduce unplanned downtime. Practices adopting connected chairs gain visibility into utilization rates that directly inform capacity planning and staffing decisions.

Subscription-Based Equipment-as-a-Service Models

Equipment-as-a-Service (EaaS) is emerging as a disruptive business model that bundles the chair, maintenance, software updates, and infection-control compliance into a single monthly fee [20]. For the Dental Chair Market, this model shifts revenue recognition from lumpy capital sales to predictable recurring streams, while lowering the barrier for new practice openings.

Emerging Market Expansion Through Public Health Programs

Under the Ayushman Bharat scheme in India and the Healthy China 2030 scheme in China, special funds are being allocated for basic oral healthcare infrastructure in rural regions that will create over 50,000 new dental operatory sets by 2030 [12]. These government-sponsored programs provide a valuable opportunity for mid-range chairs in the Dental Chair Market.


Tele-Dentistry-Ready Chair Platforms

As tele-dentistry consultations grew 380% between 2020 and 2024, demand for chairs with built-in high-definition cameras, LED lighting arrays, and secure video-streaming capability is rising [13]. Chair manufacturers that integrate tele-consultation hardware at the factory level can capture a premium positioning in the Dental Chair Market.

Data Monetization from Chair Usage Analytics

Aggregated, anonymized chair utilization data — procedure duration patterns, ergonomic positioning preferences, equipment wear cycles — holds value for insurers, dental schools, and workflow software vendors [21]. Manufacturers who build data platforms atop their installed base can unlock recurring revenue beyond hardware sales, a frontier opportunity for the Dental Chair Market.


Dental Chair Market Future Outlook

AI-Integrated Diagnostic Chair Platforms

By 2030, dental chairs will function less as passive seating and more as AI-enabled diagnostic stations. Embedded intraoral sensors feeding real-time data to machine-learning algorithms can flag early caries, periodontal pockets, and occlusal irregularities during routine cleanings. The Dental Chair Market stands to capture a meaningful share as OEMs integrate diagnostic AI directly into chair-mounted delivery systems.

Sustainability and Circular Manufacturing

Environmental, social, and governance (ESG) reporting requirements are pushing dental equipment OEMs toward circular-economy models. The Dental Chair Market will see increasing differentiation on lifecycle carbon footprint, with buyers — particularly European DSOs subject to CSRD reporting — factoring environmental credentials into procurement decisions.

Platform Economics and Connected Ecosystems

In the next decade, dental chair OEMs will shift from selling discrete hardware to managing platform ecosystems that combine the chair with imaging software, practice management integration, and consumables replenishment. A-dec, Planmeca, and Dentsply Sirona are working on cloud-connected chair platforms that produce ongoing SaaS revenue on top of hardware sales [19]. The platform transition is changing the competitive dynamics in the Dental Chair Market in favour of vendors with strong software skills.


Emerging Market Infrastructure Buildout

The World Health Organization's Global Oral Health Action Plan (2023–2030) targets integration of oral health into universal health coverage packages across 120 member states [28]. This policy framework is catalyzing public investment in dental infrastructure across Sub-Saharan Africa, Southeast Asia, and South America. For the Dental Chair Market, these markets represent greenfield volume opportunities where mid-tier powered chairs will dominate procurement.


Dental Chair Market Segmentation

By Design

Segment Metric Primary Demand Driver
Chair-Mounted Systems 41.30% share (2025) DSO standardization of integrated delivery
Ceiling-Mounted Systems USD 0.18 Billion (2025) Space optimization in compact operatories
Mobile/Independent Units 6.80% CAGR (2026–2035) Portable dentistry and community outreach


Chair-mounted systems dominate the Dental Chair Market because they package instrument delivery, lighting, and suction into a single footprint — a configuration that aligns with DSO procurement standards emphasizing workflow efficiency. These systems reduce setup time between patients by approximately 15% compared to ceiling-mounted alternatives, which explains their persistent revenue leadership. Mobile-independent units, while smaller in absolute terms, are gaining traction through community dental programs and military field dentistry applications where portability is non-negotiable.

By Product Type

Segment Metric Primary Demand Driver
Powered Chairs 60.80% share (2025) Programmable positioning, patient comfort
Non-Powered Chairs USD 0.38 Billion (2025) Budget clinics in price-sensitive markets


Powered chairs lead the Dental Chair Market as electric-drive mechanisms deliver precise, repeatable patient positioning that manual hydraulic systems cannot match. The shift to powered units is especially pronounced in practices performing implant and surgical procedures exceeding 90 minutes, where micro-adjustments to chair angle directly affect clinician ergonomics and patient safety.

By Operation Mechanism

Segment Metric Primary Demand Driver
Electromechanical 33.30% share (2025) Hybrid control flexibility
Electric Motorized 7.40% CAGR (2026–2035) Precision, quiet operation, IoT readiness
Hydraulic USD 0.25 Billion (2025) Cost-effective legacy installations


Electric motorized chairs represent the fastest-growing operation mechanism in the Dental Chair Market, driven by their compatibility with digital practice management systems and superior noise profiles compared to hydraulic alternatives.

By Application

Segment Metric Primary Demand Driver
Examination 43.50% share (2025) Routine diagnostic and hygiene visits
Surgery and Implantology 6.75% CAGR (2026–2035) Growing implant procedure volumes
Orthodontics USD 0.11 Billion (2025) Aligner and bracket adjustment visits
Prosthodontics 5.60% CAGR (2026–2035) Aging-population restorative demand


Examination chairs anchor the largest application share in the Dental Chair Market because preventive and diagnostic visits account for the highest procedure volume across all practice types. Surgery and implantology applications are growing faster as the global dental implant market — valued at over USD 5 Billion — drives demand for chairs optimized for long-duration, precision-critical procedures [29].

By End User

Segment Metric Primary Demand Driver
Dental Clinics 53.10% share (2025) Largest care delivery setting worldwide
Hospitals USD 0.20 Billion (2025) Oral surgery and trauma departments
Ambulatory Surgery Centers 7.75% CAGR (2026–2035) Outpatient surgical volume migration
Academic & Research Institutions 4.80% CAGR (2026–2035) Training and simulation requirements


Dental clinics maintain the dominant end-user position in the Dental Chair Market because they represent the primary point of care for routine and specialty dental services globally. Ambulatory surgery centers register the fastest growth as outpatient oral surgery volumes shift away from hospital operating rooms toward freestanding facilities with lower overhead.

By Distribution Channel

Segment Metric Primary Demand Driver
Direct Manufacturer Sales 52.10% share (2025) DSO bulk contracts and custom configurations
Dealer/Distributor Sales USD 0.30 Billion (2025) Regional coverage and after-sales service
E-Commerce Portals 8.00% CAGR (2026–2035) Price transparency, mid-tier chair purchases


Direct manufacturer-to-practice sales lead the Dental Chair Market distribution landscape as DSOs negotiate volume pricing and specification control directly with OEMs. E-commerce portals are the fastest-growing channel, particularly for replacement parts, accessories, and entry-level chair models, where standardized specifications reduce the need for in-person consultation.


Regional Market Share Analysis

Region Metric Primary Investment Themes
North America 36.40% share (2025) DSO network scaling, infection-control mandates
Europe 27.00% share (2025) EU MDR compliance, aging infrastructure replacement
Asia-Pacific 6.35% CAGR (2026–2035) Public oral-health programs, urbanization
South America USD 0.07 Billion (2025) Government primary-care expansion
Middle East & Africa 5.50% share (2025) Medical tourism, Gulf state healthcare investment
Total USD 0.98 Billion (2025)

The Dental Chair Market exhibits distinct regional dynamics shaped by healthcare infrastructure maturity, regulatory stringency, and the pace of DSO consolidation. North America and Europe together accounted for over 63% of 2025 revenue, but Asia-Pacific's expansion trajectory is narrowing that concentration.


North America

Country Metric Key Driver
US 78.50% of regional share DSO consolidation, FDA Class II guidance
Canada 13.20% of regional share Provincial dental-care expansion programs
Mexico 8.30% of regional share Medical tourism growth and private clinic investment


The United States dominates the North American Dental Chair Market as DSOs like Heartland Dental and Aspen Dental standardize fleet-wide chair specifications across thousands of locations. Canada's federal dental care program, launched in 2024, is expected to bring 9 million previously uninsured adults into the system, driving new clinic setups in underserved provinces [22]. Mexico benefits from cross-border dental tourism, with cities like Los Algodones and Tijuana reporting a 14% annual increase in visiting patients [23].

Europe

Country Metric Key Driver
Germany 5.85% CAGR (2026–2035) Strict DIN/ISO compliance, high dentist density
UK 18.50% of regional share NHS dental reform and private practice growth
France USD 0.04 Billion (2025) Aging population, social insurance coverage
Italy 11.20% of regional share High per-capita dental spending
Spain 4.90% CAGR (2026–2035) Dental tourism from Northern Europe
Nordic Countries USD 0.03 Billion (2025) Advanced digital adoption rates
Russia 5.10% of regional share Federal dental modernization programs
Rest of Europe 14.80% of regional share Mixed public-private healthcare systems


Europe's Dental Chair Market growth is anchored by EU MDR 2017/745 enforcement, which requires practices to certify that all operatory equipment meets updated biocompatibility and sterilization standards by mid-2027 [9]. Germany's dense network of over 70,000 practicing dentists ensures consistent replacement demand, while the UK's ongoing NHS dental reform is channeling public investment toward modernizing outdated clinic infrastructure.

Asia-Pacific

Country Metric Key Driver
China 28.30% of regional share Healthy China 2030, urban clinic expansion
India 7.10% CAGR (2026–2035) Ayushman Bharat, rural health infrastructure
Japan USD 0.05 Billion (2025) Super-aging population, precision dentistry
South Korea 12.40% of regional share Advanced digital dental ecosystem
ASEAN 6.50% CAGR (2026–2035) Medical tourism, rising middle-class dental spend
Rest of Asia-Pacific 9.80% of regional share Government oral-health programs


Asia-Pacific represents the fastest-growing region in the Dental Chair Market, propelled by government-funded oral healthcare programs and rapid urbanization, creating demand for new dental clinics. China alone added over 15,000 licensed dental clinics between 2021 and 2024, and India's Ayushman Bharat scheme targets primary dental infrastructure in 600+ district hospitals [12].

South America

Country Metric Key Driver
Brazil 62.00% of regional share SUS public healthcare dental coverage
Argentina 5.20% CAGR (2026–2035) Private practice modernization
Rest of South America USD 0.02 Billion (2025) Early-stage infrastructure development


Brazil's Unified Health System (SUS) dental program serves over 30 million patients annually and is gradually transitioning public clinics from manual to powered chair systems, creating a steady replacement pipeline in the Dental Chair Market [24].

Middle East & Africa

Country Metric Key Driver
Saudi Arabia 30.20% of regional share Vision 2030 healthcare investment
UAE 6.80% CAGR (2026–2035) Medical tourism, premium private clinics
South Africa USD 0.01 Billion (2025) Urban private dental sector growth
Egypt 14.50% of regional share Population-driven demand
Rest of MEA 22.30% of regional share Mixed public-private dental infrastructure


Saudi Arabia's Vision 2030 healthcare pillar allocates over USD 65 Billion to hospital and clinic construction, with dental operatory modernization embedded in the Ministry of Health's primary care expansion plan [25]. The UAE's position as a dental tourism hub drives demand for premium, digitally integrated chair systems in the Dental Chair Market.


Dental Chair Market By Region, 2025-2035

Competitive Benchmarking

The Dental Chair Market exhibits medium concentration, with an estimated top-five player share of 45–52% and a Herfindahl-Hirschman Index (HHI) in the 800–1,200 range — characteristic of a market where several large multinationals compete alongside specialized regional manufacturers. Competition centers on integrated delivery system design, after-sales service networks, and digital ecosystem capabilities rather than price alone.

Company Est. Revenue Share Range Key Offerings for the Dental Chair Market Strategic Positioning
Danaher Corporation (KaVo Kerr) ~8–11% KaVo ESTETICA series, integrated imaging Premium integrated operatory solutions
Dentsply Sirona ~7–10% INTEGO, SINIUS treatment centers End-to-end digital workflow provider
Planmeca Group ~6–9% Planmeca Compact, Sovereign series Innovation-led, IoT-connected platforms
A-dec Inc. ~7–10% A-dec 500, A-dec 300 series Reliability-focused, US manufacturing base
Midmark Corporation ~5–7% Midmark Elevance, Progeny Imaging Clinical workflow integration
Takara Belmont ~5–8% Belmont Clesta, Cleo series Ergonomic design heritage, Japan-based
DentalEZ Group ~3–5% StarDental, Columbia operatories Value-tier, service-focused distribution
Pelton & Crane ~2–4% Spirit series, LF II chair Legacy brand, mid-market positioning
Yoshida Dental ~2–4% Finesia, Joistar treatment units Asia-Pacific regional strength
Sirona Dental (Carestream) ~2–3% CS series imaging-chair bundles Imaging-first, bundled sales approach


Recent News & Developments

  • Planmeca (June 2026): Expanded its dental treatment unit portfolio by officially launching the Planmeca Pro40 and Planmeca Pro50 S, integrating advanced 12.3-inch touchscreen user interfaces, automated waterline cleaning systems, and direct software connectivity to the Planmeca Romexis cloud platform to streamline digital clinical workflows.
  • Dentsply Sirona (March 2025): Showcased the expansion of its DS Core cloud-based digital ecosystem at the International Dental Show (IDS) in Cologne, unveiling its new integrated AI-powered DS Core Diagnose features and smart anatomy tools built directly into its connected clinical imaging and treatment networks.
  • A-dec (February 2026): Expanded its strategic alliance with Dentsply Sirona by announcing the direct integration of the specialized Dentsply Sirona Midwest Motor System into the delivery pods of its flagship A-dec 500 Pro and A-dec 300 Pro digitally connected dental chair lines.


  • Midmark Corporation (February 2026): Unveiled its next generation of connected dental operatory solutions, launching a unified ecosystem consisting of a smart Midmark Dental Chair, an integrated Delivery System, and an LED Operatory Light engineered specifically with human-centered, data-connected diagnostics to maximize musculoskeletal health and clinical workflow tracking.


Dental Chair Market Report Scope

Parameter Detail
Market Scope Global Dental Chair Market covering 42 countries
Study Period 2021–2035
CAGR (Forecast) 5.80% (2026–2035)
Base Year 2025 — USD 0.98 Billion
2026 Forecast USD 1.03 Billion
2035 Forecast USD 1.71 Billion
Fastest Growing Segment E-Commerce Distribution (8.00% CAGR); Asia-Pacific (regional)
Companies Profiled 10 major players
Valuation Currency USD Billion


FAQs

What warranty and service-contract terms should buyers negotiate when purchasing dental chairs?

Most OEMs offer 3–5 year warranties on frames and 1–2 years on upholstery and motors. Negotiate bundled preventive maintenance at 8–12% of purchase price annually, and confirm response-time guarantees under 48 hours for critical failures [14].

How does chair weight capacity affect clinical versatility and compliance?

Standard chairs support 135–180 kg, but bariatric-rated models handle 225 kg+. Selecting a higher-capacity chair reduces liability exposure and expands patient eligibility without requiring separate specialty equipment [15].

What integration protocols matter most when connecting a dental chair to practice management software?

Look for chairs supporting HL7 FHIR or proprietary APIs that sync patient positioning presets with electronic health records. Seamless integration cuts data-entry time and enables automated utilization reporting [2].

How do infection-control surface materials differ across price tiers in the Dental Chair Market?

Premium chairs use molded, seamless polyurethane upholstery resistant to chemical disinfectants. Budget models often feature stitched vinyl that traps pathogens at seams, increasing cross-contamination risk [8].

What is the typical return on investment timeline for upgrading from hydraulic to electric chairs?

Practices typically recover the incremental cost within 18–24 months through faster patient turnover and reduced maintenance expenses.

How are dental chairs adapted for pediatric and special-needs patients?

Manufacturers offer narrow-width seats, adjustable armrests, and stabilization accessories for pediatric use. Special-needs configurations include wheelchair-transfer platforms and sensory-calming lighting options [16].

What role do trade-in programs play in the Dental Chair Market replacement cycle?

OEMs and dealers offer trade-in credits of 10–25% against new purchases, accelerating upgrade decisions. These programs also feed the certified refurbished pipeline that serves cost-sensitive buyers [17].    
Author
Author
Author Profile
Satyendra Maurya LinkedIn
Research Analyst
An accomplished research analyst with high proficiency in market forecasting, data visualization, competitive benchmarking, and others. He holds a pronounced track record in research and consulting projects for sectors such as life sciences, medical devices, and healthcare IT. His capabilities in qualitative and quantitative analysis have resulted in positive client outcomes. Working on niche market trends, opportunities, sales, and forecasted value is part of his skill set.
Co-Author
Co-Author Profile
Rahul Gotadki LinkedIn
Research Manager
He holds an experience of about 9+ years in Market Research and Business Consulting, working under the spectrum of Life Sciences and Healthcare domains. Rahul conceptualizes and implements a scalable business strategy and provides strategic leadership to the clients. His expertise lies in market estimation, competitive intelligence, pipeline analysis, customer assessment, etc.

Research Approach


Secondary Research

The secondary research process involved comprehensive analysis of regulatory databases, peer-reviewed dental journals, clinical publications, and authoritative health organizations. Key sources included the US Food & Drug Administration (FDA) Center for Devices and Radiological Health, European Commission Medical Device Coordination Group (MDCG), International Organization for Standardization (ISO 6875, ISO 13485), FDI World Dental Federation, American Dental Association (ADA), National Institute of Dental and Craniofacial Research (NIDCR/NIH), Centers for Disease Control and Prevention (CDC) Division of Oral Health, World Health Organization (WHO) Oral Health Database, Occupational Safety and Health Administration (OSHA) Dental Guidelines, European Dental Industry Association (CECDI), and national dental association reports from key markets including the American Association of Oral and Maxillofacial Surgeons (AAOMS), British Dental Association (BDA), and Japan Dental Association (JDA).

Dental procedure statistics, clinical safety studies, market landscape analysis for electromechanical dental chairs, hydraulic systems, manual chairs, and integrated dental delivery systems, as well as medical device regulatory approval data (510(k) clearances and CE markings), were gathered from these sources.


Primary Research

Qualitative and quantitative insights were obtained by interviewing supply-side and demand-side stakeholders during the primary research process. The supply-side sources consist of CEOs, VPs of Manufacturing, regulatory affairs chiefs, and commercial directors from dental equipment manufacturers, dental unit OEMs, and ergonomic component suppliers. General dentists, oral surgeons, orthodontists, dental clinic owners, procurement leads from Dental Service Organizations (DSOs), hospital facility administrators, and academic research institution directors comprised demand-side sources. The primary research validated market segmentation across product types, confirmed product pipeline timelines for smart dental chairs and AI-integrated units, and garnered insights on clinical adoption patterns, refurbishment cycles, pricing strategies, and group purchasing organization (GPO) dynamics.

Primary Respondent Breakdown:

By Designation: C-level Primaries (40%), Director Level (30%), Others (30%)

By Region: North America (32%), Europe (30%), Asia-Pacific (28%), Rest of World (10%)


Market Size Estimation

Revenue mapping and dental procedure volume analysis were employed to determine the global market valuation. The methodology comprised the following:

Identification of over 55 key manufacturers in North America, Europe, Asia-Pacific, Latin America, and the Middle East and Africa

Product mapping for the categories of electromechanical dental chairs, hydraulic dental chairs, manual chairs, and adjustable/programmable chairs

Examination of annual revenues that are specific to dental chair portfolios, including upholstery replacement cycles and maintenance contracts, as reported and modeled

Manufacturers that account for 75-80% of the global market share in 2024 are included in the coverage.

Using bottom-up (dental clinic establishment rates × equipment replacement cycles × average selling price by country) and top-down (manufacturer revenue substantiation against DSO procurement data) approaches, segment-specific valuations are derived through extrapolation.

Download Free Sample

Kindly complete the form below to receive a free sample of this Report

Download PDF ×

We do not share your information with anyone. However, we may send you emails based on your report interest from time to time. You may contact us at any time to opt-out.