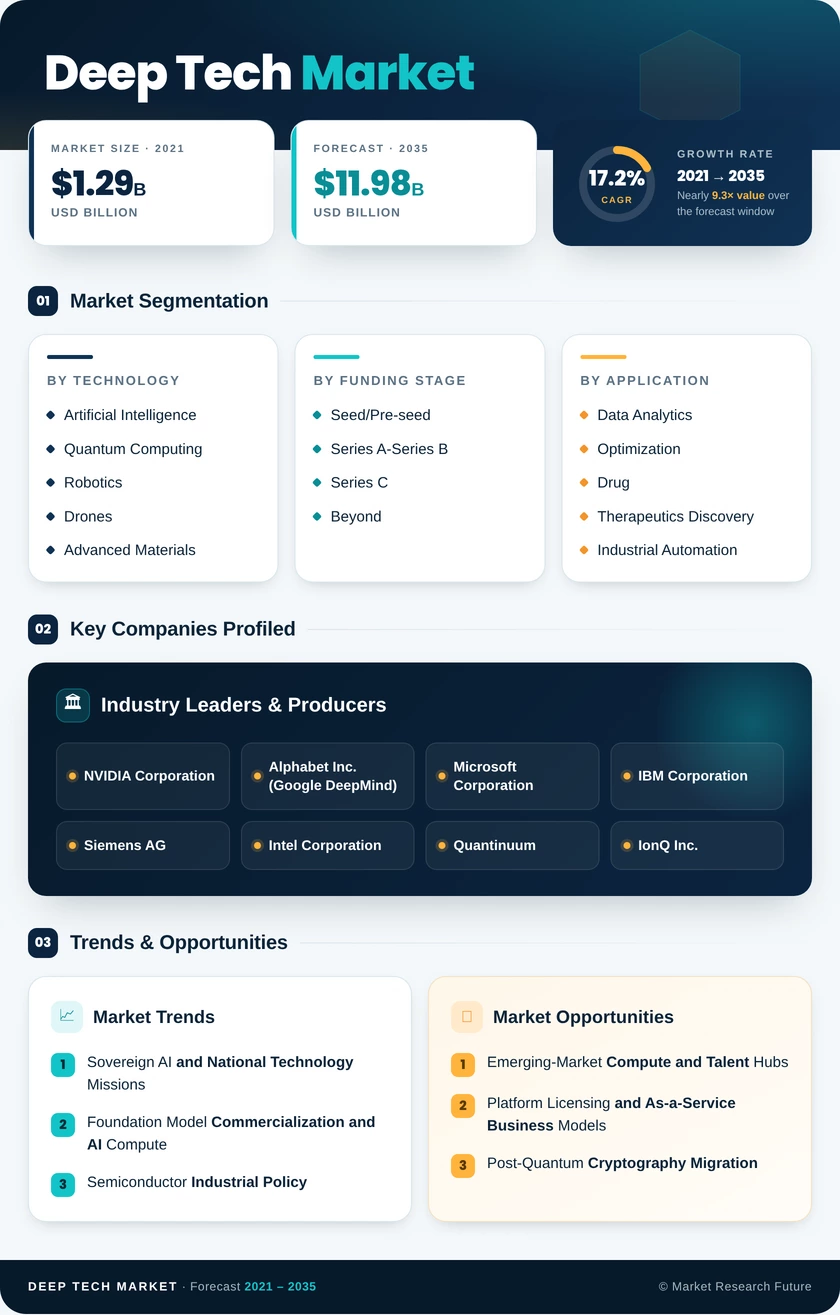
Deep Tech Market (2026 – 2035)

ID: MRFR/ICT/29933-HCR 128 Pages Nirmit Biswas Last Updated: October 17, 2026
Deep Tech Market Size, Share and Research Report By Technology (Artificial Intelligence, Quantum Computing, Robotics and Drones, Advanced Materials, Synthetic Biology, and Other Technologies), By Funding Stage (Seed/Pre-seed, Series A-Series B, and Series C and Beyond), By Application (Data Analytics and Optimization, Drug and Therapeutics Discovery, Industrial Automation, Materials and Chemicals Discovery, Cybersecurity, Climate-tech Solutions, and Other Applications), By End-User Industry (IT and Telecom, Healthcare and Life Sciences, Defense and Aerospace, Manufacturing, Energy and Utilities, BFSI, Agriculture, and Others) And By Region (North America, Europe, Asia-Pacific, And Rest Of The World) –Indust
Deep Tech Market
Market Size
Forecast Period2026-2035
CAGR (2026-2035)17.2%
2025 Market SizeUSD 2.45 Billion
2035 Market SizeUSD 11.98 Billion
Key Players
NVIDIA Corporation
Alphabet Inc.
Microsoft Corporation
IBM Corporation
Siemens AG
Intel Corporation
Opportunities
  • Emerging-Market Compute and Talent Hubs
  • Platform Licensing and As-a-Service Business Models
  • Post-Quantum Cryptography Migration
  1. 1 Market Summary | |
  2. 2 Key Report Takeaways | |
    1. 2.1 By Technology | |
    2. 2.2 By Funding Stage | |
    3. 2.3 By Application | |
    4. 2.4 By End-User Industry | |
    5. 2.5 By Region | |
  3. 3 Market Size and Forecast (2021–2035) | |
  4. 4 Driver Impact Analysis | |
    1. 4.1 Sovereign AI and National Technology Missions | |
    2. 4.2 Foundation Model Commercialization and AI Compute | |
    3. 4.3 Semiconductor Industrial Policy | |
    4. 4.4 Quantum Hardware and Error-Correction Milestones | |
    5. 4.5 Specialist Funds and Blended Public-Private Finance | |
    6. 4.6 AI-Driven Drug and Therapeutics Discovery | |
    7. 4.7 Foundation Models in Industrial Automation | |
  5. 5 Restraints Impact Analysis | |
    1. 5.1 Long Commercialization Cycles and Capital Intensity | |
    2. 5.2 Shortage of Specialized Technical Talent | |
    3. 5.3 Export Controls and Technology Fragmentation | |
    4. 5.4 Regulatory Compliance Complexity | |
    5. 5.5 Energy and Data-Center Infrastructure Constraints | |
  6. 6 Opportunities | |
    1. 6.1 Emerging-Market Compute and Talent Hubs | |
    2. 6.2 Platform Licensing and As-a-Service Business Models | |
    3. 6.3 Post-Quantum Cryptography Migration | |
    4. 6.4 Climate and Energy Deep Tech | |
    5. 6.5 Dual-Use Defense Technologies | |
  7. 7 Regional Market Share and Country-Level Analysis | |
    1. 7.1 North America | | |
      1. 7.1.1 US | | |
      2. 7.1.2 Canada | | |
      3. 7.1.3 Mexico | |
    2. 7.2 Europe | | |
      1. 7.2.1 Germany | | |
      2. 7.2.2 UK | | |
      3. 7.2.3 France | | |
      4. 7.2.4 Italy | | |
      5. 7.2.5 Spain | | |
      6. 7.2.6 Nordic Countries | | |
      7. 7.2.7 Russia | | |
      8. 7.2.8 Rest of Europe | |
    3. 7.3 Asia-Pacific | | |
      1. 7.3.1 China | | |
      2. 7.3.2 India | | |
      3. 7.3.3 Japan | | |
      4. 7.3.4 South Korea | | |
      5. 7.3.5 ASEAN | | |
      6. 7.3.6 Rest of Asia-Pacific | |
    4. 7.4 South America | | |
      1. 7.4.1 Brazil | | |
      2. 7.4.2 Argentina | | |
      3. 7.4.3 Rest of South America | |
    5. 7.5 Middle East & Africa | | |
      1. 7.5.1 Saudi Arabia | | |
      2. 7.5.2 UAE | | |
      3. 7.5.3 South Africa | | |
      4. 7.5.4 Egypt | | |
      5. 7.5.5 Rest of MEA | |
  8. 8 Future Outlook (2026–2035) | |
    1. 8.1 AI Agents and Autonomous Science | |
    2. 8.2 Quantum Advantage and Fault Tolerance | |
    3. 8.3 The Compute-Energy Nexus | |
    4. 8.4 Technology Sovereignty and Dual-Use Convergence | |
  9. 9 Segmentation Analysis | |
    1. 9.1 By Technology | | |
      1. 9.1.1 Artificial Intelligence | | |
      2. 9.1.2 Quantum Computing | | |
      3. 9.1.3 Robotics and Drones | | |
      4. 9.1.4 Advanced Materials | | |
      5. 9.1.5 Synthetic Biology | | |
      6. 9.1.6 Other Technologies | |
    2. 9.2 By Funding Stage | | |
      1. 9.2.1 Seed/Pre-seed | | |
      2. 9.2.2 Series A-Series B | | |
      3. 9.2.3 Series C and Beyond | |
    3. 9.3 By Application | | |
      1. 9.3.1 Data Analytics and Optimization | | |
      2. 9.3.2 Drug and Therapeutics Discovery | | |
      3. 9.3.3 Industrial Automation | | |
      4. 9.3.4 Materials and Chemicals Discovery | | |
      5. 9.3.5 Cybersecurity | | |
      6. 9.3.6 Climate-tech Solutions | | |
      7. 9.3.7 Other Applications | |
    4. 9.4 By End-User Industry | | |
      1. 9.4.1 IT and Telecom | | |
      2. 9.4.2 Healthcare and Life Sciences | | |
      3. 9.4.3 Defense and Aerospace | | |
      4. 9.4.4 Manufacturing | | |
      5. 9.4.5 Energy and Utilities | | |
      6. 9.4.6 BFSI | | |
      7. 9.4.7 Agriculture | | |
      8. 9.4.8 Others | |
  10. 10 Competitive Landscape | |
    1. 10.1 Market Concentration Analysis | |
    2. 10.2 Competitive Benchmarking Table | |
  11. 11 Recent News & Developments | |
  12. 12 Report Scope and Methodology | |
  13. 13 Detailed Sources and Citations | |
  14. 14 Frequently Asked Questions (FAQs) | | LIST OF TABLES | |
  15. TABLE 1 Global Deep Tech Market Summary, 2025 and 2035 | |
  16. TABLE 2 Global Deep Tech Size & Forecast, by Revenue (USD Billion), 2021–2035 | |
  17. TABLE 3 Driver Impact Analysis on CAGR, 2026–2035 | |
  18. TABLE 4 Restraints Impact Analysis on CAGR, 2026–2035 | |
  19. TABLE 5 Regional Summary, 2025 | |
  20. TABLE 6 North America Deep Tech, by Country, 2025 | |
  21. TABLE 7 Europe Deep Tech, by Country, 2025 | |
  22. TABLE 8 Asia-Pacific Deep Tech, by Country, 2025 | |
  23. TABLE 9 South America Deep Tech, by Country, 2025 | |
  24. TABLE 10 Middle East & Africa Deep Tech, by Country, 2025 | |
  25. TABLE 11 Global Deep Tech, by Technology, 2025 | |
  26. TABLE 12 Global Deep Tech, by Funding Stage, 2025 | |
  27. TABLE 13 Global Deep Tech, by Application, 2025 | |
  28. TABLE 14 Global Deep Tech, by End-User Industry, 2025 | |
  29. TABLE 15 Competitive Benchmarking Table, 2025 | |
  30. TABLE 16 Report Scope and Methodology | |
  31. TABLE 17 Detailed Sources and Citations | |
  32. TABLE 18 Segmentation Quick Reference | | LIST OF FIGURES | |
  33. FIGURE 1 Market Dynamics Overview — Drivers, Restraints, and Opportunities | |
  34. FIGURE 2 Deep Tech Value Chain Analysis | |
  35. FIGURE 3 Porter's Five Forces Analysis | |
  36. FIGURE 4 Global Market Size Trend (USD Billion), 2021–2035 | |
  37. FIGURE 5 Year-over-Year Growth Rate, 2021–2035 | |
  38. FIGURE 6 Market Share by Technology, 2025 | |
  39. FIGURE 7 Market Share by Funding Stage, 2025 | |
  40. FIGURE 8 Market Share by Application, 2025 | |
  41. FIGURE 9 Market Share by End-User Industry, 2025 | |
  42. FIGURE 10 Regional Market Share, 2025 | |
  43. FIGURE 11 Regional Growth Comparison (CAGR), 2026–2035 | |
  44. FIGURE 12 Competitive Landscape — Estimated Revenue Share Ranges, 2025 | |
  45. FIGURE 13 Company Strategic Positioning Matrix

Segmentation Quick Reference

DimensionSub-SegmentsDominant SegmentFastest Growing Segment
By TechnologyArtificial Intelligence, Quantum Computing, Robotics and Drones, Advanced Materials, Synthetic Biology, Other TechnologiesArtificial Intelligence (34.5% share)Quantum Computing (21.1% CAGR)
By Funding StageSeed/Pre-seed, Series A-Series B, Series C and BeyondSeries A-Series B (50.6% share)Seed/Pre-seed (21.5% CAGR)
By ApplicationData Analytics and Optimization, Drug and Therapeutics Discovery, Industrial Automation, Materials and Chemicals Discovery, Cybersecurity, Climate-tech Solutions, Other ApplicationsData Analytics and Optimization (24.9% share)Industrial Automation (20.3% CAGR)
By End-User IndustryIT and Telecom, Healthcare and Life Sciences, Defense and Aerospace, Manufacturing, Energy and Utilities, BFSI, Agriculture, OthersIT and Telecom (23.0% share)Healthcare and Life Sciences (19.8% CAGR)
By RegionNorth America, Europe, Asia-Pacific, South America, Middle East & AfricaNorth America (39.5% share)Asia-Pacific (20.1% CAGR)


Market Segmentation Overview

By Technology

Sub-SegmentKey Trend
Artificial IntelligenceShift from general chat models to agentic and domain-specific systems
Quantum ComputingError-corrected logical qubits move into industrial pilots
Robotics and DronesVision-first foundation models replace costly lidar stacks
Advanced MaterialsMachine-learning synthesizability engines shorten discovery cycles
Synthetic BiologyAI-guided strain design lowers biomanufacturing costs
Other TechnologiesPhotonics and neuromorphic chips target energy efficiency


Artificial Intelligence leads this dimension with a 34.5% share because cloud providers and sovereign programs have already built large-scale deployment channels for models. Quantum Computing grows fastest at a 21.1% CAGR, since recent error-correction results from Google and Microsoft give enterprises a credible reason to fund chemistry and optimization pilots. Robotics and Drones and Synthetic Biology both depend increasingly on AI, so gains in model capability feed directly into their growth.

By Funding Stage

Sub-SegmentKey Trend
Seed/Pre-seedGrant-matched rounds lower first-check risk
Series A-Series BInvestors concentrate capital on validated prototypes
Series C and BeyondScale-up rounds rely on strategic and sovereign co-investors


Series A-Series B rounds dominate with a 50.6% share, as investors prefer ventures that have passed proof-of-concept but still need capital to build production-grade systems. Seed/Pre-seed funding grows fastest at a 21.5% CAGR because EIC grants and national missions absorb early technical risk and make first checks easier to write. Series C and Beyond remains the tightest stage outside AI, which pushes late-stage hardware companies toward strategic investors or acquisition.

By Application

Sub-SegmentKey Trend
Data Analytics and OptimizationAI pipelines move from pilots to production in finance and logistics
Drug and Therapeutics DiscoveryPharma licenses AI and quantum simulation platforms
Industrial AutomationFoundation models orchestrate multi-robot production cells
Materials and Chemicals DiscoveryAI-driven retrosynthesis cuts laboratory iterations
CybersecurityPost-quantum cryptography migration creates fixed-deadline demand
Climate-tech SolutionsAI-designed catalysts and battery chemistries attract dedicated funds
Other ApplicationsSpace, sensing, and logistics pilots expand


Data Analytics and Optimization holds the lead with a 24.9% share because banks, retailers, and logistics operators already run AI in production and keep expanding its scope. Industrial Automation grows fastest at a 20.3% CAGR as manufacturers use foundation models to coordinate robot fleets without extensive reprogramming. Drug and Therapeutics Discovery and Cybersecurity follow as strong secondary growth areas, the former driven by pharma platform licensing and the latter by post-quantum migration mandates.

By End-User Industry

Sub-SegmentKey Trend
IT and Telecom5G-cloud and AI silicon demand sustain spending
Healthcare and Life SciencesImaging AI and drug discovery partnerships scale
Defense and AerospaceDual-use autonomy and quantum sensing procurement grows
ManufacturingAI automation strengthens supply-chain resilience
Energy and UtilitiesQuantum optimization pilots for distributed grids
BFSIGenerative AI deployed for fraud analytics
AgriculturePrecision-farming algorithms improve input efficiency
OthersRetail, logistics, and public-sector adoption broadens


IT and Telecom leads with a 23.0% share, since operators and cloud providers are the first buyers of AI silicon and network-optimization models. Healthcare and Life Sciences grows fastest at a 19.8% CAGR as hospitals put unstructured imaging data to use through cloud partnerships and pharma companies license discovery platforms. Energy and Utilities and Defense and Aerospace add momentum through grid optimization pilots and dual-use procurement.




Download PDF ×

We do not share your information with anyone. However, we may send you emails based on your report interest from time to time. You may contact us at any time to opt-out.