ID: MRFR/ICT/3445-HCR | February 2021 | Region: Global | 100 pages
Market Synopsis
Data Fabric is a software approach for data movement and management; it provide a consistent set of capabilities and services, which span a choice of endpoints and application ecosystems connected across the cloud and on-premises. Data fabric simplifies and integrates data management across cloud and on-premises to accelerate digital transformation. It delivers consistent and integrated hybrid cloud data services for data visibility and insights, data access and control, and data protection and security.
The factors that are driving the market for global data fabric market are growth in the processing and commutation techniques, growing internet technology, upswing in cloud based organizations and increase in virtualization of network infrastructure.
Segmentation
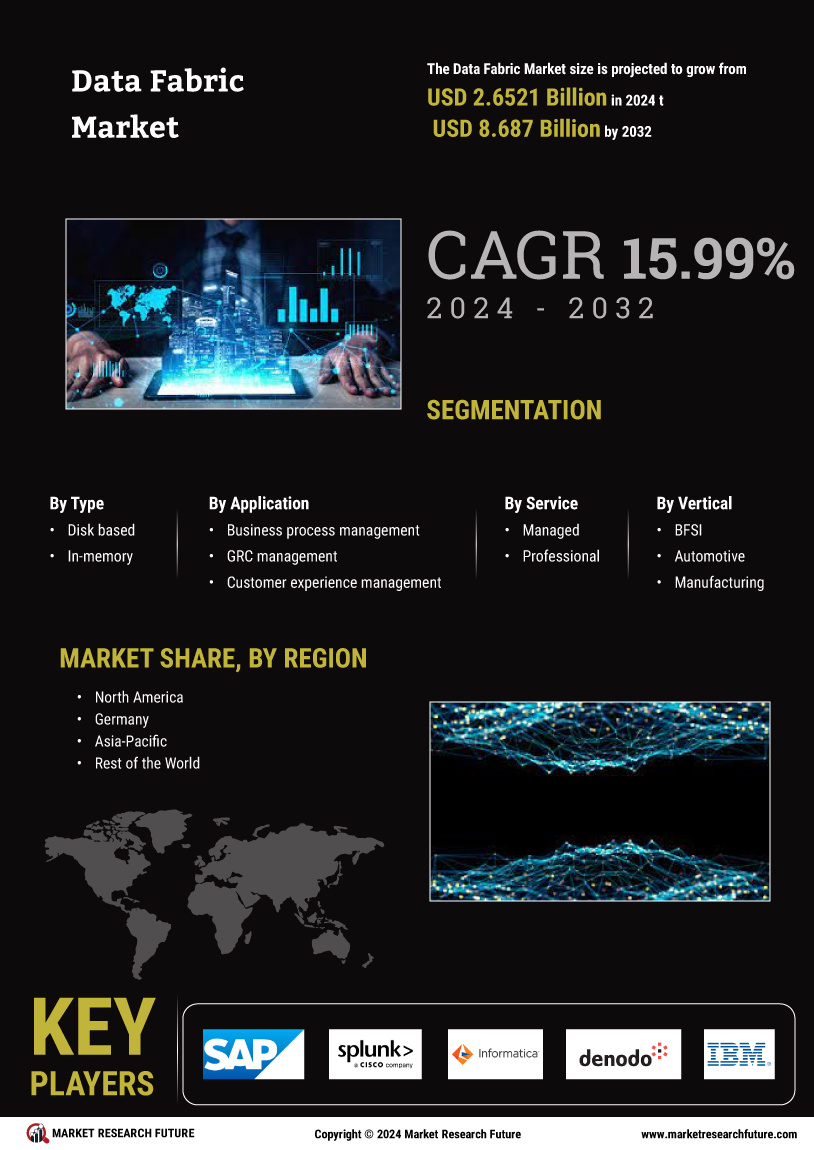
The global data fabric market is segmented based on type, application, services, vertical, and region. On basis of type, the segment is further classified into disk-based and in-memory. The application segment is further classified into business process management, customer experience management, GRC (Governance, risk management, and compliance) management, fraud detection, and security management. The services segment is further classified into managed and professional services. The vertical segment is further classified into healthcare, BFSI, automotive, retail and e-commerce, media and entertainment, and energy and utilities, others.
Key Findings
In the area of healthcare, data fabric management is being widely adopted. Netapp an American multinational storage and data management company developed an application for healthcare sector. The data fabric enabled by Netapp allows healthcare organizations to adhere to internal data security policies, maintain compliance with HIPAA and HITECH requirements and promote greater innovation and IT responsiveness. It helps healthcare organizations to integrate on-premises enterprise class data management and control with flexibility, speed and economies of public cloud. Advances in technology and cloud computing provide key capabilities to help the healthcare industry redesign storage systems to keep pace with tremendous data growth in clinical data.
In retail, data fabric management is providing many advantages such as
Retailers are adopting disruptive technologies such as wearable, mobile, big data, virtual reality, sensors, and robotics.
In 2015, SAP AG announced the availability of the 7.4 version of the SAP Business Warehouse (SAP BW) application powered by SAP HANA as part of the new in-memory data architecture. SAP’s in-memory data fabric speeds business intelligence to front-line employees, making businesses more productive and competitive in real time while significantly reduce data duplication.
Global Data Fabric Market, 2017-2023 (USD Million)
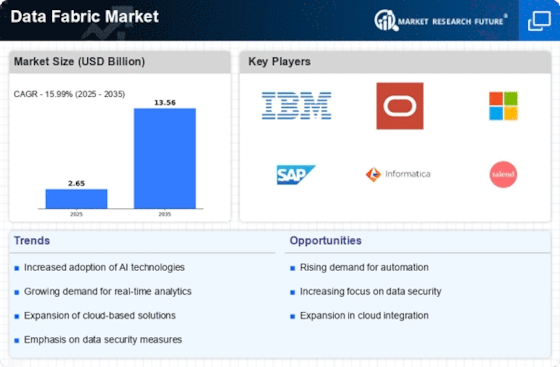
The global data fabric market is expected to grow at a CAGR of 18% over the forecast period.
Regional Analysis
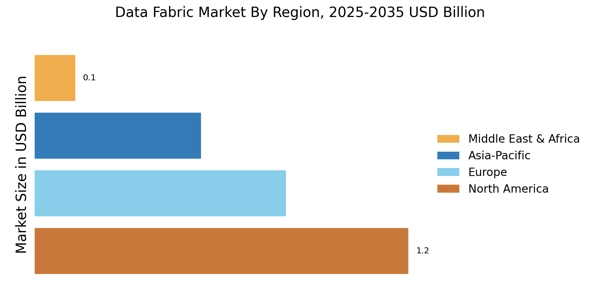
The global data fabric market is being led by North America followed by Europe and Asia Pacific. The technological advancements and early adoption of data management systems in North America is likely to lead the market. The market in Asia Pacific is expected to grow rapidly over the forecast period. Increasing technological adoption and huge opportunities across industry verticals in APAC countries, especially India, China, and Japan are the major driver of the market.
Some of the key players in the market are SAP SE (Germany), Informatica (U.S.), Splunk Inc. (U.S.), Denodo (U.S.), Syncsort Inc. (U.S.), IBM Corporation (U.S.), Oracle Corporation (U.S.), Global DS (U.S.), Teradata Corporation (U.S.), and K2 View (U.S.).
Intended Audience
Frequently Asked Questions (FAQ) :
The global data fabric market is predicted to grow at an 18% CAGR between 2017- 2023.
North America will lead the global data fabric market.
In-memory and disk-based are the different types of data fabric.
Growing internet technology and increase in virtualization of network infrastructure are driving the global data fabric market growth.
Key contenders profiled in the global data fabric market include SAP SE (Germany), Informatica (U.S.), Splunk Inc. (U.S.), Denodo (U.S.), Syncsort Inc. (U.S.), IBM Corporation (U.S.), Oracle Corporation (U.S.), Global DS (U.S.), Teradata Corporation (U.S.), and K2 View (U.S.).
TABLE OF CONTENTS
1. Executive Summary
2. Scope of the Report
2.1. Market Definition
2.2. Scope of the Study
2.2.1. Research Objectives
2.2.2. Assumptions & Limitations
2.3. Markets Structure
3. Market Research Methodology
3.1. Research Process
3.2. Secondary Research
3.3. Primary Research
3.4. Forecast Model
4. Market Landscape
4.1. Porter’s Five Forces Analysis
4.1.1. Threat of New Entrants
4.1.2. Bargaining power of buyers
4.1.3. Threat of substitutes
4.1.4. Rivalry
4.1.5. Bargaining Power of Suppliers
4.2. Value Chain/Supply Chain of Data Fabric Market
5. Market Overview of Data Fabric Market
5.1. Introduction
5.2. Growth Drivers
5.3. Impact Analysis
5.4. Market Challenges
6. Market Trends
6.1. Introduction
6.2. Growth Trends
6.3. Impact Analysis
7. Data Fabric Market, by Application
7.1. Introduction
7.2. Business Process Management
7.2.1. Market Estimates & Forecast, 2018–2023
7.2.2. Market Estimates & Forecast, by Region, 2018–2023
7.3. Customer Experience Management
7.3.1. Market Estimates & Forecast, 2018–2023
7.3.2. Market Estimates & Forecast, by Region, 2018–2023
7.4. GRC (Governance, Risk Management, And Compliance) Management
7.4.1. Market Estimates & Forecast, 2018–2023
7.4.2. Market Estimates & Forecast, by Region, 2018–2023
8. Data Fabric Market, by Type
8.1. Introduction
8.2. Disk-Based
8.2.1. Market Estimates & Forecast, 2018–2023
8.2.2. Market Estimates & Forecast, by Region, 2018–2023
8.3. In-Memory
8.3.1. Market Estimates & Forecast, 2018–2023
8.3.2. Market Estimates & Forecast, by Region, 2018–2023
9. Data Fabric Market, by Services
9.1. Introduction
9.2. Managed Services
9.2.1. Market Estimates & Forecast, 2018–2023
9.2.2. Market Estimates & Forecast, by Region, 2018–2023
9.3. Professional Services
9.3.1. Market Estimates & Forecast, 2018–2023
9.3.2. Market Estimates & Forecast, by Region, 2018–2023
10. Data Fabric Market, by Vertical
10.1. Introduction
10.2. BFSI
10.2.1. Market Estimates & Forecast, 2018–2023
10.2.2. Market Estimates & Forecast, by Region, 2018–2023
10.3. Automotive
10.3.1. Market Estimates & Forecast, 2018–2023
10.3.2. Market Estimates & Forecast, by Region, 2018–2023
10.4. Healthcare
10.4.1. Market Estimates & Forecast, 2018–2023
10.4.2. Market Estimates & Forecast, by Region, 2018–2023
10.5. Energy & Utilities
10.5.1. Market Estimates & Forecast, 2018–2023
10.5.2. Market Estimates & Forecast, by Region, 2018–2023
10.6. Media & Entertainment
10.6.1. Market Estimates & Forecast, 2018–2023
10.6.2. Market Estimates & Forecast, by Region, 2018–2023
11. Data Fabric Market, by Region
11.1. Introduction
11.2. North America
11.2.1. Market Estimates & Forecast, by Country 2018–2023
11.2.2. Market Estimates & Forecast, by Application, 2018–2023
11.2.3. Market Estimates & Forecast, by Types, 2018–2023
11.2.4. Market Estimates & Forecast, by Services, 2018–2023
11.2.5. Market Estimates & Forecast, by Vertical, 2018–2023
11.2.6. US
11.2.6.1. Market Estimates & Forecast, by Application, 2018–2023
11.2.6.2. Market Estimates & Forecast, by Types, 2018–2023
11.2.6.3. Market Estimates & Forecast, by Services, 2018–2023
11.2.6.4. Market Estimates & Forecast, by Vertical, 2018–2023
11.2.7. Mexico
11.2.7.1. Market Estimates & Forecast, by Application, 2018–2023
11.2.7.2. Market Estimates & Forecast, by Types, 2018–2023
11.2.7.3. Market Estimates & Forecast, by Services, 2018–2023
11.2.7.4. Market Estimates & Forecast, by Vertical, 2018–2023
11.2.8. Canada
11.2.8.1. Market Estimates & Forecast, by Application, 2018–2023
11.2.8.2. Market Estimates & Forecast, by Types, 2018–2023
11.2.8.3. Market Estimates & Forecast, by Services, 2018–2023
11.2.8.4. Market Estimates & Forecast, by Vertical, 2018–2023
11.3. Europe
11.3.1. Market Estimates & Forecast, by Country 2018–2023
11.3.2. Market Estimates & Forecast, by Application, 2018–2023
11.3.3. Market Estimates & Forecast, by Types, 2018–2023
11.3.4. Market Estimates & Forecast, by Services, 2018–2023
11.3.5. Market Estimates & Forecast, by Vertical, 2018–2023
11.3.6. Germany
11.3.6.1. Market Estimates & Forecast, by Application, 2018–2023
11.3.6.2. Market Estimates & Forecast, by Types, 2018–2023
11.3.6.3. Market Estimates & Forecast, by Services, 2018–2023
11.3.6.4. Market Estimates & Forecast, by Vertical, 2018–2023
11.3.7. France
11.3.7.1. Market Estimates & Forecast, by Application, 2018–2023
11.3.7.2. Market Estimates & Forecast, by Types, 2018–2023
11.3.7.3. Market Estimates & Forecast, by Services, 2018–2023
11.3.7.4. Market Estimates & Forecast, by Vertical, 2018–2023
11.3.8. UK
11.3.8.1. Market Estimates & Forecast, by Application, 2018–2023
11.3.8.2. Market Estimates & Forecast, by Types, 2018–2023
11.3.8.3. Market Estimates & Forecast, by Services, 2018–2023
11.3.8.4. Market Estimates & Forecast, by Vertical, 2018–2023
11.4. Asia-Pacific
11.4.1. Market Estimates & Forecast, by Country 2018–2023
11.4.2. Market Estimates & Forecast, by Application, 2018–2023
11.4.3. Market Estimates & Forecast, by Types, 2018–2023
11.4.4. Market Estimates & Forecast, by Services, 2018–2023
11.4.5. Market Estimates & Forecast, by Vertical, 2018–2023
11.4.6. China
11.4.6.1. Market Estimates & Forecast, by Application, 2018–2023
11.4.6.2. Market Estimates & Forecast, by Types, 2018–2023
11.4.6.3. Market Estimates & Forecast, by Services, 2018–2023
11.4.6.4. Market Estimates & Forecast, by Vertical, 2018–2023
11.4.7. India
11.4.7.1. Market Estimates & Forecast, by Application, 2018–2023
11.4.7.2. Market Estimates & Forecast, by Types, 2018–2023
11.4.7.3. Market Estimates & Forecast, by Services, 2018–2023
11.4.7.4. Market Estimates & Forecast, by Vertical, 2018–2023
11.4.8. Japan
11.4.8.1. Market Estimates & Forecast, by Application, 2018–2023
11.4.8.2. Market Estimates & Forecast, by Types, 2018–2023
11.4.8.3. Market Estimates & Forecast, by Services, 2018–2023
11.4.8.4. Market Estimates & Forecast, by Vertical, 2018–2023
11.4.9. Rest of Asia-Pacific
11.4.9.1. Market Estimates & Forecast, by Application, 2018–2023
11.4.9.2. Market Estimates & Forecast, by Types, 2018–2023
11.4.9.3. Market Estimates & Forecast, by Services, 2018–2023
11.4.9.4. Market Estimates & Forecast, by Vertical, 2018–2023
11.5. Rest of the World
11.5.1. Market Estimates & Forecast, by Country 2018–2023
11.5.2. Market Estimates & Forecast, by Application, 2018–2023
11.5.3. Market Estimates & Forecast, by Types, 2018–2023
11.5.4. Market Estimates & Forecast, by Services, 2018–2023
11.5.5. Market Estimates & Forecast, by Vertical, 2018–2023
11.5.6. Middle East & Africa
11.5.6.1. Market Estimates & Forecast, by Application, 2018–2023
11.5.6.2. Market Estimates & Forecast, by Types, 2018–2023
11.5.6.3. Market Estimates & Forecast, by Services, 2018–2023
11.5.6.4. Market Estimates & Forecast, by Vertical, 2018–2023
11.5.7. Latin Countries
11.5.7.1. Market Estimates & Forecast, by Application, 2018–2023
11.5.7.2. Market Estimates & Forecast, by Types, 2018–2023
11.5.7.3. Market Estimates & Forecast, by Services, 2018–2023
11.5.7.4. Market Estimates & Forecast, by Vertical, 2018–2023
12. Company Profiles
12.1. SAP SE
12.1.1. Company Overview
12.1.2. Application/Business Segment Overview
12.1.3. Financial Updates
12.1.4. Key Developments
12.2. Informatica
12.2.1. Company Overview
12.2.2. Application/Business Segment Overview
12.2.3. Financial Updates
12.2.4. Key Developments
12.3. Splunk Inc.
12.3.1. Company Overview
12.3.2. Application/Business Segment Overview
12.3.3. Financial Updates
12.3.4. Key Developments
12.4. Denodo
12.4.1. Company Overview
12.4.2. Application/Business Segment Overview
12.4.3. Financial Updates
12.4.4. Key Developments
12.5. Syncsort Inc
12.5.1. Company Overview
12.5.2. Application/Business Segment Overview
12.5.3. Financial Updates
12.5.4. Key Developments
12.6. IBM Corporation
12.6.1. Company Overview
12.6.2. Application/Business Segment Overview
12.6.3. Financial Updates
12.6.4. Key Developments
12.7. Oracle Corporation
12.7.1. Company Overview
12.7.2. Application/Business Segment Overview
12.7.3. Financial Updates
12.7.4. Key Developments
12.8. Global DS
12.8.1. Company Overview
12.8.2. Application/Business Segment Overview
12.8.3. Financial Updates
12.8.4. Key Developments
12.9. Teradata Corporation
12.9.1. Company Overview
12.9.2. Application/Business Segment Overview
12.9.3. Financial Updates
12.9.4. Key Developments
13. Conclusion
LIST OF TABLES
Table1 Global Data Fabric Market, By Country, 2018-2023
Table2 North America: Data Fabric Market, By Country, 2018–2023
Table3 Europe: Data Fabric Market, By Country, 2018–2023
Table4 Asia-Pacific: Data Fabric Market, By Country, 2018–2023
Table5 Latin America: Data Fabric Market, By Country, 2018–2023
Table6 North America: Data Fabric Market, By Country
Table7 North America: Data Fabric Market, By Application
Table8 North America: Data Fabric Market, By Type
Table9 North America: Data Fabric Market, By Service
Table10 North America: Data Fabric Market, By Vertical
Table11 Europe: Data Fabric Market, By Country
Table12 Europe: Data Fabric Market, By Application
Table13 Europe: Data Fabric Market, By Type
Table14 Europe: Data Fabric Market, By Service
Table15 Europe: Data Fabric Market, By Vertical
Table16 Asia-Pacific: Data Fabric Market, By Country
Table17 Asia-Pacific Data Fabric Market, By Application
Table18 Asia-Pacific Data Fabric Market, By Type
Table19 Asia-Pacific Data Fabric Market, By Service
Table20 Asia-Pacific Data Fabric Market, By Vertical
Table21 Middle East & Africa: Data Fabric Market, By Country
Table22 Middle East & Africa: Data Fabric Market, By Application
Table23 Middle East & Africa: Data Fabric Market, By Type
Table24 Middle East & Africa: Data Fabric Market, By Service
Table25 Middle East & Africa: Data Fabric Market, By Vertical
Table26 Latin America: Data Fabric Market, By Country
Table27 Latin America: Data Fabric Market, By Application
Table28 Latin America: Data Fabric Market, By Type
Table29 Latin America: Data Fabric Market, By Service
Table30 Latin America: Data Fabric Market, By Vertical
LIST OF FIGURES
Figure 1 Global Data Fabric Market segmentation
Figure 2 Forecast Methodology
Figure 3 Porter’s Five Forces Analysis of Global Data Fabric Market
Figure 4 Value Chain of Global Data Fabric Market
Figure 5 Share of Data Fabric Market in 2018, by country (in %)
Figure 6 Global Data Fabric Market, 2018–2023
Figure 7 Global Data Fabric Market Size, by Application, 2018–2023
Figure 8 Share of Global Data Fabric Market, by Application, 2018
Figure 9 Global Data Fabric Market Size, by Type, 2018–2023
Figure 10 Share of Global Data Fabric Market, by Type, 2018
Figure 11 Global Data Fabric Market Size, by Service, 2018–2023
Figure 12 Share of Global Data Fabric Market, by Service, 2018
Figure 13 Global Data Fabric Market Size, by Vertical, 2018–2023
Figure 14 Share of Global Data Fabric Market, by Vertical, 2018