ID: MRFR/ICT/9291-HCR | August 2022 | Region: Global | 100 Pages
TABLE OF CONTENTS
1. EXECUTIVE SUMMARY
1.1. Market Attractiveness Analysis
1.1.1. Global Data Acquisition (DAQ) System Market, by Type
1.1.2. Global Data Acquisition (DAQ) System Market, by Speed
1.1.3. Global Data Acquisition (DAQ) System Market, by Application
1.1.4. Global Data Acquisition (DAQ) System Market, by Vertical
1.1.5. Global Data Acquisition (DAQ) System Market, by Region
2. MARKET INTRODUCTION
2.1. Definition
2.2. Scope of the Study
2.3. Market Structure
3. RESEARCH METHODOLOGY
3.1. Research Process
3.2. Primary Research
3.3. Secondary Research
3.4. Market Size Estimation
3.5. List of Assumptions
4. MARKET DYNAMICS
4.1. Introduction
4.2. Drivers
4.2.1. Rising emphasis on data monitoring in end user sectors
4.2.2. Increasing implementation of Industry 4.0 across aerospace and automotive sectors
4.2.3. Growing advancements and flexibility of DAQ systems
4.2.4. Drivers Impact
4.3. Restraint
4.3.1. Cost and complexity of DAQ systems
4.3.2. Restraints Impact
4.4. Opportunity
4.4.1.1. Growing demand for high-speed connectivity technologies like 5G
4.5. Challenge
4.5.1. Highly competitive market
4.6. Impact of COVID-19
4.6.1. Impact on the overall market
4.6.2. Impact on the industry verticals
4.6.3. Impact on the market players
5. MARKET FACTOR ANALYSIS
5.1. Value Chain Analysis/Supply Chain Analysis
5.2. Porterβs Five Forces Model
5.2.1. Bargaining Power of Suppliers
5.2.2. Bargaining Power of Buyers
5.2.3. Threat of New Entrants
5.2.4. Threat of Substitutes
5.2.5. Intensity of Rivalry
6. GLOBAL DATA ACQUISITION (DAQ) SYSTEM MARKET, BY TYPE
6.1. Introduction
6.2. Hardware
6.3. Software
7. GLOBAL DATA ACQUISITION (DAQ) SYSTEM MARKET, BY SPEED
7.1. Introduction
7.2. High-speed (>100 KS/S)
7.3. Low-speed (<100 KS/S)
8. GLOBAL DATA ACQUISITION (DAQ) SYSTEM MARKET, BY APPLICATION
8.1. Introduction
8.2. R&D
8.3. Field
8.4. Manufacturing
9. GLOBAL DATA ACQUISITION (DAQ) SYSTEM MARKET, BY VERTICAL
9.1. Introduction
9.2. Automotive & Transportation
9.3. Aerospace & Defense
9.4. Wireless Communications & Infrastructure
9.5. Power & Energy
9.6. Environmental Monitoring
9.7. Healthcare
9.8. Food & beverage
9.9. Other
10. GLOBAL DATA ACQUISITION (DAQ) SYSTEM MARKET, BY REGION
10.1. Overview
10.2. North America
10.2.1. Market Size & Estimates, by Country, 2018β2028
10.2.2. Market Size & Estimates, By Type, 2018β2028
10.2.3. Market Size & Estimates, by Speed, 2018β2028
10.2.4. Market Size & Estimates, by Application, 2018β2028
10.2.5. Market Size & Estimates, by Vertical, 2018β2028
10.2.6. US
10.2.6.1. Market Size & Estimates, By Type, 2018β2028
10.2.6.2. Market Size & Estimates, by Speed, 2018β2028
10.2.6.3. Market Size & Estimates, by Application, 2018β2028
10.2.6.4. Market Size & Estimates, by Vertical, 2018β2028
10.2.7. Canada
10.2.7.1. Market Size & Estimates, By Type, 2018β2028
10.2.7.2. Market Size & Estimates, by Speed, 2018β2028
10.2.7.3. Market Size & Estimates, by Application, 2018β2028
10.2.7.4. Market Size & Estimates, by Vertical, 2018β2028
10.2.8. Mexico
10.2.8.1. Market Size & Estimates, By Type, 2018β2028
10.2.8.2. Market Size & Estimates, by Speed, 2018β2028
10.2.8.3. Market Size & Estimates, by Application, 2018β2028
10.2.8.4. Market Size & Estimates, by Vertical, 2018β2028
10.3. Europe
10.3.1. Market Size & Estimates, by Country, 2018β2028
10.3.2. Market Size & Estimates, By Type, 2018β2028
10.3.3. Market Size & Estimates, by Speed, 2018β2028
10.3.4. Market Size & Estimates, by Application, 2018β2028
10.3.5. Market Size & Estimates, by Vertical, 2018β2028
10.3.6. Germany
10.3.6.1. Market Size & Estimates, By Type, 2018β2028
10.3.6.2. Market Size & Estimates, by Speed, 2018β2028
10.3.6.3. Market Size & Estimates, by Application, 2018β2028
10.3.6.4. Market Size & Estimates, by Vertical, 2018β2028
10.3.7. UK
10.3.7.1. Market Size & Estimates, By Type, 2018β2028
10.3.7.2. Market Size & Estimates, by Speed, 2018β2028
10.3.7.3. Market Size & Estimates, by Application, 2018β2028
10.3.7.4. Market Size & Estimates, by Vertical, 2018β2028
10.3.8. France
10.3.8.1. Market Size & Estimates, By Type, 2018β2028
10.3.8.2. Market Size & Estimates, by Speed, 2018β2028
10.3.8.3. Market Size & Estimates, by Application, 2018β2028
10.3.8.4. Market Size & Estimates, by Vertical, 2018β2028
10.3.9. Rest of Europe
10.3.9.1. Market Size & Estimates, By Type, 2018β2028
10.3.9.2. Market Size & Estimates, by Speed, 2018β2028
10.3.9.3. Market Size & Estimates, by Application, 2018β2028
10.3.9.4. Market Size & Estimates, by Vertical, 2018β2028
10.4. Asia Pacific
10.4.1. Market Size & Estimates, by Country, 2018β2028
10.4.2. Market Size & Estimates, By Type, 2018β2028
10.4.3. Market Size & Estimates, by Speed, 2018β2028
10.4.4. Market Size & Estimates, by Application, 2018β2028
10.4.5. Market Size & Estimates, by Vertical, 2018β2028
10.4.6. China
10.4.6.1. Market Size & Estimates, By Type, 2018β2028
10.4.6.2. Market Size & Estimates, by Speed, 2018β2028
10.4.6.3. Market Size & Estimates, by Application, 2018β2028
10.4.6.4. Market Size & Estimates, by Vertical, 2018β2028
10.4.7. Japan
10.4.7.1. Market Size & Estimates, By Type, 2018β2028
10.4.7.2. Market Size & Estimates, by Speed, 2018β2028
10.4.7.3. Market Size & Estimates, by Application, 2018β2028
10.4.7.4. Market Size & Estimates, by Vertical, 2018β2028
10.4.8. India
10.4.8.1. Market Size & Estimates, By Type, 2018β2028
10.4.8.2. Market Size & Estimates, by Speed, 2018β2028
10.4.8.3. Market Size & Estimates, by Application, 2018β2028
10.4.8.4. Market Size & Estimates, by Vertical, 2018β2028
10.4.9. Rest of Asia-Pacific
10.4.9.1. Market Size & Estimates, By Type, 2018β2028
10.4.9.2. Market Size & Estimates, by Speed, 2018β2028
10.4.9.3. Market Size & Estimates, by Application, 2018β2028
10.4.9.4. Market Size & Estimates, by Vertical, 2018β2028
10.5. Middle East & Africa
10.5.1. Market Size & Estimates, By Type, 2018β2028
10.5.2. Market Size & Estimates, by Speed, 2018β2028
10.5.3. Market Size & Estimates, by Application, 2018β2028
10.5.4. Market Size & Estimates, by Vertical, 2018β2028
10.6. South America
10.6.1. Market Size & Estimates, By Type, 2018β2028
10.6.2. Market Size & Estimates, by Speed, 2018β2028
10.6.3. Market Size & Estimates, by Application, 2018β2028
10.6.4. Market Size & Estimates, by Vertical, 2018β2028
11. COMPETITIVE LANDSCAPE
11.1. Introduction
11.2. Key Players Market Share Analysis, 2020 (%)
11.3. Competitive Benchmarking
11.4. Competitor Dashboard
11.5. Major Growth Strategy in the market
11.6. Key Developments & Growth Strategies
11.6.1. New Product Development
11.6.2. Mergers & Acquisitions
11.6.3. Contracts & Agreements
12. COMPANY PROFILES
12.1. National Instruments Corp
12.1.1. Company Overview
12.1.2. Financial Overview
12.1.3. Products Offered
12.1.4. Key Developments
12.1.5. SWOT Analysis
12.1.6. Key Strategies
12.2. Siemens Digital Industries Software
12.2.1. Company Overview
12.2.2. Financial Overview
12.2.3. Products Offered
12.2.4. Key Developments
12.2.5. SWOT Analysis
12.2.6. Key Strategies
12.3. Teledyne Technologies Incorporated
12.3.1. Company Overview
12.3.2. Financial Overview
12.3.3. Products Offered
12.3.4. Key Developments
12.3.5. SWOT Analysis
12.4. Yokogawa Electric Corporation
12.4.1. Company Overview
12.4.2. Financial Overview
12.4.3. Products Offered
12.4.4. Key Developments
12.4.5. SWOT Analysis
12.4.6. Key Strategies
12.5. Spectris PLC
12.5.1. Company Overview
12.5.2. Financial Overview
12.5.3. Products Offered
12.5.4. Key Developments
12.5.5. SWOT Analysis
12.5.6. Key Strategies
12.6. Emerson Electric Co
12.6.1. Company Overview
12.6.2. Financial Overview
12.6.3. Products Offered
12.6.4. Key Developments
12.6.5. SWOT Analysis
12.6.6. Key Strategies
12.7. General Electric
12.7.1. Company Overview
12.7.2. Financial Overview
12.7.3. Products Offered
12.7.4. Key Developments
12.7.5. SWOT Analysis
12.7.6. Key Strategies
12.8. Honeywell International Inc.
12.8.1. Company Overview
12.8.2. Financial Overview
12.8.3. Products Offered
12.8.4. Key Developments
12.8.5. SWOT Analysis
12.8.6. Key Strategies
12.9. Rockwell Automation Corporation
12.9.1. Company Overview
12.9.2. Financial Overview
12.9.3. Products Offered
12.9.4. Key Developments
12.9.5. SWOT Analysis
12.9.6. Key Strategies
12.10. Schneider Electric
12.10.1. Company Overview
12.10.2. Financial Overview
12.10.3. Products Offered
12.10.4. Key Developments
12.10.5. SWOT Analysis
12.10.6. Key Strategies
12.11. AMETEK, Inc
12.11.1. Company Overview
12.11.2. Financial Overview
12.11.3. Products Offered
12.11.4. Key Developments
12.11.5. SWOT Analysis
12.11.6. Key Strategies
12.12. Graphtec Corporation
12.12.1. Company Overview
12.12.2. Financial Overview
12.12.3. Products Offered
12.12.4. Key Developments
12.12.5. SWOT Analysis
12.12.6. Key Strategies
12.13. Hioki E.E. Corporation
12.13.1. Company Overview
12.13.2. Financial Overview
12.13.3. Products Offered
12.13.4. Key Developments
12.13.5. SWOT Analysis
12.13.6. Key Strategies
12.14. Curtiss-Wright Corporation
12.14.1. Company Overview
12.14.2. Financial Overview
12.14.3. Products Offered
12.14.4. Key Developments
12.14.5. SWOT Analysis
12.14.6. Key Strategies
12.15. Dataforth Corporation
12.15.1. Company Overview
12.15.2. Financial Overview
12.15.3. Products Offered
12.15.4. Key Developments
12.15.5. SWOT Analysis
12.15.6. Key Strategies
LIST OF TABLES
TABLE 1 LIST OF ASSUMPTIONS
TABLE 2 GLOBAL DATA ACQUISITION (DAQ) SYSTEM MARKET, BY TYPE, 2018β2028 (USD MILLION)
TABLE 3 GLOBAL DATA ACQUISITION (DAQ) SYSTEM MARKET, BY SPEED, 2018β2028 (USD MILLION)
TABLE 4 GLOBAL DATA ACQUISITION (DAQ) SYSTEM MARKET, BY APPLICATION, 2018β2028 (USD MILLION
TABLE 5 GLOBAL DATA ACQUISITION (DAQ) SYSTEM MARKET, BY VERTICAL, 2018β2028 (USD MILLION)
TABLE 6 GLOBAL DATA ACQUISITION (DAQ) SYSTEM MARKET, BY REGION, 2018β2028 (USD MILLION)
TABLE 7 NORTH AMERICA: DATA ACQUISITION (DAQ) SYSTEM MARKET, BY COUNTRY, 2018β2028 (USD MILLION)
TABLE 8 NORTH AMERICA: DATA ACQUISITION (DAQ) SYSTEM MARKET, BY TYPE, 2018β2028 (USD MILLION)
TABLE 9 NORTH AMERICA: DATA ACQUISITION (DAQ) SYSTEM MARKET, BY SPEED, 2018β2028 (USD MILLION)
TABLE 10 NORTH AMERICA: DATA ACQUISITION (DAQ) SYSTEM MARKET, BY APPLICATION, 2018β2028 (USD MILLION)
TABLE 11 NORTH AMERICA: DATA ACQUISITION (DAQ) SYSTEM MARKET, BY VERTICAL, 2018β2028 (USD MILLION)
TABLE 12 US: DATA ACQUISITION (DAQ) SYSTEM MARKET, BY TYPE, 2018β2028 (USD MILLION)
TABLE 13 US: DATA ACQUISITION (DAQ) SYSTEM MARKET, BY SPEED, 2018β2028 (USD MILLION)
TABLE 14 US: DATA ACQUISITION (DAQ) SYSTEM MARKET, BY APPLICATION, 2018β2028 (USD MILLION)
TABLE 15 US: DATA ACQUISITION (DAQ) SYSTEM MARKET, BY VERTICAL, 2018β2028 (USD MILLION)
TABLE 16 CANADA: DATA ACQUISITION (DAQ) SYSTEM MARKET, BY TYPE, 2018β2028 (USD MILLION)
TABLE 17 CANADA: DATA ACQUISITION (DAQ) SYSTEM MARKET, BY SPEED, 2018β2028 (USD MILLION)
TABLE 18 CANADA DATA ACQUISITION (DAQ) SYSTEM MARKET, BY APPLICATION, 2018β2028 (USD MILLION)
TABLE 19 CANADA: DATA ACQUISITION (DAQ) SYSTEM MARKET, BY VERTICAL, 2018β2028 (USD MILLION)
TABLE 20 MEXICO: DATA ACQUISITION (DAQ) SYSTEM MARKET, BY TYPE, 2018β2028 (USD MILLION)
TABLE 21 MEXICO: DATA ACQUISITION (DAQ) SYSTEM MARKET, BY SPEED, 2018β2028 (USD MILLION)
TABLE 22 MEXICO: DATA ACQUISITION (DAQ) SYSTEM MARKET, BY APPLICATION, 2018β2028 (USD MILLION
TABLE 23 MEXICO: DATA ACQUISITION (DAQ) SYSTEM MARKET, BY VERTICAL, 2018β2028 (USD MILLION)
TABLE 24 EUROPE: DATA ACQUISITION (DAQ) SYSTEM MARKET, BY COUNTRY, 2018β2028 (USD MILLION)
TABLE 25 EUROPE: DATA ACQUISITION (DAQ) SYSTEM MARKET, BY TYPE, 2018β2028 (USD MILLION)
TABLE 26 EUROPE: DATA ACQUISITION (DAQ) SYSTEM MARKET, BY SPEED, 2018β2028 (USD MILLION)
TABLE 27 EUROPE: DATA ACQUISITION (DAQ) SYSTEM MARKET, BY APPLICATION, 2018β2028 (USD MILLION)
TABLE 28 EUROPE DATA ACQUISITION (DAQ) SYSTEM MARKET, BY VERTICAL, 2018β2028 (USD MILLION)
TABLE 29 UK: DATA ACQUISITION (DAQ) SYSTEM MARKET, BY TYPE, 2018β2028 (USD MILLION)
TABLE 30 UK: DATA ACQUISITION (DAQ) SYSTEM MARKET, BY SPEED, 2018β2028 (USD MILLION)
TABLE 31 UK: DATA ACQUISITION (DAQ) SYSTEM MARKET, BY APPLICATION, 2018β2028 (USD MILLION)
TABLE 32 UK: DATA ACQUISITION (DAQ) SYSTEM MARKET, BY VERTICAL, 2018β2028 (USD MILLION)
TABLE 33 GERMANY: DATA ACQUISITION (DAQ) SYSTEM MARKET, BY TYPE, 2018β2028 (USD MILLION)
TABLE 34 GERMANY: DATA ACQUISITION (DAQ) SYSTEM MARKET, BY SPEED, 2018β2028 (USD MILLION)
TABLE 35 GERMANY: DATA ACQUISITION (DAQ) SYSTEM MARKET, BY APPLICATION, 2018β2028 (USD MILLION)
TABLE 36 GERMANY: DATA ACQUISITION (DAQ) SYSTEM MARKET, BY VERTICAL, 2018β2028 (USD MILLION)
TABLE 37 FRANCE: DATA ACQUISITION (DAQ) SYSTEM MARKET, BY TYPE, 2018β2028 (USD MILLION)
TABLE 38 FRANCE: DATA ACQUISITION (DAQ) SYSTEM MARKET, BY SPEED, 2018β2028 (USD MILLION)
TABLE 39 FRANCE: DATA ACQUISITION (DAQ) SYSTEM MARKET, BY APPLICATION, 2018β2028 (USD MILLION)
TABLE 40 FRANCE: DATA ACQUISITION (DAQ) SYSTEM MARKET, BY VERTICAL, 2018β2028 (USD MILLION)
TABLE 41 REST OF EUROPE: DATA ACQUISITION (DAQ) SYSTEM MARKET, BY TYPE, 2018β2028 (USD MILLION)
TABLE 42 REST OF EUROPE: DATA ACQUISITION (DAQ) SYSTEM MARKET, BY SPEED, 2018β2028 (USD MILLION)
TABLE 43 REST OF EUROPE: DATA ACQUISITION (DAQ) SYSTEM MARKET, BY APPLICATION, 2018β2028 (USD MILLION)
TABLE 44 REST OF EUROPE: DATA ACQUISITION (DAQ) SYSTEM MARKET, BY VERTICAL, 2018β2028 (USD MILLION)
TABLE 45 ASIA PACIFIC: DATA ACQUISITION (DAQ) SYSTEM MARKET, BY COUNTRY, 2018β2028 (USD MILLION)
TABLE 46 ASIA PACIFIC: DATA ACQUISITION (DAQ) SYSTEM MARKET, BY TYPE, 2018β2028 (USD MILLION)
TABLE 47 ASIA PACIFIC: DATA ACQUISITION (DAQ) SYSTEM MARKET, BY SPEED, 2018β2028 (USD MILLION)
TABLE 48 ASIA PACIFIC: DATA ACQUISITION (DAQ) SYSTEM MARKET, BY APPLICATION, 2018β2028 (USD MILLION)
TABLE 49 ASIA PACIFIC: DATA ACQUISITION (DAQ) SYSTEM MARKET, BY VERTICAL, 2018β2028 (USD MILLION)
TABLE 50 CHINA: DATA ACQUISITION (DAQ) SYSTEM MARKET, BY TYPE, 2018β2028 (USD MILLION)
TABLE 51 CHINA: DATA ACQUISITION (DAQ) SYSTEM MARKET, BY SPEED, 2018β2028 (USD MILLION)
TABLE 52 CHINA: DATA ACQUISITION (DAQ) SYSTEM MARKET, BY APPLICATION, 2018β2028 (USD MILLION)
TABLE 53 CHINA: DATA ACQUISITION (DAQ) SYSTEM MARKET, BY VERTICAL, 2018β2028 (USD MILLION)
TABLE 54 JAPAN: DATA ACQUISITION (DAQ) SYSTEM MARKET, BY TYPE, 2018β2028 (USD MILLION)
TABLE 55 JAPAN: DATA ACQUISITION (DAQ) SYSTEM MARKET, BY SPEED, 2018β2028 (USD MILLION)
TABLE 56 JAPAN: DATA ACQUISITION (DAQ) SYSTEM MARKET, BY APPLICATION, 2018β2028 (USD MILLION)
TABLE 57 JAPAN: DATA ACQUISITION (DAQ) SYSTEM MARKET, BY VERTICAL, 2018β2028 (USD MILLION)
TABLE 58 INDIA: DATA ACQUISITION (DAQ) SYSTEM MARKET, BY TYPE, 2018β2028 (USD MILLION)
TABLE 59 INDIA: DATA ACQUISITION (DAQ) SYSTEM MARKET, BY SPEED, 2018β2028 (USD MILLION)
TABLE 60 INDIA: DATA ACQUISITION (DAQ) SYSTEM MARKET, BY APPLICATION, 2018β2028 (USD MILLION)
TABLE 61 INDIA: DATA ACQUISITION (DAQ) SYSTEM MARKET, BY VERTICAL, 2018β2028 (USD MILLION)
TABLE 62 REST OF ASIA PACIFIC: DATA ACQUISITION (DAQ) SYSTEM MARKET, BY TYPE, 2018β2028 (USD MILLION)
TABLE 63 REST OF ASIA PACIFIC: DATA ACQUISITION (DAQ) SYSTEM MARKET, BY SPEED, 2018β2028 (USD MILLION)
TABLE 64 REST OF ASIA PACIFIC: DATA ACQUISITION (DAQ) SYSTEM MARKET, BY APPLICATION, 2018β2028 (USD MILLION)
TABLE 65 REST OF ASIA PACIFIC: DATA ACQUISITION (DAQ) SYSTEM MARKET, BY VERTICAL, 2018β2028 (USD MILLION)
TABLE 66 MIDDLE EAST & AFRICA: DATA ACQUISITION (DAQ) SYSTEM MARKET, BY TYPE, 2018β2028 (USD MILLION)
TABLE 67 MIDDLE EAST & AFRICA: DATA ACQUISITION (DAQ) SYSTEM MARKET, BY SPEED, 2018β2028 (USD MILLION)
TABLE 68 MIDDLE EAST & AFRICA: DATA ACQUISITION (DAQ) SYSTEM MARKET, BY APPLICATION, 2018β2028 (USD MILLION)
TABLE 69 MIDDLE EAST & AFRICA: DATA ACQUISITION (DAQ) SYSTEM MARKET, BY VERTICAL, 2018β2028 (USD MILLION)
TABLE 70 SOUTH AMERICA: DATA ACQUISITION (DAQ) SYSTEM MARKET, BY TYPE, 2018β2028 (USD MILLION)
TABLE 71 SOUTH AMERICA: DATA ACQUISITION (DAQ) SYSTEM MARKET, BY SPEED, 2018β2028 (USD MILLION)
TABLE 72 SOUTH AMERICA: DATA ACQUISITION (DAQ) SYSTEM MARKET, BY APPLICATION, 2018β2028 (USD MILLION)
TABLE 73 SOUTH AMERICA: DATA ACQUISITION (DAQ) SYSTEM MARKET, BY VERTICAL, 2018β2028 (USD MILLION)
β
β
LIST OF FIGURES
FIGURE 1 MARKET SYNOPSIS
FIGURE 2 RESEARCH PROCESS OF MRFR
FIGURE 3 TOP DOWN & BOTTOM-UP APPROACH
FIGURE 4 GLOBAL DATA ACQUISITION (DAQ) SYSTEM MARKET, BY TYPE, 2018β2028 (USD MILLION)
FIGURE 5 GLOBAL DATA ACQUISITION (DAQ) SYSTEM MARKET, BY SPEED, 2018β2028 (USD MILLION)
FIGURE 6 GLOBAL DATA ACQUISITION (DAQ) SYSTEM MARKET, BY APPLICATION, 2018β2028 (USD MILLION)
FIGURE 7 GLOBAL DATA ACQUISITION (DAQ) SYSTEM MARKET, BY VERTICAL, 2018β2028 (USD MILLION)
FIGURE 8 GLOBAL DATA ACQUISITION (DAQ) SYSTEM MARKET, BY REGION, 2018β2028 (USD MILLION)
FIGURE 9 NORTH AMERICA: DATA ACQUISITION (DAQ) SYSTEM MARKET, BY COUNTRY, 2018β2028 (USD MILLION)
FIGURE 10 NORTH AMERICA: DATA ACQUISITION (DAQ) SYSTEM MARKET, BY TYPE, 2018β2028 (USD MILLION)
FIGURE 11 NORTH AMERICA: DATA ACQUISITION (DAQ) SYSTEM MARKET, BY SPEED, 2018β2028 (USD MILLION)
FIGURE 12 NORTH AMERICA: DATA ACQUISITION (DAQ) SYSTEM MARKET, BY APPLICATION, 2018β2028 (USD MILLION)
FIGURE 13 NORTH AMERICA: DATA ACQUISITION (DAQ) SYSTEM MARKET, BY VERTICAL, 2018β2028 (USD MILLION)
FIGURE 14 US: DATA ACQUISITION (DAQ) SYSTEM MARKET, BY TYPE, 2018β2028 (USD MILLION)
FIGURE 15 US: DATA ACQUISITION (DAQ) SYSTEM MARKET, BY SPEED, 2018β2028 (USD MILLION)
FIGURE 16 US: DATA ACQUISITION (DAQ) SYSTEM MARKET, BY APPLICATION, 2018β2028 (USD MILLION)
FIGURE 17 US: DATA ACQUISITION (DAQ) SYSTEM MARKET, BY VERTICAL, 2018β2028 (USD MILLION)
FIGURE 18 CANADA: DATA ACQUISITION (DAQ) SYSTEM MARKET, BY TYPE, 2018β2028 (USD MILLION)
FIGURE 19 CANADA: DATA ACQUISITION (DAQ) SYSTEM MARKET, BY SPEED, 2018β2028 (USD MILLION)
FIGURE 20 CANADA: DATA ACQUISITION (DAQ) SYSTEM MARKET, BY APPLICATION, 2018β2028 (USD MILLION)
FIGURE 21 CANADA: DATA ACQUISITION (DAQ) SYSTEM MARKET, BY VERTICAL, 2018β2028 (USD MILLION)
FIGURE 22 MEXICO: DATA ACQUISITION (DAQ) SYSTEM MARKET, BY TYPE, 2018β2028 (USD MILLION)
FIGURE 23 MEXICO: DATA ACQUISITION (DAQ) SYSTEM MARKET, BY SPEED, 2018β2028 (USD MILLION)
FIGURE 24 MEXICO: DATA ACQUISITION (DAQ) SYSTEM MARKET, BY APPLICATION, 2018β2028 (USD MILLION
FIGURE 25 MEXICO: DATA ACQUISITION (DAQ) SYSTEM MARKET, BY VERTICAL, 2018β2028 (USD MILLION)
FIGURE 26 EUROPE: DATA ACQUISITION (DAQ) SYSTEM MARKET, BY COUNTRY, 2018β2028 (USD MILLION)
FIGURE 27 EUROPE: DATA ACQUISITION (DAQ) SYSTEM MARKET, BY TYPE, 2018β2028 (USD MILLION)
FIGURE 28 EUROPE: DATA ACQUISITION (DAQ) SYSTEM MARKET, BY SPEED, 2018β2028 (USD MILLION)
FIGURE 29 EUROPE: DATA ACQUISITION (DAQ) SYSTEM MARKET, BY APPLICATION, 2018β2028 (USD MILLION)
FIGURE 30 EUROPE: DATA ACQUISITION (DAQ) SYSTEM MARKET, BY VERTICAL, 2018β2028 (USD MILLION)
FIGURE 31 UK: DATA ACQUISITION (DAQ) SYSTEM MARKET, BY TYPE, 2018β2028 (USD MILLION)
FIGURE 32 UK: DATA ACQUISITION (DAQ) SYSTEM MARKET, BY SPEED, 2018β2028 (USD MILLION)
FIGURE 33 UK: DATA ACQUISITION (DAQ) SYSTEM MARKET, BY APPLICATION, 2018β2028 (USD MILLION)
FIGURE 34 UK: DATA ACQUISITION (DAQ) SYSTEM MARKET, BY VERTICAL, 2018β2028 (USD MILLION)
FIGURE 35 GERMANY: DATA ACQUISITION (DAQ) SYSTEM MARKET, BY TYPE, 2018β2028 (USD MILLION)
FIGURE 36 GERMANY: DATA ACQUISITION (DAQ) SYSTEM MARKET, BY SPEED, 2018β2028 (USD MILLION)
FIGURE 37 GERMANY: DATA ACQUISITION (DAQ) SYSTEM MARKET, BY APPLICATION, 2018β2028 (USD MILLION)
FIGURE 38 GERMANY: DATA ACQUISITION (DAQ) SYSTEM MARKET, BY VERTICAL, 2018β2028 (USD MILLION)
FIGURE 39 FRANCE: DATA ACQUISITION (DAQ) SYSTEM MARKET, BY TYPE, 2018β2028 (USD MILLION)
FIGURE 40 FRANCE: DATA ACQUISITION (DAQ) SYSTEM MARKET, BY SPEED, 2018β2028 (USD MILLION)
FIGURE 41 FRANCE: DATA ACQUISITION (DAQ) SYSTEM MARKET, BY APPLICATION, 2018β2028 (USD MILLION)
FIGURE 42 FRANCE: DATA ACQUISITION (DAQ) SYSTEM MARKET, BY VERTICAL, 2018β2028 (USD MILLION)
FIGURE 43 REST OF EUROPE: DATA ACQUISITION (DAQ) SYSTEM MARKET, BY TYPE, 2018β2028 (USD MILLION)
FIGURE 44 REST OF EUROPE: DATA ACQUISITION (DAQ) SYSTEM MARKET, BY SPEED, 2018β2028 (USD MILLION)
FIGURE 45 REST OF EUROPE: DATA ACQUISITION (DAQ) SYSTEM MARKET, BY APPLICATION, 2018β2028 (USD MILLION)
FIGURE 46 REST OF EUROPE: DATA ACQUISITION (DAQ) SYSTEM MARKET, BY VERTICAL, 2018β2028 (USD MILLION)
FIGURE 47 ASIA PACIFIC: DATA ACQUISITION (DAQ) SYSTEM MARKET, BY COUNTRY, 2018β2028 (USD MILLION)
FIGURE 48 ASIA PACIFIC: DATA ACQUISITION (DAQ) SYSTEM MARKET, BY TYPE, 2018β2028 (USD MILLION)
FIGURE 49 ASIA PACIFIC: DATA ACQUISITION (DAQ) SYSTEM MARKET, BY SPEED, 2018β2028 (USD MILLION)
FIGURE 50 ASIA PACIFIC: DATA ACQUISITION (DAQ) SYSTEM MARKET, BY APPLICATION, 2018β2028 (USD MILLION)
FIGURE 51 ASIA PACIFIC: DATA ACQUISITION (DAQ) SYSTEM MARKET, BY VERTICAL, 2018β2028 (USD MILLION)
FIGURE 52 CHINA: DATA ACQUISITION (DAQ) SYSTEM MARKET, BY TYPE, 2018β2028 (USD MILLION)
FIGURE 53 CHINA: DATA ACQUISITION (DAQ) SYSTEM MARKET, BY SPEED, 2018β2028 (USD MILLION)
FIGURE 54 CHINA: DATA ACQUISITION (DAQ) SYSTEM MARKET, BY APPLICATION, 2018β2028 (USD MILLION)
FIGURE 55 CHINA: DATA ACQUISITION (DAQ) SYSTEM MARKET, BY VERTICAL, 2018β2028 (USD MILLION)
FIGURE 56 JAPAN: DATA ACQUISITION (DAQ) SYSTEM MARKET, BY TYPE, 2018β2028 (USD MILLION)
FIGURE 57 JAPAN: DATA ACQUISITION (DAQ) SYSTEM MARKET, BY SPEED, 2018β2028 (USD MILLION)
FIGURE 58 JAPAN: DATA ACQUISITION (DAQ) SYSTEM MARKET, BY APPLICATION, 2018β2028 (USD MILLION)
FIGURE 59 JAPAN: DATA ACQUISITION (DAQ) SYSTEM MARKET, BY VERTICAL, 2018β2028 (USD MILLION)
FIGURE 60 INDIA: DATA ACQUISITION (DAQ) SYSTEM MARKET, BY TYPE, 2018β2028 (USD MILLION)
FIGURE 61 INDIA: DATA ACQUISITION (DAQ) SYSTEM MARKET, BY SPEED, 2018β2028 (USD MILLION)
FIGURE 62 INDIA: DATA ACQUISITION (DAQ) SYSTEM MARKET, BY APPLICATION, 2018β2028 (USD MILLION)
FIGURE 63 INDIA: DATA ACQUISITION (DAQ) SYSTEM MARKET, BY VERTICAL, 2018β2028 (USD MILLION)
FIGURE 64 REST OF ASIA PACIFIC: DATA ACQUISITION (DAQ) SYSTEM MARKET, BY TYPE, 2018β2028 (USD MILLION)
FIGURE 65 REST OF ASIA PACIFIC: DATA ACQUISITION (DAQ) SYSTEM MARKET, BY SPEED, 2018β2028 (USD MILLION)
FIGURE 66 REST OF ASIA PACIFIC: DATA ACQUISITION (DAQ) SYSTEM MARKET, BY APPLICATION, 2018β2028 (USD MILLION)
FIGURE 67 REST OF ASIA PACIFIC: DATA ACQUISITION (DAQ) SYSTEM MARKET, BY VERTICAL, 2018β2028 (USD MILLION)
FIGURE 68 MIDDLE EAST & AFRICA: DATA ACQUISITION (DAQ) SYSTEM MARKET, BY TYPE, 2018β2028 (USD MILLION)
FIGURE 69 MIDDLE EAST & AFRICA: DATA ACQUISITION (DAQ) SYSTEM MARKET, BY SPEED, 2018β2028 (USD MILLION)
FIGURE 70 MIDDLE EAST & AFRICA: DATA ACQUISITION (DAQ) SYSTEM MARKET, BY APPLICATION, 2018β2028 (USD MILLION)
FIGURE 71 MIDDLE EAST & AFRICA: DATA ACQUISITION (DAQ) SYSTEM MARKET, BY VERTICAL, 2018β2028 (USD MILLION)
FIGURE 72 SOUTH AMERICA: DATA ACQUISITION (DAQ) SYSTEM MARKET, BY TYPE, 2018β2028 (USD MILLION)
FIGURE 73 SOUTH AMERICA: DATA ACQUISITION (DAQ) SYSTEM MARKET, BY SPEED, 2018β2028 (USD MILLION)
FIGURE 74 SOUTH AMERICA: DATA ACQUISITION (DAQ) SYSTEM MARKET, BY APPLICATION, 2018β2028 (USD MILLION)
FIGURE 75 SOUTH AMERICA: DATA ACQUISITION (DAQ) SYSTEM MARKET, BY VERTICAL, 2018β2028 (USD MILLION)
$1.6 Billion
5.9%
Asia Pacific
2021-2028
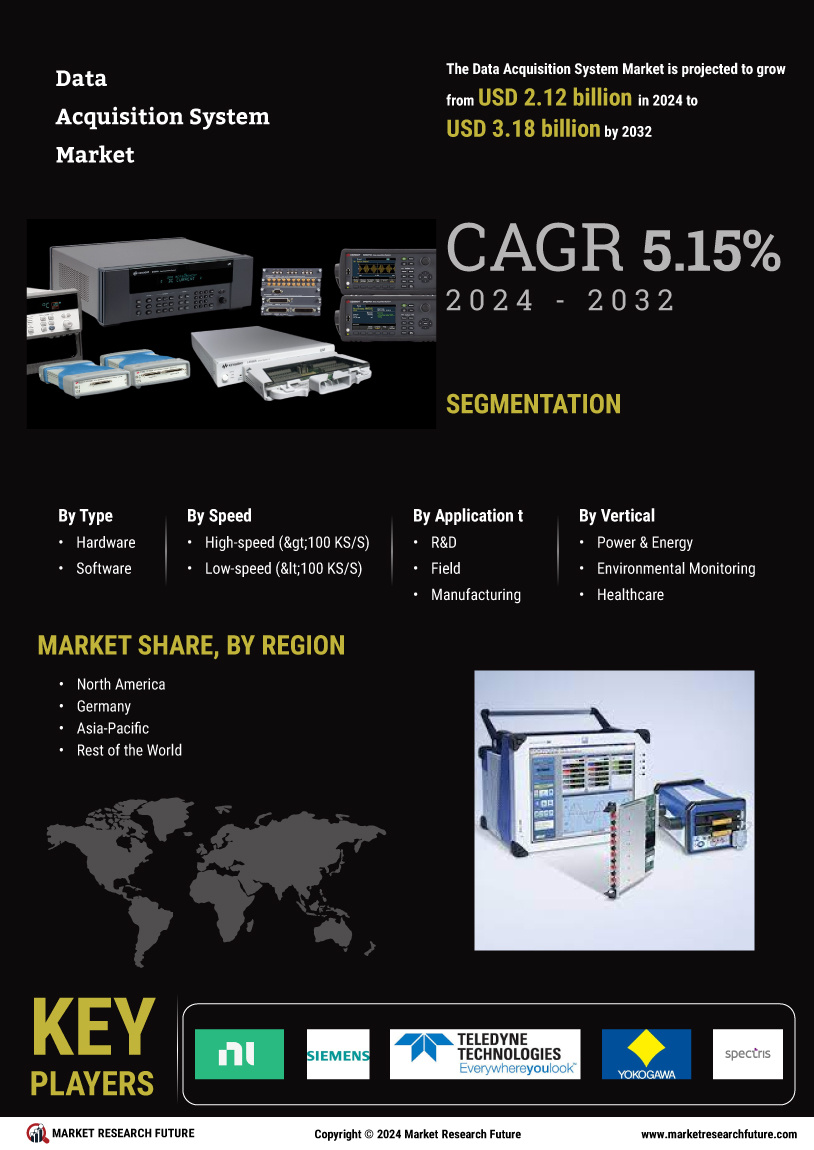
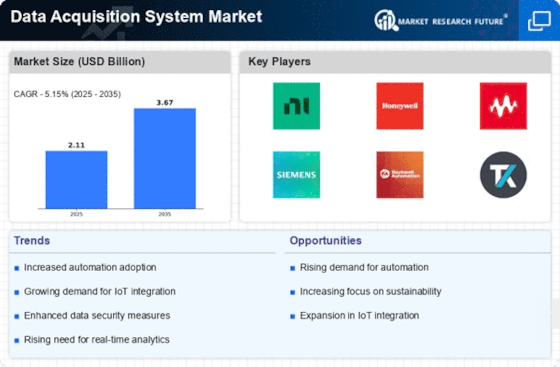
The global Data Acquisition (DAQ) System market was valued at USD 1.6 billion in 2020 and projected to reach by 2028 with a CAGR of 5.9% during the forecast period, 2021–2028.
Data acquisition is a technique for converting unit signals from real-world physical objects into digital values that can be analysed and manipulated in a computer system. The real-world signals and the computer machine are linked by the DAQ performance. A Data Acquisition System is made up of a hardware component that includes sensors and is connected to a computer. Sensors, also known as transducers, are devices that convert physical factors into electrical impulses that can be calculated. Sensor signals are converted to numerical grades by the signal circuitry.
DAQ hardware is an industrial control system that collects data from remote instruments and sensors, then describes and visualises it at a central location for monitoring and administrative reasons. Data will also be collected and analysed in real time. DAQ makes use of industry-standard computers' processing power and networking capabilities to create cost-effective, powerful, and adaptable measuring solutions. Aerospace & defence, energy & power, wireless communication, environment monitoring, food & beverage, automotive & transportation, healthcare, and other industries use data acquisition extensively.
Market Dynamics
The market for data acquisition (DAQ) systems is growing due to rising data monitoring requirements internationally and rising demand for technology for strategic decision-making in businesses. Data monitoring increases the quality of operations and aids in early fault identification in the aerospace and defence, government, energy, and automotive industries. Furthermore, data monitoring aids in increasing equipment operational efficiency with minimal human intervention.
One of the primary elements driving industrial growth is the integration of control systems with DAQ solutions, which allows real-time control and post-recording display and analysis of data. Apart from that, the food and beverage (F&B) industry's extensive adoption of supervisory control and data acquisition (SCADA) systems for increasing food quality management is positively influencing the need for DAQ systems. The use of these systems with the internet of things (IoT) in home automation systems can also be related to increased product demand.
Restraints & Challenges
Consumers of DAQ systems are price-conscious, and they seek low-cost, high-quality DAQ systems. The cost of a DAQ system, on the other hand, is determined by critical criteria such as sensors, channel counts, and the need to create a DAQ system that can withstand hard working environments. Due to technological breakthroughs in the design and development of this equipment, DAQ systems are getting increasingly sophisticated. As a result, stronger testing capabilities are necessary, and manufacturers must continually enhance their present equipment to meet the demands of specific applications.
Opportunities
To improve high-speed communication, electronics utilised in autonomous vehicle development, such as image recognition systems, speech detection systems, and other digital devices, require 5G technology. Similarly, 5G technology is being employed in the aircraft industry to improve the reliability of avionics equipment by reducing latency and increasing communication speed. Moreover, a number of countries have already begun to invest in 5G technology in order to improve their digital infrastructure and remain competitive in the digital economy. South Korea, China, the United States, and Germany are among the major countries that have adopted and deployed 5G wireless infrastructure.
Impact of COVID-19
Introduction
Every industry has been affected by the COVID-19 pandemic, including aerospace & defence, agriculture, food & beverage, automobile & transportation, chemical & material, consumer goods, retail & ecommerce, energy & power, pharma & healthcare, packaging, construction, mining & gases, electronics & semiconductor, banking financial services & insurance, ICT, and many others. In 2020, the market for DAQ systems is expected to decline. This is due to the fact that some major economies have imposed lockdowns in order to prevent the spread of COVID-19. Manufacturing activity have been severely hampered as a result of the lockdown. The key verticals for DAQ system solutions include aerospace and defence, as well as automotive and transportation.
Companies including General Motors, Ford, and Fiat Chrysler had to discontinue manufacturing. Companies like General Motors and Toyota have been following tight standards to reduce the danger of infections, making it impossible for them to return to normal production levels and begin replenishing vehicle supplies. In the aerospace and defence sector, there was also a significant drop. Between April and June, more than 25 airlines, including large Latin American carriers like LATAM Airlines, regional powerhouses like South Africa Airways, and important US and European carriers like Air Berlin, Flybe, and Miami Air, among others, filed for bankruptcy due to the pandemic outbreak. During the pandemic, all of these variables influenced the need for DAQ systems.
Value Chain Analysis/Technology Analysis/Regulatory Implications
The global data acquisition (DAQ) system market supply chain has evolved from a traditional approach to a set of highly efficient processes, including procurement, system integration, and distribution. The supply chain of the data acquisition (DAQ) system market involves conventional approach to highly efficient supply chain processes. The value chain includes the stages of design & development, system integration, and end-use industry.
Segment Overview
The global data acquisition (DAQ) system market has been segmented into type, speed, application, vertical and region/country.
Based on type, the data acquisition (DAQ) system market has been segmented into hardware and software type.
Based on speed, the data acquisition (DAQ) system market has been classified into high-speed (>100 KS/S), low speed (<100 KS/S).
Based on application, the data acquisition (DAQ) system market has been bifurcated into R&D, field, manufacturing.
By vertical, the data acquisition (DAQ) system market has been bifurcated into automotive & transportation, aerospace & defense, wireless communications & infrastructure, power & energy, environmental monitoring, healthcare, food & beverage, other.
Global Data Acquisition (DAQ) System Market, 2018–2028 (USD Billion)
Source: MRFR Analysis
Regional Analysis
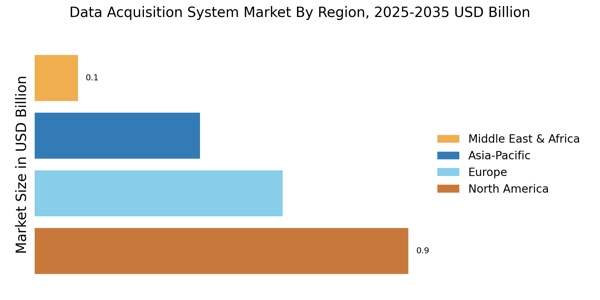
During the forecast period, the global data acquisition (DAQ) system market is estimated to generate considerable revenue from various continents. North America, Europe, Asia-Pacific, the Middle East and Africa, and South America were all included in the geographic analysis of the data acquisition (DAQ) system market. North America includes US, Canada, and Mexico. The UK, Germany, France, and the rest of Europe make up Europe. Asia-Pacific includes countries such as China, Japan, India, and the Rest of Asia-Pacific. The DAQ system market in Asia Pacific is expected to develop at the fastest growth rate. Rapid technological advancements, increased manufacturing units, stringent regulatory policies pertaining to product testing and measurement, strong government support for manufacturing and adoption of new technologies such as AI and IoT, and the presence of key industry players in the region are just a few of the major factors driving the DAQ system market growth in APAC. Due to the presence of countries such as China, Japan, and India, the country is likely to have a growing demand for DAQ solutions.
Competitive Analysis
The global market for data acquisition (DAQ) system has witnessed significant growth over the forecast period due to the growing number of data acquisition (DAQ) system players. In the data acquisition (DAQ) system market, there are a number of domestic, regional, and worldwide competitors vying for a major portion of the total market. To promote organic growth and enhance their market shares, prominent industry participants are investing in research and development initiatives. Furthermore, these companies are investing in new product development in order to broaden and reinforce their present product portfolios and attract new customers.
Key Players
The global data acquisition (DAQ) system market is characterized by the presence of several regional and local providers. Some of the key players in the market are National Instruments Corp (US), Siemens Digital Industries Software (US), Teledyne Technologies Incorporated (US), Yokogawa Electric Corporation (Japan), Spectris PLC (UK), Emerson Electric Co (US), General Electric (US), Honeywell International Inc (US), Rockwell Automation Corporation (US), Curtiss-Wright Corporation (US), Dataforth Corporation (US), Schneider Electric (France), AMETEK, Inc (US), Graphtec Corporation (Japan), Hioki E.E. Corporation (Japan)
Key Developments in Global Data Acquisition (DAQ) System Market:
Report Overview
This study estimates revenue growth at the global, regional, and country levels and offers an overview of the latest developments in each of the sub-sectors from 2018 to 2028. For this analysis, MRFR segmented the data acquisition (DAQ) system market has based on type, speed, application, vertical and region/country.
Report Attribute/Metric | Details |
---|---|
Market Size | Significant Value |
CAGR | 5.9% |
Base Year | 2020 |
Forecast Period | 2021β2028 |
Historical Data | 2018 & 2019 |
Forecast Units | Value (USD Million) |
Report Coverage | Revenue Forecast, Competitive Landscape, Growth Factors, and Trends |
Segments Covered | β’ By Type (Hardware, Software) β’ By Speed (High-speed (>100 KS/S), Low speed (<100 KS/S)) β’ By Application (R&D, Field, Manufacturing) β’ By Vertical (Automotive & Transportation, Aerospace & Defense, Power & Energy, Wireless Communications & Infrastructure, Environmental Monitoring, Healthcare, Food & beverage, Others) |
Geographies Covered | β’ North America (US, Canada, and Mexico) β’ Europe (UK, Germany, France, and Rest of Europe) β’ Asia-Pacific (China, Japan, India, and Rest of Asia-Pacific) β’ Middle East & Africa β’ South America |
Key Vendors | β’ National Instruments Corp (US) β’ Siemens Digital Industries Software (US) β’ Teledyne Technologies Incorporated (US) β’ Yokogawa Electric Corporation (Japan) β’ Spectris PLC (UK) β’ Emerson Electric Co (US) β’ General Electric (US) β’ Honeywell International Inc (US) β’ Rockwell Automation Corporation (US) β’ Schneider Electric (France) β’ AMETEK, Inc (US) β’ Graphtec Corporation (Japan) β’ Hioki E.E. Corporation (Japan) β’ Curtiss-Wright Corporation (US) β’ Dataforth Corporation (US) |
Key Market Opportunities | β’ Growing demand for high-speed connectivity technologies like 5G |
Key Market Drivers | β’ Drivers β’ Growing emphasis on data monitoring in end user sectors β’ Increasing implementation of Industry 4.0 across aerospace and automotive sectors β’ Growing advancements and flexibility of DAQ systems β’ Opportunities β’ Growing demand for high-speed connectivity technologies like 5G β’ Restraints β’ Cost and complexity of DAQ systems β’ Impact of COVID-19 β’ Impact on the overall Market β’ Impact on the industry verticals β’ Impact on the market players |
Frequently Asked Questions (FAQ) :
The global data acquisition (DAQ) system market was valued at USD 1.6 billion in 2020.
The global data acquisition (DAQ) system market is expected to exhibit an 5.9% CAGR rate by 2028.
The Asia Pacific region currently dominates the market and is expected to retain its dominance throughout the forecast period.
Major factors expected to drive the growth of the data acquisition (DAQ) system industry include growing emphasis on data monitoring in end user sectors, increasing implementation of Industry 4.0 across aerospace and automotive sectors, growing advancements and flexibility of DAQ systems.
National Instruments Corp (US), Siemens Digital Industries Software (US), Teledyne Technologies Incorporated (US), Yokogawa Electric Corporation (Japan), Spectris PLC (UK), Emerson Electric Co (US), General Electric (US), Honeywell International Inc (US), Rockwell Automation Corporation (US), Schneider Electric (France), AMETEK, Inc (US), Graphtec Corporation (Japan), Hioki E.E. Corporation (Japan), Curtiss-Wright Corporation (US), Dataforth Corporation (US).are the key companies of the global data acquisition (DAQ) system market.