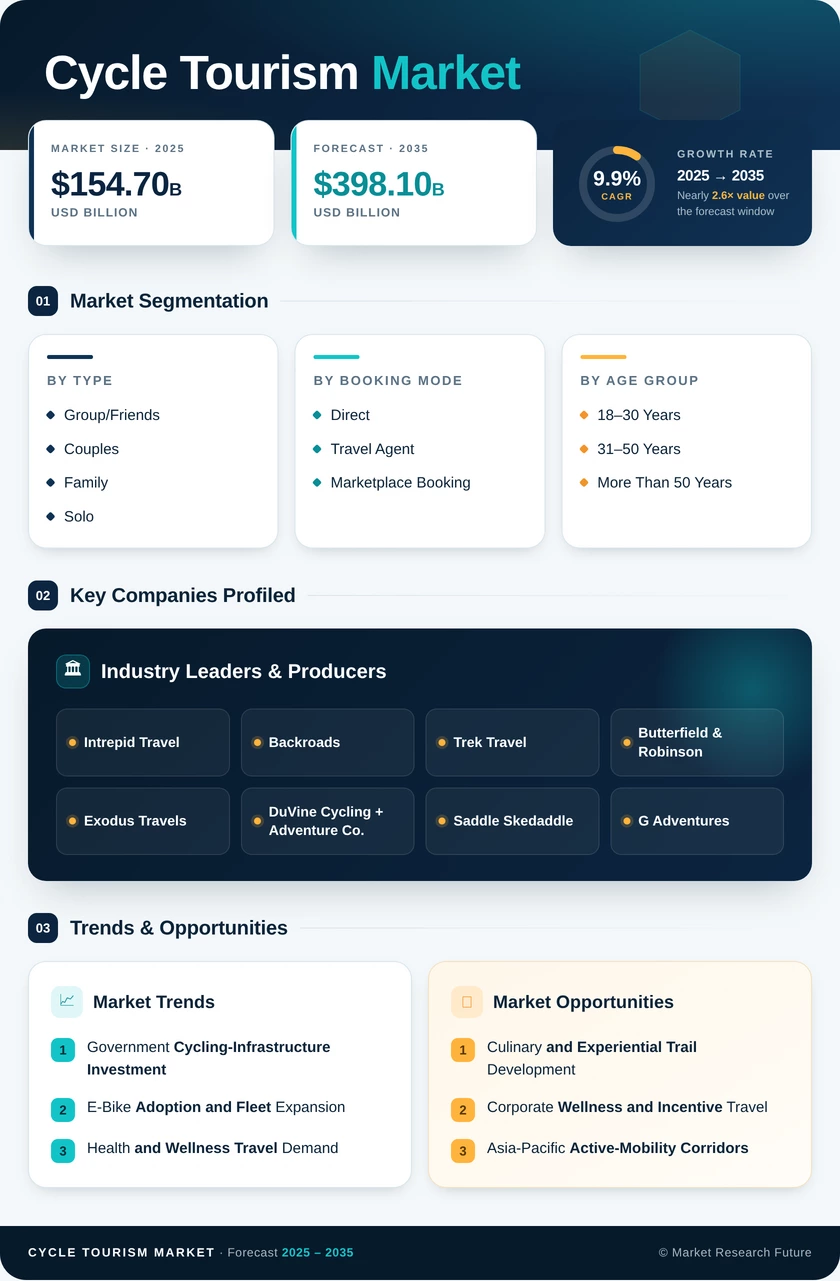
Cycle Tourism Market (2026 - 2035)

Cycle Tourism Market Size, Share, Industry Trend & Analysis Research Report By Group Type (Group/Friends, Couples, Family, Solo), By Booking Mode (Direct, Travel Agent, Marketplace Booking), By Age Group (18 to 30 Years, 31 to 50 Years, More Than 50 Years), By Geography (North America, Europe, Asia-Pacific, South America, Middle East & Africa) - Forecast to 2035

Forecast Period
2026-2035
CAGR
9.9%
2025 Market Size
USD 154.70 Billion
2035 Market Size
USD 398.10 Billion
Consumer and Retail ● Updated August 2026 Report ID: MRFR/CG/22924-HCR | Pages: 128 | Author: Snehal Singh
  1. 1 Market Overview |
    1. 1.1 Study Assumptions & Market Definition |
    2. 1.2 Scope of the Study |
    3. 1.3 Research Methodology
  2. 2 Market Summary & Key Takeaways
  3. 3 Market Dynamics |
    1. 3.1 Market Drivers Analysis | |
      1. 3.1.1 Government Cycling-Infrastructure Investment | |
      2. 3.1.2 E-Bike Adoption and Fleet Expansion | |
      3. 3.1.3 Health and Wellness Travel Demand | |
      4. 3.1.4 Digital Booking Platform Proliferation | |
      5. 3.1.5 Sustainability and Carbon-Offset Mandates | |
      6. 3.1.6 Corporate Wellness and Incentive Travel | |
      7. 3.1.7 Luggage Transfer and Comfort-Service Bundling |
    2. 3.2 Market Restraints Analysis | |
      1. 3.2.1 Seasonal Demand Concentration | |
      2. 3.2.2 Fragmented Safety and Liability Standards | |
      3. 3.2.3 Limited Cycling Infrastructure in Emerging Markets | |
      4. 3.2.4 High Upfront Cost of Premium Cycling Holidays | |
      5. 3.2.5 Route Congestion on Popular Corridors |
    3. 3.3 Market Opportunity Analysis | |
      1. 3.3.1 Culinary and Experiential Trail Development | |
      2. 3.3.2 Corporate Wellness and Incentive Travel | |
      3. 3.3.3 Asia-Pacific Active-Mobility Corridors | |
      4. 3.3.4 Data-Driven Itinerary Personalization | |
      5. 3.3.5 Gravel and Off-Road Adventure Segments |
    4. 3.4 Industry Value Chain Analysis |
    5. 3.5 Porter's Five Forces Analysis
  4. 4 Global Cycle Tourism Market Size & Forecast (2021–2035) |
    1. 4.1 Historical Market Size (2021–2025) |
    2. 4.2 Current & Forecast Market Size (2026–2035) |
    3. 4.3 Market Size by Revenue (USD Billion) |
    4. 4.4 Year-over-Year Growth Analysis
  5. 5 Segmentation Analysis |
    1. 5.1 By Group Type | |
      1. 5.1.1 Group/Friends | |
      2. 5.1.2 Couples | |
      3. 5.1.3 Family | |
      4. 5.1.4 Solo |
    2. 5.2 By Booking Mode | |
      1. 5.2.1 Direct | |
      2. 5.2.2 Travel Agent | |
      3. 5.2.3 Marketplace Booking |
    3. 5.3 By Age Group | |
      1. 5.3.1 18 to 30 Years | |
      2. 5.3.2 31 to 50 Years | |
      3. 5.3.3 More Than 50 Years
  6. 6 Regional Analysis |
    1. 6.1 North America | |
      1. 6.1.1 United States | |
      2. 6.1.2 Canada | |
      3. 6.1.3 Mexico |
    2. 6.2 Europe | |
      1. 6.2.1 Germany | |
      2. 6.2.2 United Kingdom | |
      3. 6.2.3 France | |
      4. 6.2.4 Italy | |
      5. 6.2.5 Spain | |
      6. 6.2.6 Nordic Countries | |
      7. 6.2.7 Russia | |
      8. 6.2.8 Rest of Europe |
    3. 6.3 Asia-Pacific | |
      1. 6.3.1 China | |
      2. 6.3.2 India | |
      3. 6.3.3 Japan | |
      4. 6.3.4 South Korea | |
      5. 6.3.5 ASEAN | |
      6. 6.3.6 Rest of Asia-Pacific |
    4. 6.4 South America | |
      1. 6.4.1 Brazil | |
      2. 6.4.2 Argentina | |
      3. 6.4.3 Rest of South America |
    5. 6.5 Middle East & Africa | |
      1. 6.5.1 Saudi Arabia | |
      2. 6.5.2 UAE | |
      3. 6.5.3 South Africa | |
      4. 6.5.4 Egypt | |
      5. 6.5.5 Rest of MEA
  7. 7 Competitive Landscape |
    1. 7.1 Market Share Analysis (2026) |
    2. 7.2 Competitive Benchmarking Matrix |
    3. 7.3 Company Profiles | |
      1. 7.3.1 Intrepid Travel | |
      2. 7.3.2 Backroads | |
      3. 7.3.3 Trek Travel | |
      4. 7.3.4 Butterfield & Robinson | |
      5. 7.3.5 Exodus Travels | |
      6. 7.3.6 DuVine Cycling + Adventure Co. | |
      7. 7.3.7 Saddle Skedaddle | |
      8. 7.3.8 G Adventures | |
      9. 7.3.9 TUI Group | |
      10. 7.3.10 Bike Tours Direct
  8. 8 Future Outlook & Strategic Recommendations (2026–2035) |
    1. 8.1 Platform Economics and Marketplace Consolidation |
    2. 8.2 Electrification and Extended-Range Touring |
    3. 8.3 ESG and Sustainable Tourism Certification |
    4. 8.4 AI-Driven Personalization and Dynamic Packaging
  9. 9 Recent Developments & News
  10. 10 Frequently Asked Questions (FAQs)
  11. 11 Report Scope & Methodology |
    1. 11.1 Study Period & Base Year |
    2. 11.2 Data Sources & Citations |
    3. 11.3 Abbreviations
  12. 12 LIST OF TABLES |
  13. TABLE 1 Global Cycle Tourism Market Size & Forecast, by Revenue (USD Billion), 2021–2035 |
  14. TABLE 2 Global Cycle Tourism Market – Year-over-Year Growth Analysis, 2021–2035 |
  15. TABLE 3 Global Cycle Tourism Market – Driver Impact Analysis |
  16. TABLE 4 Global Cycle Tourism Market – Restraint Impact Analysis |
  17. TABLE 5 Global Cycle Tourism Market Size, by Group Type, 2021–2035 (USD Billion) |
  18. TABLE 6 Global Cycle Tourism Market Size, by Booking Mode, 2021–2035 (USD Billion) |
  19. TABLE 7 Global Cycle Tourism Market Size, by Age Group, 2021–2035 (USD Billion) |
  20. TABLE 8 Global Cycle Tourism Market Size, by Region, 2021–2035 (USD Billion) |
  21. TABLE 9 North America Cycle Tourism Market Size, by Country, 2021–2035 (USD Billion) |
  22. TABLE 10 Europe Cycle Tourism Market Size, by Country, 2021–2035 (USD Billion) |
  23. TABLE 11 Asia-Pacific Cycle Tourism Market Size, by Country, 2021–2035 (USD Billion) |
  24. TABLE 12 South America Cycle Tourism Market Size, by Country, 2021–2035 (USD Billion) |
  25. TABLE 13 Middle East & Africa Cycle Tourism Market Size, by Country, 2021–2035 (USD Billion) |
  26. TABLE 14 Competitive Benchmarking Matrix – Global Cycle Tourism Market, 2026 |
  27. TABLE 15 Company Profiles – Key Players, Global Cycle Tourism Market |
  28. TABLE 16 Recent Developments & Strategic Announcements, 2023–2025 |
  29. TABLE 17 Report Scope & Methodology Summary |
  30. TABLE 18 Detailed Sources and Citations |
  31. TABLE 19 North America Cycle Tourism Market Size, by Group Type, 2021–2035 (USD Billion) |
  32. TABLE 20 North America Cycle Tourism Market Size, by Booking Mode, 2021–2035 (USD Billion) |
  33. TABLE 21 North America Cycle Tourism Market Size, by Age Group, 2021–2035 (USD Billion) |
  34. TABLE 22 Europe Cycle Tourism Market Size, by Group Type, 2021–2035 (USD Billion) |
  35. TABLE 23 Europe Cycle Tourism Market Size, by Booking Mode, 2021–2035 (USD Billion) |
  36. TABLE 24 Europe Cycle Tourism Market Size, by Age Group, 2021–2035 (USD Billion) |
  37. TABLE 25 Asia-Pacific Cycle Tourism Market Size, by Group Type, 2021–2035 (USD Billion) |
  38. TABLE 26 Asia-Pacific Cycle Tourism Market Size, by Booking Mode, 2021–2035 (USD Billion) |
  39. TABLE 27 Asia-Pacific Cycle Tourism Market Size, by Age Group, 2021–2035 (USD Billion) |
  40. TABLE 28 South America Cycle Tourism Market Size, by Group Type, 2021–2035 (USD Billion) |
  41. TABLE 29 South America Cycle Tourism Market Size, by Booking Mode, 2021–2035 (USD Billion) |
  42. TABLE 30 South America Cycle Tourism Market Size, by Age Group, 2021–2035 (USD Billion) |
  43. TABLE 31 Middle East & Africa Cycle Tourism Market Size, by Group Type, 2021–2035 (USD Billion) |
  44. TABLE 32 Middle East & Africa Cycle Tourism Market Size, by Booking Mode, 2021–2035 (USD Billion) |
  45. TABLE 33 Middle East & Africa Cycle Tourism Market Size, by Age Group, 2021–2035 (USD Billion)
  46. 13 LIST OF FIGURES |
  47. FIGURE 1 Global Cycle Tourism Market Dynamics Overview |
  48. FIGURE 2 Industry Value Chain Analysis – Cycle Tourism Market |
  49. FIGURE 3 Porter's Five Forces Analysis – Cycle Tourism Market |
  50. FIGURE 4 Global Cycle Tourism Market Size Trend (USD Billion), 2021–2035 |
  51. FIGURE 5 Global Cycle Tourism Market Share, by Group Type (%), 2025 |
  52. FIGURE 6 Global Cycle Tourism Market Share, by Booking Mode (%), 2025 |
  53. FIGURE 7 Global Cycle Tourism Market Share, by Age Group (%), 2025 |
  54. FIGURE 8 Global Cycle Tourism Market Share, by Region (%), 2025 |
  55. FIGURE 9 North America Cycle Tourism Market Size Trend, 2021–2035 |
  56. FIGURE 10 Europe Cycle Tourism Market Size Trend, 2021–2035 |
  57. FIGURE 11 Asia-Pacific Cycle Tourism Market Size Trend, 2021–2035 |
  58. FIGURE 12 South America Cycle Tourism Market Size Trend, 2021–2035 |
  59. FIGURE 13 Middle East & Africa Cycle Tourism Market Size Trend, 2021–2035 |
  60. FIGURE 14 Competitive Landscape – Market Share Distribution, 2025
Share::
Request Free Sample

Segmentation Quick Reference

DimensionSub-SegmentsDominant SegmentFastest Growing Segment
By Group TypeGroup/Friends, Couples, Family, SoloCouplesSolo
By Booking ModeDirect, Travel Agent, Marketplace BookingDirectMarketplace Booking
By Age Group18 to 30 Years, 31 to 50 Years, More Than 50 Years31 to 50 Years18 to 30 Years
By GeographyNorth America, Europe, Asia-Pacific, South America, Middle East & AfricaEuropeAsia-Pacific


Market Segmentation Overview

By Group Type

Sub-SegmentKey Trend
Group/FriendsSocial-media-amplified group cycling experiences driving mid-range demand
CouplesRomantic and anniversary itineraries sustain the largest revenue share
FamilyChild-friendly trail infrastructure expanding across Europe and North America
SoloSelf-guided mobile platforms enable flexible independent touring


The group-type segmentation reflects diverging demand patterns. Couples remain the revenue anchor, while solo travelers represent the highest-growth cohort as digital self-navigation tools lower barriers to independent cycling holidays.

By Booking Mode

Sub-SegmentKey Trend
DirectEstablished operators retain loyalty-driven direct bookings
Travel AgentAgents remain relevant for complex multi-country cycling itineraries
Marketplace BookingPlatform aggregation and price transparency accelerate adoption


Booking-mode dynamics are shifting as marketplace platforms grow at roughly double the rate of direct channels. Operators that invest in proprietary digital experiences and loyalty programs will protect margins against platform intermediation.

By Age Group

Sub-SegmentKey Trend
18 to 30 YearsAdventure seeking and social sharing drive rapid growth
31 to 50 YearsPeak earning capacity sustains the largest revenue contribution
More Than 50 YearsE-bike accessibility unlocks demand from older demographics


Age-group segmentation highlights the transformative impact of e-bike technology on the over-50 cohort, while the 18–30 segment benefits from low-cost bikepacking formats and influencer-driven destination discovery.




Share::
Request Free Sample
Download PDF ×

We do not share your information with anyone. However, we may send you emails based on your report interest from time to time. You may contact us at any time to opt-out.