Custom Software Development Market (2026 – 2035)

ID: MRFR/ICT/10399-HCR 128 Pages Ankit Gupta Last Updated: September 15, 2026
Custom Software Development Market Size, Share and Research Report By Solution (Web-Based Solutions, Mobile Applications, Enterprise Software, Embedded and IoT Software, Analytics and AI Software), By Deployment Model (On-Premise, Cloud-Hosted), By Enterprise Size (Small and Medium Enterprises, Large Enterprises), By End-User Vertical (BFSI, Healthcare and Life Sciences, Retail and E-Commerce, Manufacturing, IT and Telecom, Government and Public Sector, Others) and By Regional (North America, Europe, South America, Asia Pacific, Middle East and Africa) - Industry Forecast to 2035.
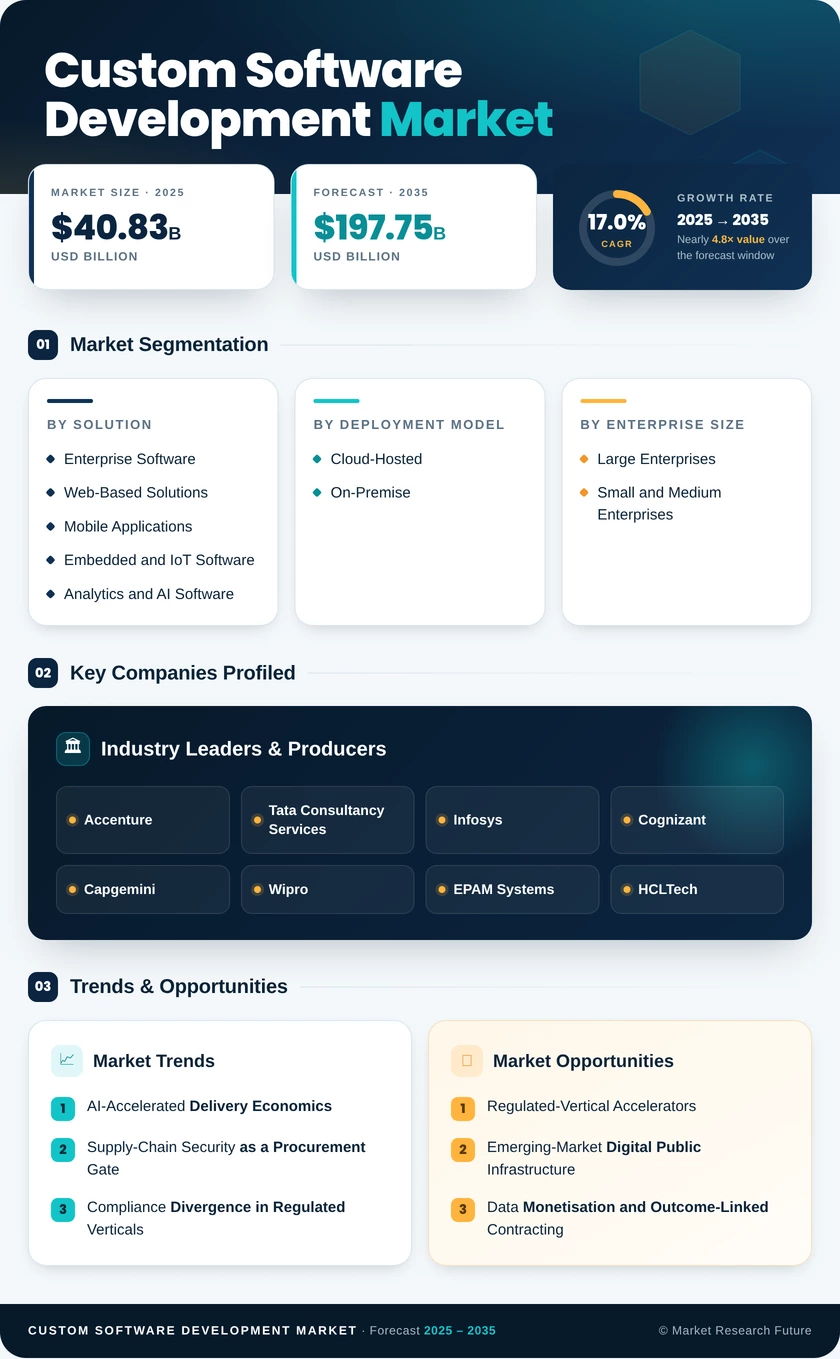
Custom Software Development Market
Market Size
Forecast Period2026-2035
CAGR (2026-2035)17.0%
2025 Market SizeUSD 40.83 Billion
2035 Market SizeUSD 197.75 Billion
Key Players
Accenture
Tata Consultancy Services
Infosys
Cognizant
Capgemini
Wipro
Opportunities
  • Regulated-Vertical Accelerators
  • Emerging-Market Digital Public Infrastructure
  • Data Monetisation and Outcome-Linked Contracting
  1. 1 Market Summary |
    1. 1.1 Study Assumptions & Market Definition |
    2. 1.2 Scope of the Study |
    3. 1.3 Research Methodology
  2. 2 Key Report Takeaways |
    1. 2.1 By Solution |
    2. 2.2 By Sector |
    3. 2.3 By Geography
  3. 3 Market Size & Forecast (2021–2035) |
    1. 3.1 Historical Market Size (2021–2025) |
    2. 3.2 Current & Forecast Market Size (2026–2035) |
    3. 3.3 Market Size by Revenue (USD Billion) |
    4. 3.4 Year-over-Year Growth Analysis
  4. 4 Driver Impact Analysis |
    1. 4.1 AI-Accelerated Delivery Economics |
    2. 4.2 Supply-Chain Security as a Procurement Gate |
    3. 4.3 Compliance Divergence in Regulated Verticals |
    4. 4.4 Core Systems Re-Platforming
  5. 5 Restraints Impact Analysis |
    1. 5.1 The Senior Talent Bottleneck |
    2. 5.2 Build-Versus-Buy Scrutiny |
    3. 5.3 Data Localisation Friction
  6. 6 Opportunities |
    1. 6.1 Regulated-Vertical Accelerators |
    2. 6.2 Emerging-Market Digital Public Infrastructure |
    3. 6.3 Data Monetisation and Outcome-Linked Contracting |
    4. 6.4 Edge and Embedded Workloads |
    5. 6.5 Modernisation of Mid-Market Estates
  7. 7 Regional Market Share & Country-Level Analysis |
    1. 7.1 North America | |
      1. 7.1.1 US | |
      2. 7.1.2 Canada | |
      3. 7.1.3 Mexico |
    2. 7.2 Europe | |
      1. 7.2.1 Germany | |
      2. 7.2.2 UK | |
      3. 7.2.3 France | |
      4. 7.2.4 Italy | |
      5. 7.2.5 Spain | |
      6. 7.2.6 Nordic Countries | |
      7. 7.2.7 Russia | |
      8. 7.2.8 Rest of Europe |
    3. 7.3 Asia-Pacific | |
      1. 7.3.1 China | |
      2. 7.3.2 India | |
      3. 7.3.3 Japan | |
      4. 7.3.4 South Korea | |
      5. 7.3.5 ASEAN | |
      6. 7.3.6 Rest of Asia-Pacific |
    4. 7.4 South America | |
      1. 7.4.1 Brazil | |
      2. 7.4.2 Argentina | |
      3. 7.4.3 Rest of South America |
    5. 7.5 Middle East & Africa | |
      1. 7.5.1 Saudi Arabia | |
      2. 7.5.2 UAE | |
      3. 7.5.3 South Africa | |
      4. 7.5.4 Egypt | |
      5. 7.5.5 Rest of Middle East & Africa
  8. 8 Future Outlook (2026–2035) |
    1. 8.1 Autonomous Delivery Pipelines |
    2. 8.2 Platform Economics and Reusable Assets |
    3. 8.3 Energy-Aware and Sustainable Engineering |
    4. 8.4 Sovereign Technology Stacks
  9. 9 Market Segmentation Analysis |
    1. 9.1 By Solution | |
      1. 9.1.1 Web-Based Solutions | |
      2. 9.1.2 Mobile Applications | |
      3. 9.1.3 Enterprise Software | |
      4. 9.1.4 Embedded and IoT Software | |
      5. 9.1.5 Analytics and AI Software |
    2. 9.2 By Deployment Model | |
      1. 9.2.1 On-Premise | |
      2. 9.2.2 Cloud-Hosted |
    3. 9.3 By Enterprise Size | |
      1. 9.3.1 Small and Medium Enterprises | |
      2. 9.3.2 Large Enterprises |
    4. 9.4 By End-User Vertical | |
      1. 9.4.1 BFSI | |
      2. 9.4.2 Healthcare and Life Sciences | |
      3. 9.4.3 Retail and E-Commerce | |
      4. 9.4.4 Manufacturing | |
      5. 9.4.5 IT and Telecom | |
      6. 9.4.6 Government and Public Sector | |
      7. 9.4.7 Others
  10. 10 Competitive Landscape |
    1. 10.1 Market Share Analysis (2026) |
    2. 10.2 Competitive Benchmarking Matrix |
    3. 10.3 Company Profiles | |
      1. 10.3.1 Accenture | |
      2. 10.3.2 Tata Consultancy Services | |
      3. 10.3.3 Infosys | |
      4. 10.3.4 Cognizant | |
      5. 10.3.5 Capgemini | |
      6. 10.3.6 Wipro | |
      7. 10.3.7 EPAM Systems | |
      8. 10.3.8 HCLTech | |
      9. 10.3.9 Globant | |
      10. 10.3.10 Endava | |
      11. 10.3.11 Thoughtworks
  11. 11 Recent News & Developments
  12. 12 Report Scope & Methodology |
    1. 12.1 Study Period & Base Year |
    2. 12.2 Data Sources & Citations |
    3. 12.3 Abbreviations
  13. 13 Detailed Sources & Citations
  14. 14 Frequently Asked Questions
  15. 15 LIST OF TABLES |
  16. TABLE 1 Global Custom Software Development Market Size & Forecast, by Revenue (USD Billion), 2021–2035 |
  17. TABLE 2 Global Custom Software Development Market – Year-over-Year Growth Analysis, 2021–2035 |
  18. TABLE 3 Driver Impact Analysis Matrix, 2026–2035 |
  19. TABLE 4 Restraint Impact Analysis Matrix, 2026–2035 |
  20. TABLE 5 Global Market Size, by Solution, 2021–2035 (USD Billion) |
  21. TABLE 6 Global Market Size, by Deployment Model, 2021–2035 (USD Billion) |
  22. TABLE 7 Global Market Size, by Enterprise Size, 2021–2035 (USD Billion) |
  23. TABLE 8 Global Market Size, by End-User Vertical, 2021–2035 (USD Billion) |
  24. TABLE 9 Global Market Size, by Region, 2021–2035 (USD Billion) |
  25. TABLE 10 North America Market Size, by Country, 2021–2035 (USD Billion) |
  26. TABLE 11 Europe Market Size, by Country, 2021–2035 (USD Billion) |
  27. TABLE 12 Asia-Pacific Market Size, by Country, 2021–2035 (USD Billion) |
  28. TABLE 13 South America Market Size, by Country, 2021–2035 (USD Billion) |
  29. TABLE 14 Middle East & Africa Market Size, by Country, 2021–2035 (USD Billion) |
  30. TABLE 15 North America Market Size, by Solution, 2021–2035 (USD Billion) |
  31. TABLE 16 North America Market Size, by Deployment Model, 2021–2035 (USD Billion) |
  32. TABLE 17 North America Market Size, by Enterprise Size, 2021–2035 (USD Billion) |
  33. TABLE 18 North America Market Size, by End-User Vertical, 2021–2035 (USD Billion) |
  34. TABLE 19 Europe Market Size, by Solution, 2021–2035 (USD Billion) |
  35. TABLE 20 Europe Market Size, by Deployment Model, 2021–2035 (USD Billion) |
  36. TABLE 21 Europe Market Size, by Enterprise Size, 2021–2035 (USD Billion) |
  37. TABLE 22 Europe Market Size, by End-User Vertical, 2021–2035 (USD Billion) |
  38. TABLE 23 Asia-Pacific Market Size, by Solution, 2021–2035 (USD Billion) |
  39. TABLE 24 Asia-Pacific Market Size, by Deployment Model, 2021–2035 (USD Billion) |
  40. TABLE 25 Asia-Pacific Market Size, by Enterprise Size, 2021–2035 (USD Billion) |
  41. TABLE 26 Asia-Pacific Market Size, by End-User Vertical, 2021–2035 (USD Billion) |
  42. TABLE 27 South America Market Size, by Solution, 2021–2035 (USD Billion) |
  43. TABLE 28 South America Market Size, by End-User Vertical, 2021–2035 (USD Billion) |
  44. TABLE 29 Middle East & Africa Market Size, by Solution, 2021–2035 (USD Billion) |
  45. TABLE 30 Middle East & Africa Market Size, by End-User Vertical, 2021–2035 (USD Billion) |
  46. TABLE 31 US Market Size, by Solution and End-User Vertical, 2021–2035 (USD Billion) |
  47. TABLE 32 Germany Market Size, by Solution and End-User Vertical, 2021–2035 (USD Billion) |
  48. TABLE 33 China Market Size, by Solution and End-User Vertical, 2021–2035 (USD Billion) |
  49. TABLE 34 India Market Size, by Solution and End-User Vertical, 2021–2035 (USD Billion) |
  50. TABLE 35 Japan Market Size, by Solution and End-User Vertical, 2021–2035 (USD Billion) |
  51. TABLE 36 Brazil Market Size, by Solution and End-User Vertical, 2021–2035 (USD Billion) |
  52. TABLE 37 Saudi Arabia Market Size, by Solution and End-User Vertical, 2021–2035 (USD Billion) |
  53. TABLE 38 Competitive Benchmarking Matrix, 2026 |
  54. TABLE 39 Company Profiles – Key Players |
  55. TABLE 40 Recent Developments & Strategic Announcements, 2023–2025 |
  56. TABLE 41 Report Scope & Methodology Summary |
  57. TABLE 42 Detailed Sources & Citations Index
  58. 16 LIST OF FIGURES |
  59. FIGURE 1 Market Dynamics – Drivers, Restraints and Opportunities Overview |
  60. FIGURE 2 Industry Value Chain Analysis |
  61. FIGURE 3 Porter's Five Forces Analysis |
  62. FIGURE 4 Global Market Size Trend and Forecast, 2021–2035 (USD Billion) |
  63. FIGURE 5 Year-over-Year Growth Trajectory, 2022–2035 (%) |
  64. FIGURE 6 Driver Impact Contribution to Headline CAGR |
  65. FIGURE 7 Restraint Drag Analysis |
  66. FIGURE 8 Market Share by Solution, 2025 vs 2035 (%) |
  67. FIGURE 9 Market Share by Deployment Model, 2025 vs 2035 (%) |
  68. FIGURE 10 Market Share by Enterprise Size, 2025 vs 2035 (%) |
  69. FIGURE 11 Market Share by End-User Vertical, 2025 (%) |
  70. FIGURE 12 Regional Revenue Share Distribution, 2025 (%) |
  71. FIGURE 13 Regional CAGR Comparison, 2026–2035 (%) |
  72. FIGURE 14 North America Country-Level Share Breakdown, 2025 (%) |
  73. FIGURE 15 Europe Country-Level Share Breakdown, 2025 (%) |
  74. FIGURE 16 Asia-Pacific Country-Level Share Breakdown, 2025 (%) |
  75. FIGURE 17 Competitive Landscape – Estimated Revenue Share Bands, 2026 |
  76. FIGURE 18 Competitive Positioning Quadrant – Scale versus Domain Depth |
  77. FIGURE 19 Delivery Model Evolution – Time & Materials to Outcome-Based |
  78. FIGURE 20 Future Outlook Roadmap, 2026–2035

Segmentation Quick Reference

DimensionSub-SegmentsDominant SegmentFastest Growing Segment
By SolutionWeb-Based Solutions; Mobile Applications; Enterprise Software; Embedded and IoT Software; Analytics and AI SoftwareEnterprise SoftwareEmbedded and IoT Software
By Deployment ModelOn-Premise; Cloud-HostedCloud-HostedCloud-Hosted
By Enterprise SizeSmall and Medium Enterprises; Large EnterprisesLarge EnterprisesSmall and Medium Enterprises
By End-User VerticalBFSI; Healthcare and Life Sciences; Retail and E-Commerce; Manufacturing; IT and Telecom; Government and Public Sector; OthersBFSIHealthcare and Life Sciences
By GeographyNorth America; Europe; Asia-Pacific; South America; Middle East & AfricaNorth AmericaAsia-Pacific


Market Segmentation Overview

By Solution

Sub-SegmentKey Trend
Web-Based SolutionsProgressive web architectures replacing separate desktop and mobile codebases
Mobile ApplicationsCross-platform frameworks compressing dual-stack development cost
Enterprise SoftwareMonolith decomposition into domain-aligned microservices
Embedded and IoT SoftwareOn-device inference and over-the-air update pipelines becoming standard
Analytics and AI SoftwareModel deployment and monitoring moving from data science into engineering scope


Solution mix is shifting toward workloads that touch physical assets. Enterprise software still carries the largest revenue block, but growth capital is flowing to embedded and analytics work where buyers see defensible differentiation rather than parity spend.

By Deployment Model

Sub-SegmentKey Trend
On-PremiseSovereign and edge deployments adopting cloud-native tooling on private infrastructure
Cloud-HostedMulti-cloud portability requirements reshaping architecture decisions at design stage


Deployment choice has become a governance decision rather than a technical one. Buyers now specify hosting geography and switching provisions in the statement of work, which changes how vendors design abstraction layers from the first sprint.

By Enterprise Size

Sub-SegmentKey Trend
Small and Medium EnterprisesFixed-scope modernisation packages lowering the entry threshold for bespoke build
Large EnterprisesMulti-year programmes governed by internal platform teams and shared service catalogues


Scale still determines programme structure. Large enterprises increasingly act as their own systems integrators, buying engineering capacity rather than end-to-end delivery, while smaller buyers want turnkey outcomes with predictable pricing.

By End-User Vertical

Sub-SegmentKey Trend
BFSIPayments modernisation and regulatory reporting automation
Healthcare and Life SciencesInteroperability mandates driving clinical data exchange platforms
Retail and E-CommerceOrder orchestration across owned and marketplace channels
ManufacturingShop-floor telemetry integration with enterprise planning systems
IT and TelecomNetwork automation and legacy OSS/BSS replacement
Government and Public SectorCitizen identity and service delivery platforms
OthersEnergy trading, logistics visibility and education technology builds


Vertical demand correlates tightly with regulatory intensity. Sectors facing new disclosure, resilience or interoperability obligations consistently outspend those operating under stable rules, and that relationship holds across every region covered in this report.


just now

Opus 5 High

Download PDF ×

We do not share your information with anyone. However, we may send you emails based on your report interest from time to time. You may contact us at any time to opt-out.