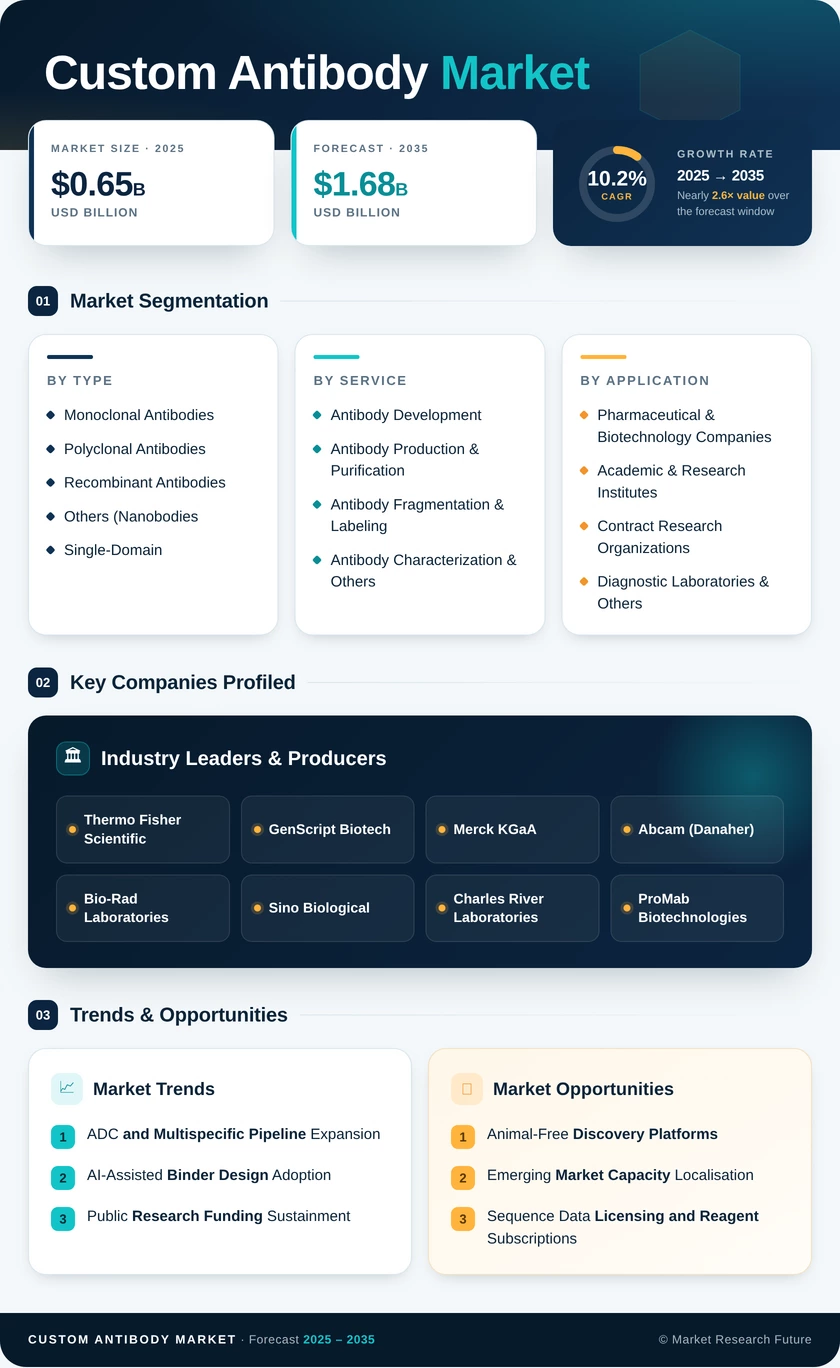
Segmentation Quick Reference
| Dimension | Sub-Segments | Dominant Segment | Fastest Growing Segment |
| By Antibody Type | Monoclonal Antibodies; Polyclonal Antibodies; Recombinant Antibodies; Others (Nanobodies, Single-Domain, Neutralizing) | Monoclonal Antibodies (50.1% share) | Recombinant Antibodies (14.5% CAGR) |
| By Service | Antibody Development; Antibody Production & Purification; Antibody Fragmentation & Labeling; Antibody Characterization & Others | Antibody Development (38.4% share) | Antibody Fragmentation & Labeling (15.9% CAGR) |
| By Application | Oncology; Infectious Diseases; Neurology; Stem Cell Research; Immunology, Cardiovascular & Others | Oncology (33.2% share) | Stem Cell Research (14.8% CAGR) |
| By End User | Pharmaceutical & Biotechnology Companies; Academic & Research Institutes; Contract Research Organizations; Diagnostic Laboratories & Others | Pharmaceutical & Biotechnology Companies (60.1% share) | Contract Research Organizations (13.1% CAGR) |
Market Segmentation Overview
By Antibody Type
| Sub-Segment | Key Trend |
| Monoclonal Antibodies | Continued default choice for validated assays and clinical programs |
| Polyclonal Antibodies | Sustained use in diagnostic signal amplification requiring multi-epitope binding |
| Recombinant Antibodies | Rapid substitution of hybridoma stocks driven by sequence traceability |
| Others (Nanobodies, Single-Domain, Neutralizing) | Adoption in imaging and tissue-penetration-limited applications |
Monoclonal antibodies lead this dimension at 50.1% share because assay validation histories and manufacturing familiarity lower procurement risk for both research and diagnostic buyers. Recombinant antibodies grow fastest at 14.5% CAGR, since sequence-defined production eliminates clone loss and lot-to-lot drift while allowing deliberate Fc modification and bispecific construction. European funder guidance discouraging animal-derived reagents accelerates that substitution directly. Polyclonal formats persist where broad epitope recognition amplifies weak signal, but their share erodes as recombinant alternatives close the sensitivity gap.
By Service
| Sub-Segment | Key Trend |
| Antibody Development | Vendor consolidation toward single-quality-system discovery-to-lead delivery |
| Antibody Production & Purification | Gram-scale demand tied to toxicology and characterisation studies |
| Antibody Fragmentation & Labeling | Fab and scFv demand from imaging, diagnostic kits, and conjugate payloads |
| Antibody Characterization & Others | Developability and documentation bundled into earlier project stages |
Antibody development holds 38.4% of service revenue because sponsors preparing first-in-human filings prefer immunisation, selection, and engineering managed under one quality system rather than stitched across vendors. Antibody fragmentation and labeling grows fastest at 15.9% CAGR as automated cleavage platforms deliver Fab and scFv constructs with consistent functional attributes, serving imaging and conjugate developers who need superior tissue penetration. Production and purification revenue rises with toxicology-stage gram requirements, while characterisation work increasingly attaches to development contracts rather than selling standalone.
By Application
| Sub-Segment | Key Trend |
| Oncology | Conjugate labels extending into earlier treatment lines |
| Infectious Diseases | Broad-spectrum neutraliser programs advancing through trials |
| Neurology | Engineered blood-brain barrier transport enabling CNS targets |
| Stem Cell Research | Antibody-based conditioning replacing cytotoxic preparation |
| Immunology, Cardiovascular & Others | Cytokine modulation and atherosclerotic pathway targeting |
Oncology dominates at 33.2% share, driven by checkpoint follow-on programs and conjugate labels moving into earlier lines, each of which commissions matched binders plus analytical and control reagents. Stem cell research grows fastest at 14.8% CAGR because conditioning antibodies have demonstrated that transplant preparation can proceed without chemotherapy, creating demand that did not previously exist. Neurology gains on transport constructs reaching central nervous system targets, while infectious disease programs supply steady, less cyclical volume anchored in public health funding.
By End User
| Sub-Segment | Key Trend |
| Pharmaceutical & Biotechnology Companies | Parallel campaigns per program supported by large discovery budgets |
| Academic & Research Institutes | Grant-underwritten baseline demand with rising validation expectations |
| Contract Research Organizations | Intermediary buying as sponsors externalise discovery execution |
| Diagnostic Laboratories & Others | Multi-year contracted supply replacing lot-by-lot purchasing |
Pharmaceutical and biotechnology companies account for 60.1% of demand, commissioning several reagent campaigns per clinical asset across discovery, characterisation, and bioanalysis. Contract research organisations expand fastest at 13.1% CAGR as sponsors hand execution to external partners while retaining programme ownership, which shifts the purchasing relationship one step down the chain. Academic and research institutes deliver stable grant-funded volume that cushions biotech funding cycles, and diagnostic laboratories increasingly move from research-grade lots to contracted, documentation-backed supply.

 Noah Malgeri
Co-Founder
Noah Malgeri
Co-Founder

 Peter Groot koerkamp
Account and Business Manager
Peter Groot koerkamp
Account and Business Manager

 Younghwan Choi
Senior Retail Manager
Younghwan Choi
Senior Retail Manager

 Mark Irwin
Management Consultant
Mark Irwin
Management Consultant

 Akif Moroglu
Strategy & Business Development Director
Akif Moroglu
Strategy & Business Development Director

 Guilherme Gomes Martins
Product Management Director
Guilherme Gomes Martins
Product Management Director

 Joseph Aguayo
Sales Operations & Pricing Manager
Joseph Aguayo
Sales Operations & Pricing Manager

 La Terria Dodd
Program Support Specialist
La Terria Dodd
Program Support Specialist

 Rob Kooiker
Group Product Manager HVAC & Fire Protection GMA
Rob Kooiker
Group Product Manager HVAC & Fire Protection GMA