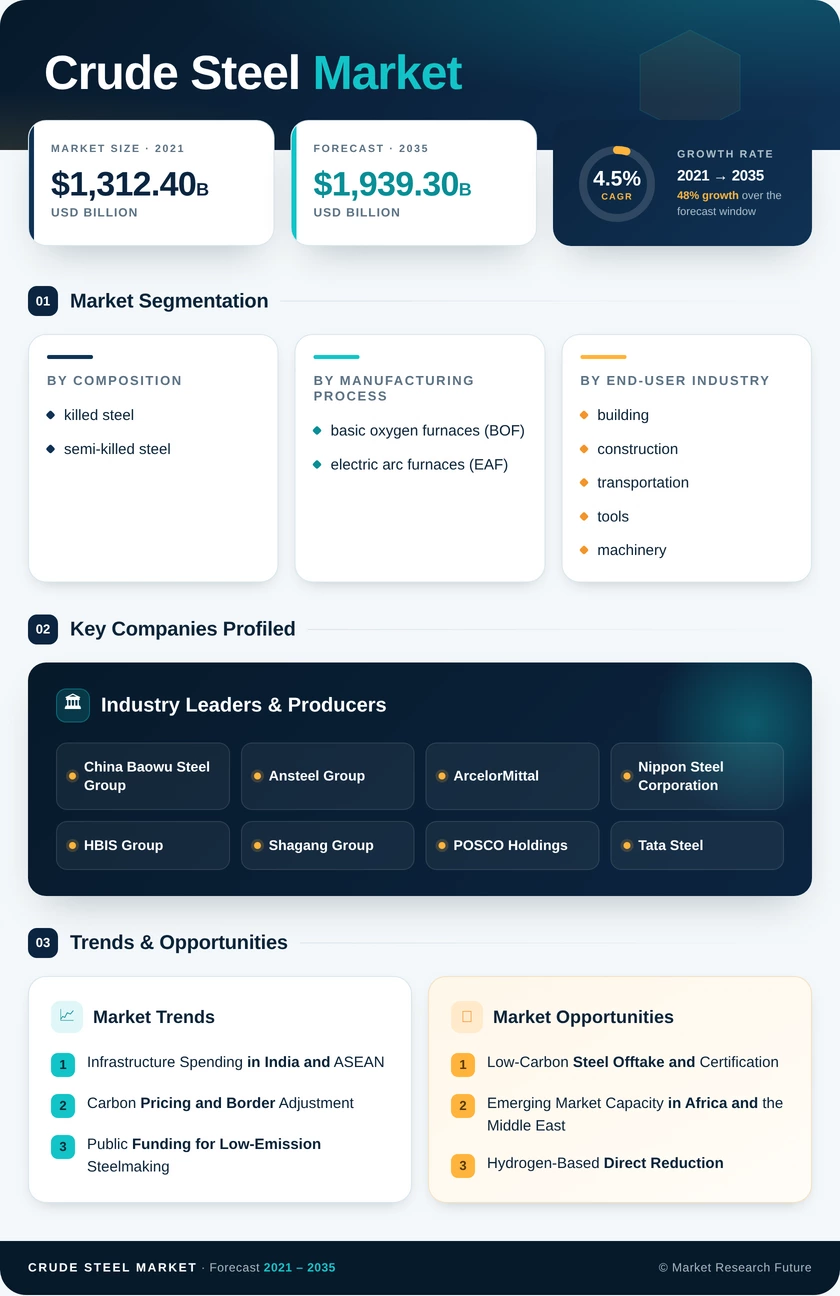
Crude Steel Market (2026 - 2035)

ID: MRFR/CnM/8355-HCR 111 Pages Chitranshi Jaiswal Last Updated: November 17, 2026
Crude Steel Market Research Report Information By Composition (Killed Steel and Semi-Killed Steel), By Manufacturing Process (Basic Oxygen Furnace (BOF) and Electric Arc Furnace (EAF)), By End-User Industry (Building and Construction, Transportation, Tools and Machinery, Energy, Consumer Goods, and Other End-User Industries), And By Region (North America, Europe, Asia-Pacific, and Rest of the World) – Market Forecast Till 2035.
Crude Steel Market
Market Size
Forecast Period2026-2035
CAGR (2026-2035)4.5%
2025 Market SizeUSD 1,246.8 Billion
2035 Market SizeUSD 1,939.3 Billion
Key Players
China Baowu Steel Group
Ansteel Group
ArcelorMittal
Nippon Steel Corporation
HBIS Group
Shagang Group
Opportunities
  • Low-Carbon Steel Offtake and Certification
  • Emerging Market Capacity in Africa and the Middle East
  • Hydrogen-Based Direct Reduction
  1. 1 Market Summary | |
  2. 2 Key Report Takeaways | |
    1. 2.1 By Composition | |
    2. 2.2 By Manufacturing Process | |
    3. 2.3 By End-user Industry | |
    4. 2.4 By Region | |
  3. 3 Market Size and Forecast (2021–2035) | |
    1. 3.1 Historical Market Size (2021–2025) | |
    2. 3.2 Forecast Market Size (2026–2035) | |
    3. 3.3 Year-over-Year Growth Analysis | |
  4. 4 Driver Impact Analysis | |
    1. 4.1 Infrastructure Spending in India and ASEAN | |
    2. 4.2 Carbon Pricing and Border Adjustment | |
    3. 4.3 Public Funding for Low-Emission Steelmaking | |
    4. 4.4 Renewable Energy Build-Out | |
    5. 4.5 Vehicle Electrification and Electrical Steel Demand | |
    6. 4.6 Trade Protection and Reshoring | |
  5. 5 Restraints Impact Analysis | |
    1. 5.1 Chinese Overcapacity and Export Surges | |
    2. 5.2 High Capital Cost of Decarbonization | |
    3. 5.3 Scrap Supply Constraints | |
    4. 5.4 Energy Price Volatility | |
    5. 5.5 Slowdown in Chinese Property Construction | |
  6. 6 Opportunities | |
    1. 6.1 Low-Carbon Steel Offtake and Certification | |
    2. 6.2 Emerging Market Capacity in Africa and the Middle East | |
    3. 6.3 Hydrogen-Based Direct Reduction | |
    4. 6.4 Digital Operations and Data-Driven Service Models | |
    5. 6.5 Electrical Steel for Grids and Motors | |
  7. 7 Regional Market Share and Country-Level Analysis | |
    1. 7.1 North America | | |
      1. 7.1.1 US | | |
      2. 7.1.2 Canada | | |
      3. 7.1.3 Mexico | |
    2. 7.2 Europe | | |
      1. 7.2.1 Germany | | |
      2. 7.2.2 UK | | |
      3. 7.2.3 France | | |
      4. 7.2.4 Italy | | |
      5. 7.2.5 Spain | | |
      6. 7.2.6 Nordic Countries | | |
      7. 7.2.7 Russia | | |
      8. 7.2.8 Rest of Europe | |
    3. 7.3 Asia-Pacific | | |
      1. 7.3.1 China | | |
      2. 7.3.2 India | | |
      3. 7.3.3 Japan | | |
      4. 7.3.4 South Korea | | |
      5. 7.3.5 ASEAN | | |
      6. 7.3.6 Rest of Asia-Pacific | |
    4. 7.4 South America | | |
      1. 7.4.1 Brazil | | |
      2. 7.4.2 Argentina | | |
      3. 7.4.3 Rest of South America | |
    5. 7.5 Middle East & Africa | | |
      1. 7.5.1 Saudi Arabia | | |
      2. 7.5.2 UAE | | |
      3. 7.5.3 South Africa | | |
      4. 7.5.4 Egypt | | |
      5. 7.5.5 Rest of MEA | |
  8. 8 Future Outlook (2026–2035) | |
    1. 8.1 Blast Furnace Relining Decisions Reshape the Asset Base | |
    2. 8.2 Circular Economy and Scrap Recycling | |
    3. 8.3 Artificial Intelligence and Autonomous Mill Operations | |
    4. 8.4 Regionalization of Steel Trade | |
  9. 9 Segmentation Analysis | |
    1. 9.1 By Composition | | |
      1. 9.1.1 killed steel | | |
      2. 9.1.2 semi-killed steel | |
    2. 9.2 By Manufacturing Process | | |
      1. 9.2.1 basic oxygen furnaces (BOF) | | |
      2. 9.2.2 electric arc furnaces (EAF) | |
    3. 9.3 By End-user Industry | | |
      1. 9.3.1 building and construction | | |
      2. 9.3.2 transportation | | |
      3. 9.3.3 tools and machinery | | |
      4. 9.3.4 energy | | |
      5. 9.3.5 consumer goods | | |
      6. 9.3.6 other end-user industries | |
  10. 10 Competitive Landscape | |
    1. 10.1 Market Concentration Analysis | |
    2. 10.2 Competitive Benchmarking Table | |
    3. 10.3 Company Profiles | | |
      1. 10.3.1 China Baowu Steel Group | | |
      2. 10.3.2 Ansteel Group | | |
      3. 10.3.3 ArcelorMittal | | |
      4. 10.3.4 Nippon Steel Corporation | | |
      5. 10.3.5 HBIS Group | | |
      6. 10.3.6 Shagang Group | | |
      7. 10.3.7 POSCO Holdings | | |
      8. 10.3.8 Tata Steel | | |
      9. 10.3.9 JSW Steel | | |
      10. 10.3.10 Nucor Corporation | | |
      11. 10.3.11 JFE Steel | | |
      12. 10.3.12 Hyundai Steel | |
  11. 11 Recent News & Developments | |
  12. 12 Report Scope and Methodology | |
  13. 13 Detailed Sources and Citations | |
  14. 14 Frequently Asked Questions (FAQs) | | LIST OF TABLES | |
  15. TABLE 1 Global Market Summary Snapshot, 2025–2035 | |
  16. TABLE 2 Global Market Size & Forecast, 2021–2035 (USD Billion) | |
  17. TABLE 3 Driver Impact Analysis | |
  18. TABLE 4 Restraints Impact Analysis | |
  19. TABLE 5 Regional Summary, 2025 | |
  20. TABLE 6 North America Market, by Country, 2025 | |
  21. TABLE 7 Europe Market, by Country, 2025 | |
  22. TABLE 8 Asia-Pacific Market, by Country, 2025 | |
  23. TABLE 9 South America Market, by Country, 2025 | |
  24. TABLE 10 Middle East & Africa Market, by Country, 2025 | |
  25. TABLE 11 Global Market, by Composition, 2025 | |
  26. TABLE 12 Global Market, by Manufacturing Process, 2025 | |
  27. TABLE 13 Global Market, by End-user Industry, 2025 | |
  28. TABLE 14 Competitive Benchmarking Table | |
  29. TABLE 15 Report Scope and Methodology | |
  30. TABLE 16 Detailed Sources and Citations | | LIST OF FIGURES | |
  31. FIGURE 1 Market Dynamics Overview (Drivers, Restraints, Opportunities) | |
  32. FIGURE 2 Industry Value Chain Analysis | |
  33. FIGURE 3 Porter's Five Forces Analysis | |
  34. FIGURE 4 Global Market Size Trend, 2021–2035 (USD Billion) | |
  35. FIGURE 5 Market Share by Composition, 2025 | |
  36. FIGURE 6 Market Share by Manufacturing Process, 2025 | |
  37. FIGURE 7 Market Share by End-user Industry, 2025 | |
  38. FIGURE 8 Regional Market Share, 2025 | |
  39. FIGURE 9 Competitive Landscape and Market Concentration, 2025

Segmentation Quick Reference

DimensionSub-SegmentsDominant SegmentFastest Growing Segment
By Compositionkilled steel; semi-killed steelkilled steel (57.2% share)semi-killed steel (4.6% CAGR)
By Manufacturing Processbasic oxygen furnaces (BOF); electric arc furnaces (EAF)basic oxygen furnaces (BOF) (70.3% share)electric arc furnaces (EAF) (5.3% CAGR)
By End-user Industrybuilding and construction; transportation; tools and machinery; energy; consumer goods; other end-user industriesbuilding and construction (49.7% share)energy (5.8% CAGR)
By RegionNorth America; Europe; Asia-Pacific; South America; Middle East & AfricaAsia-Pacific (71.8% share)Middle East & Africa (6.1% CAGR)

Market Segmentation Overview

By Composition

Sub-SegmentKey Trend
killed steelStandard feed for continuous casters; aluminum-silicon deoxidation improves yield
semi-killed steelRising use in lightweight automotive structural parts

Killed steel leads because continuous casting, which now accounts for nearly all slab output, requires fully deoxidized melts free of gas porosity. Semi-killed steel grows faster as automakers use its controlled segregation in advanced high-strength chassis parts. EAF operators favor killed grades for better alloy recovery, so killed steel keeps its lead even as semi-killed demand climbs.

By Manufacturing Process

Sub-SegmentKey Trend
basic oxygen furnaces (BOF)Retained for ultra-low-residual grades; facing relining-driven retirements
electric arc furnaces (EAF)Capacity additions backed by carbon pricing, subsidies, and scrap growth

Basic oxygen furnaces lead on volume because integrated mills in China, India, and Japan depend on them for large, high-purity output. Electric arc furnaces grow fastest: they emit about 75% less CO₂ per tonne, and their capacity can be added in modular steps that match regional demand. Carbon border levies and government grants widen this cost gap with each blast furnace relining cycle.

By End-user Industry

Sub-SegmentKey Trend
building and constructionIndian and ASEAN highway, metro, and housing programs
transportationEV platforms and rail upgrades need high-tensile grades
tools and machineryAutomation and mining equipment orders
energyOffshore wind monopiles, transmission towers, and pipelines
consumer goodsSteady white-goods and appliance demand
other end-user industriesRailways, defense, and others gain from rising budgets

Building and construction leads, taking about half of all tonnage through infrastructure and housing spending in India and Southeast Asia. Energy grows fastest because offshore wind foundations and grid expansion need large volumes of heavy plate and structural sections. Transportation ranks second, while consumer goods is the most stable segment but also the slowest-growing.


Download PDF ×

We do not share your information with anyone. However, we may send you emails based on your report interest from time to time. You may contact us at any time to opt-out.