Packaging & Transport Market Segmentation
Packaging & Transport By Type (USD Billion, 2025-2035)
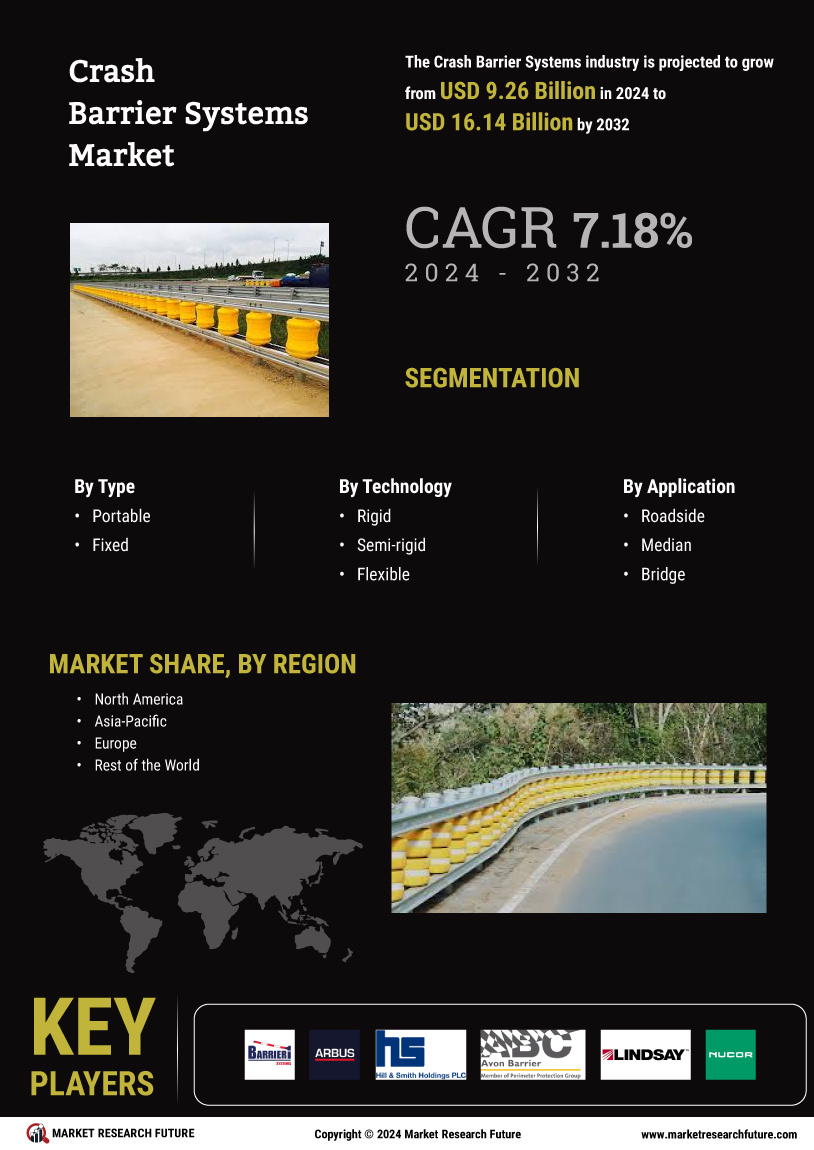
- Portable
- Fixed
Packaging & Transport By Technology (USD Billion, 2025-2035)
- Rigid
- Semi-rigid
- Flexible
Packaging & Transport By Application (USD Billion, 2025-2035)
- Roadside
- Median
- Bridge
- Work zone