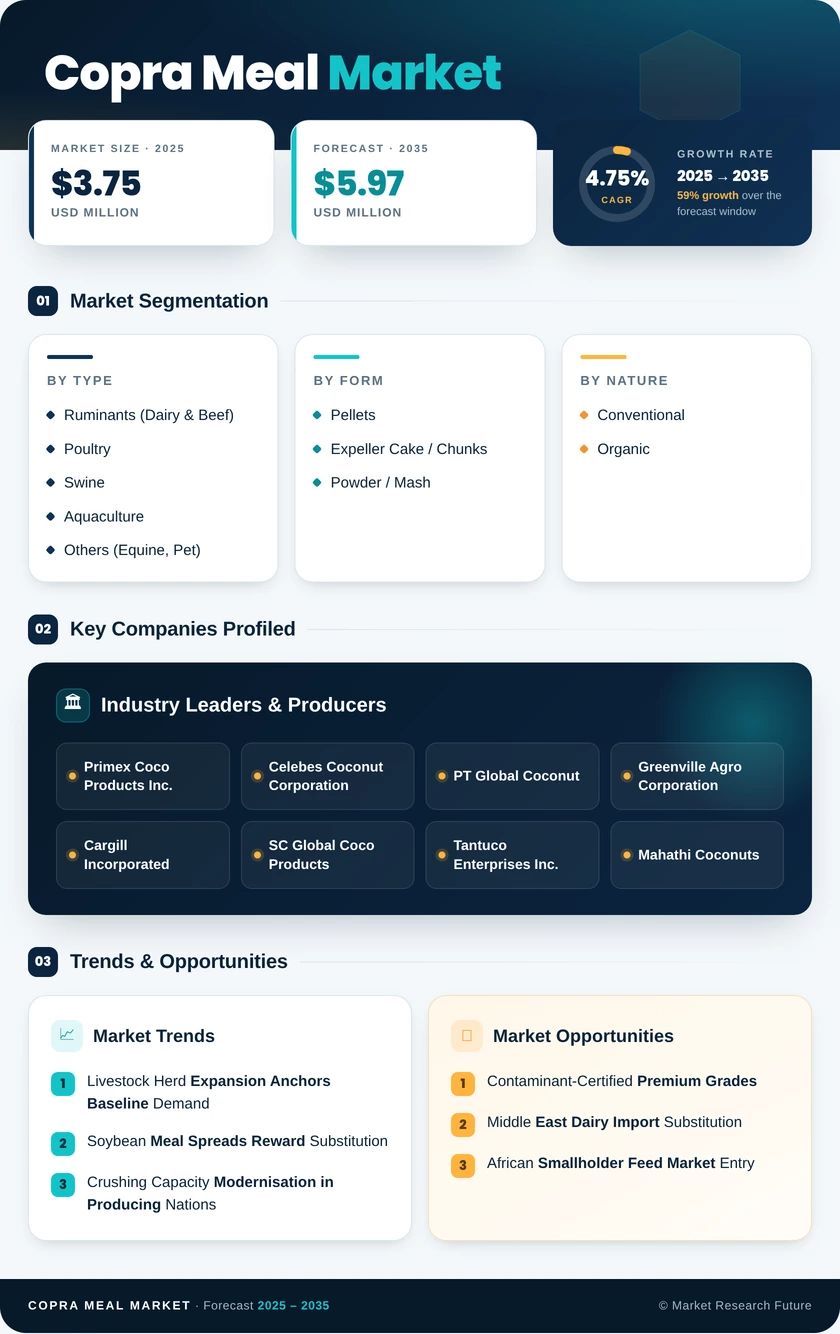
Copra Meal Market (2026 - 2035)

ID: MRFR/Agri/39861-HCR 128 Pages Snehal Singh Last Updated: September 17, 2026

Copra Meal Market Size, Share, Industry Trend & Analysis Research Report By Livestock Type (Ruminants (Dairy & Beef), Poultry, Swine, Aquaculture, Others (Equine, Pet)), By Form (Pellets, Expeller Cake / Chunks, Powder / Mash), By Nature (Conventional, Organic), By Distribution Channel (Direct Mill-to-Feed Manufacturer, Traders & Distributors, Online & Commodity Platforms), By Geography (North America, Europe, Asia-Pacific, South America, Middle East & Africa) - Forecast to 2035

Copra Meal Market
Market Size
Forecast Period2026-2035
CAGR (2026-2035)4.75%
2025 Market SizeUSD 3.75 Million
2035 Market SizeUSD 5.97 Million
Key Players
Primex Coco Products Inc.
Celebes Coconut Corporation
PT Global Coconut
Greenville Agro Corporation
Cargill Incorporated
SC Global Coco Products
Opportunities
  • Contaminant-Certified Premium Grades
  • Middle East Dairy Import Substitution
  • African Smallholder Feed Market Entry
  1. 1 Market Overview |
    1. 1.1 Study Assumptions & Market Definition |
    2. 1.2 Scope of the Study |
    3. 1.3 Research Methodology
  2. 2 Market Summary & Key Report Takeaways |
    1. 2.1 Takeaways by Livestock Type |
    2. 2.2 Takeaways by Form |
    3. 2.3 Takeaways by Geography
  3. 3 Global Market Size & Forecast (2021–2035) |
    1. 3.1 Historical Market Size (2021–2025) |
    2. 3.2 Current & Forecast Market Size (2026–2035) |
    3. 3.3 Market Size by Revenue (USD Million) |
    4. 3.4 Year-over-Year Growth Analysis
  4. 4 Market Dynamics — Driver Impact Analysis |
    1. 4.1 Livestock Herd Expansion Anchors Baseline Demand |
    2. 4.2 Soybean Meal Spreads Reward Substitution |
    3. 4.3 Crushing Capacity Modernisation in Producing Nations |
    4. 4.4 Aquafeed Formulations Open a New Demand Channel
  5. 5 Market Dynamics — Restraints Impact Analysis |
    1. 5.1 Contamination Thresholds Gate Export Access |
    2. 5.2 Amino Acid Profile Limits Monogastric Use |
    3. 5.3 Senile Palm Stock Constrains Raw Material
  6. 6 Market Opportunity Analysis |
    1. 6.1 Contaminant-Certified Premium Grades |
    2. 6.2 Middle East Dairy Import Substitution |
    3. 6.3 African Smallholder Feed Market Entry |
    4. 6.4 Traceability Data as a Commercial Product |
    5. 6.5 Co-Product Valorisation Beyond Feed |
    6. 6.6 Industry Value Chain Analysis |
    7. 6.7 Porter's Five Forces Analysis
  7. 7 Regional Analysis |
    1. 7.1 North America | |
      1. 7.1.1 US | |
      2. 7.1.2 Canada | |
      3. 7.1.3 Mexico |
    2. 7.2 Europe | |
      1. 7.2.1 Germany | |
      2. 7.2.2 UK | |
      3. 7.2.3 France | |
      4. 7.2.4 Italy | |
      5. 7.2.5 Spain | |
      6. 7.2.6 Nordic Countries | |
      7. 7.2.7 Russia | |
      8. 7.2.8 Rest of Europe |
    3. 7.3 Asia-Pacific | |
      1. 7.3.1 China | |
      2. 7.3.2 India | |
      3. 7.3.3 Japan | |
      4. 7.3.4 South Korea | |
      5. 7.3.5 ASEAN | |
      6. 7.3.6 Rest of Asia-Pacific |
    4. 7.4 South America | |
      1. 7.4.1 Brazil | |
      2. 7.4.2 Argentina | |
      3. 7.4.3 Rest of South America |
    5. 7.5 Middle East & Africa | |
      1. 7.5.1 Saudi Arabia | |
      2. 7.5.2 UAE | |
      3. 7.5.3 South Africa | |
      4. 7.5.4 Egypt | |
      5. 7.5.5 Rest of Middle East & Africa
  8. 8 Future Outlook (2026–2035) |
    1. 8.1 Precision Nutrition and Formulation Analytics |
    2. 8.2 Circular Processing and Zero-Waste Coconut Mills |
    3. 8.3 Carbon and Deforestation-Free Sourcing Scrutiny |
    4. 8.4 Climate Volatility and Origin Diversification
  9. 9 Segmentation Analysis |
    1. 9.1 By Livestock Type | |
      1. 9.1.1 Ruminants (Dairy & Beef) | |
      2. 9.1.2 Poultry | |
      3. 9.1.3 Swine | |
      4. 9.1.4 Aquaculture | |
      5. 9.1.5 Others (Equine, Pet) |
    2. 9.2 By Form | |
      1. 9.2.1 Pellets | |
      2. 9.2.2 Expeller Cake / Chunks | |
      3. 9.2.3 Powder / Mash |
    3. 9.3 By Nature | |
      1. 9.3.1 Conventional | |
      2. 9.3.2 Organic |
    4. 9.4 By Distribution Channel | |
      1. 9.4.1 Direct Mill-to-Feed Manufacturer | |
      2. 9.4.2 Traders & Distributors | |
      3. 9.4.3 Online & Commodity Platforms
  10. 10 Competitive Landscape |
    1. 10.1 Market Share Analysis (2026) |
    2. 10.2 Competitive Benchmarking Matrix |
    3. 10.3 Company Profiles | |
      1. 10.3.1 Primex Coco Products Inc. | |
      2. 10.3.2 Franklin Baker Company | |
      3. 10.3.3 Celebes Coconut Corporation | |
      4. 10.3.4 PT Global Coconut | |
      5. 10.3.5 Greenville Agro Corporation | |
      6. 10.3.6 Cargill Incorporated | |
      7. 10.3.7 Louis Dreyfus Company | |
      8. 10.3.8 SC Global Coco Products | |
      9. 10.3.9 Tantuco Enterprises Inc. | |
      10. 10.3.10 Mahathi Coconuts
  11. 11 Recent Developments & News
  12. 12 Report Scope & Methodology |
    1. 12.1 Study Period & Base Year |
    2. 12.2 Data Sources & Citations |
    3. 12.3 Abbreviations
  13. 13 Detailed Sources and Citations
  14. 14 Frequently Asked Questions (FAQs)
  15. 15 LIST OF TABLES |
  16. TABLE 1 Global Copra Meal Market Size & Forecast, by Revenue (USD Million), 2021–2035 |
  17. TABLE 2 Global Copra Meal Market – Year-over-Year Growth Analysis, 2021–2035 |
  18. TABLE 3 Global Copra Meal Market – Driver Impact Analysis Matrix, 2026–2035 |
  19. TABLE 4 Global Copra Meal Market – Restraint Impact Analysis Matrix, 2026–2035 |
  20. TABLE 5 Global Copra Meal Market Size, by Region, 2021–2035 (USD Million) |
  21. TABLE 6 North America Copra Meal Market Size, by Country, 2021–2035 (USD Million) |
  22. TABLE 7 Europe Copra Meal Market Size, by Country, 2021–2035 (USD Million) |
  23. TABLE 8 Asia-Pacific Copra Meal Market Size, by Country, 2021–2035 (USD Million) |
  24. TABLE 9 South America Copra Meal Market Size, by Country, 2021–2035 (USD Million) |
  25. TABLE 10 Middle East & Africa Copra Meal Market Size, by Country, 2021–2035 (USD Million) |
  26. TABLE 11 Global Copra Meal Market Size, by Livestock Type, 2021–2035 (USD Million) |
  27. TABLE 12 Global Copra Meal Market Size, by Form, 2021–2035 (USD Million) |
  28. TABLE 13 Global Copra Meal Market Size, by Nature, 2021–2035 (USD Million) |
  29. TABLE 14 Global Copra Meal Market Size, by Distribution Channel, 2021–2035 (USD Million) |
  30. TABLE 15 North America Copra Meal Market Size, by Livestock Type, 2021–2035 (USD Million) |
  31. TABLE 16 North America Copra Meal Market Size, by Form, 2021–2035 (USD Million) |
  32. TABLE 17 Europe Copra Meal Market Size, by Livestock Type, 2021–2035 (USD Million) |
  33. TABLE 18 Europe Copra Meal Market Size, by Nature, 2021–2035 (USD Million) |
  34. TABLE 19 Asia-Pacific Copra Meal Market Size, by Livestock Type, 2021–2035 (USD Million) |
  35. TABLE 20 Asia-Pacific Copra Meal Market Size, by Form, 2021–2035 (USD Million) |
  36. TABLE 21 Asia-Pacific Copra Meal Market Size, by Distribution Channel, 2021–2035 (USD Million) |
  37. TABLE 22 South America Copra Meal Market Size, by Livestock Type, 2021–2035 (USD Million) |
  38. TABLE 23 Middle East & Africa Copra Meal Market Size, by Livestock Type, 2021–2035 (USD Million) |
  39. TABLE 24 Production Analysis – Leading Origin Countries, 2021–2035 |
  40. TABLE 25 Consumption Analysis – Leading Importing Countries, 2021–2035 |
  41. TABLE 26 Import Market Analysis – Volume and Value, 2021–2035 |
  42. TABLE 27 Export Market Analysis – Volume and Value, 2021–2035 |
  43. TABLE 28 Price Trend Analysis – FOB and CIF Benchmarks, 2021–2035 |
  44. TABLE 29 Competitive Benchmarking Matrix – Global Copra Meal Market, 2026 |
  45. TABLE 30 Company Profiles – Key Players, Global Copra Meal Market |
  46. TABLE 31 Recent Developments & Strategic Announcements, 2023–2025 |
  47. TABLE 32 Report Scope & Methodology Summary |
  48. TABLE 33 Detailed Sources and Citations Register
  49. 16 LIST OF FIGURES |
  50. FIGURE 1 Global Copra Meal Market – Market Dynamics Overview (Drivers, Restraints, Opportunities) |
  51. FIGURE 2 Global Copra Meal Market – Industry Value Chain Analysis |
  52. FIGURE 3 Global Copra Meal Market – Porter's Five Forces Analysis |
  53. FIGURE 4 Global Copra Meal Market Size Trend, 2021–2035 (USD Million) |
  54. FIGURE 5 Global Copra Meal Market – Year-over-Year Growth Curve, 2022–2035 |
  55. FIGURE 6 Market Share by Livestock Type, 2025 vs 2035 (%) |
  56. FIGURE 7 Market Share by Form, 2025 vs 2035 (%) |
  57. FIGURE 8 Market Share by Nature, 2025 vs 2035 (%) |
  58. FIGURE 9 Market Share by Distribution Channel, 2025 vs 2035 (%) |
  59. FIGURE 10 Regional Market Share Distribution, 2025 (%) |
  60. FIGURE 11 Regional Market Share Distribution, 2035 (%) |
  61. FIGURE 12 Regional CAGR Comparison, 2026–2035 (%) |
  62. FIGURE 13 Country-Level Contribution within Asia-Pacific, 2025 (%) |
  63. FIGURE 14 Competitive Landscape – Estimated Revenue Share Bands, 2026 |
  64. FIGURE 15 Competitive Positioning Matrix – Scale vs Quality Certification |
  65. FIGURE 16 Price Trend Benchmark – FOB Philippines vs CIF Rotterdam, 2021–2035 |
  66. FIGURE 17 Driver Impact Weighting Chart, 2026–2035 |
  67. FIGURE 18 Restraint Impact Weighting Chart, 2026–2035

Segmentation Quick Reference

DimensionSub-SegmentsDominant SegmentFastest Growing Segment
By Livestock TypeRuminants (Dairy & Beef); Poultry; Swine; Aquaculture; Others (Equine, Pet)Ruminants (Dairy & Beef)Aquaculture
By FormPellets; Expeller Cake / Chunks; Powder / MashPelletsPellets
By NatureConventional; OrganicConventionalOrganic
By Distribution ChannelDirect Mill-to-Feed Manufacturer; Traders & Distributors; Online & Commodity PlatformsDirect Mill-to-Feed ManufacturerOnline & Commodity Platforms
By GeographyNorth America; Europe; Asia-Pacific; South America; Middle East & AfricaAsia-PacificAsia-Pacific


Market Segmentation Overview

By Livestock Type

Sub-SegmentKey Trend
Ruminants (Dairy & Beef)Inclusion rates of 10–20% in concentrate hold steady where milk is priced on fat content
PoultryInclusion capped in single digits by fibre load; used opportunistically on price spreads
SwineGrower-finisher diets absorb the bulk; nursery diets largely excluded
AquacultureShrimp and tilapia formulators qualifying new origins as fishmeal costs stay elevated
Others (Equine, Pet)Small volume, high realisation; tied to organic and specialty claims


Ruminant demand provides the floor under global volumes, while aquaculture supplies the growth slope. Buyers in the two segments behave very differently — dairy cooperatives buy on annual contracts and tolerate wider quality bands, whereas aqua mills specify tightly and switch suppliers quickly.

By Form

Sub-SegmentKey Trend
PelletsIncreasingly written into export contracts for handling efficiency and shrinkage control
Expeller Cake / ChunksPersists in domestic origin-country trade with short haul distances
Powder / MashPreferred by mills with direct in-line dosing and enclosed conveying


Because they decrease shrinkage and increase handling efficiency, pellets are becoming more and more popular in export agreements. In domestic origin-country trade, expeller cake and chunks continue to be significant, especially when transportation distances are minimal. Mills with enclosed conveying systems and direct in-line dosing, which enable effective automated processing, prefer powder and mash.


By Nature

Sub-SegmentKey Trend
ConventionalCost-driven mainstream volume across all consuming regions
OrganicCertification-limited supply meeting organic dairy and pet food demand


Organic remains supply-constrained rather than demand-constrained. Certification of smallholder coconut clusters is administratively heavy, and until group certification models mature, the segment will stay a premium niche.

By Distribution Channel

Sub-SegmentKey Trend
Direct Mill-to-Feed ManufacturerLarge feed groups building origination desks in Manila and Jakarta
Traders & DistributorsAggregation and credit roles intact but margins compressing
Online & Commodity PlatformsDigital B2B platforms improving spot price discovery for smaller buyers


Direct mill-to-feed manufacturers are strengthening their position as large feed groups build origination desks in Manila and Jakarta. Traders and distributors retain important aggregation and credit roles, although margins are compressing. Online and commodity platforms are gaining traction by improving spot price discovery and access for smaller buyers.




Download PDF ×

We do not share your information with anyone. However, we may send you emails based on your report interest from time to time. You may contact us at any time to opt-out.