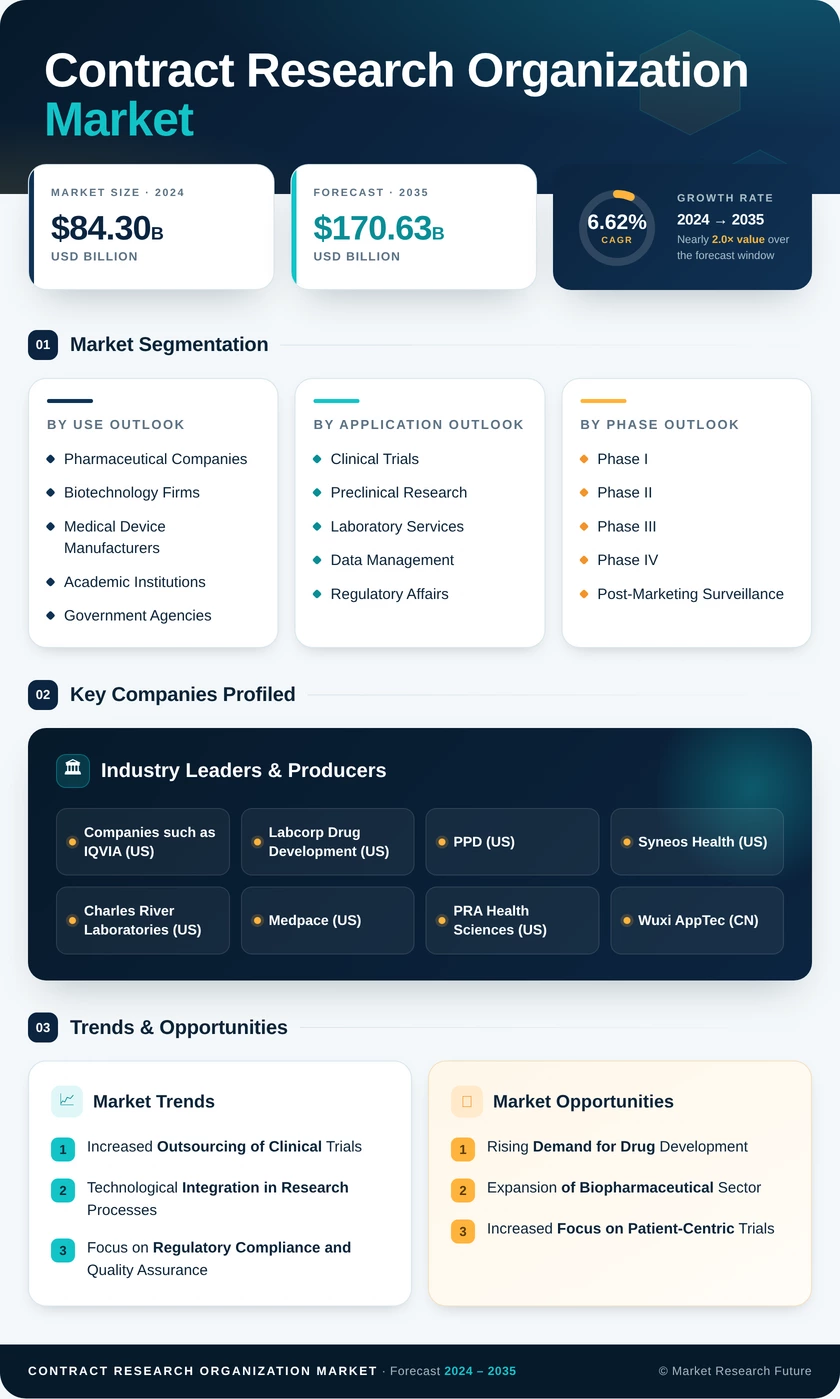
Contract Research Organization Market (2026 - 2035)

ID: MRFR/HS/2389-CR 90 Pages Satyendra Maurya Last Updated: September 29, 2026
Contract Research Organization (CRO) Market Research Report: Size, Share, Trend Analysis By Service Type (Clinical Research Services, Preclinical Services, Laboratory Services, Consulting Services), By Therapeutic Area (Oncology, Cardiology, Neurology, Infectious Diseases, Endocrinology), By End Users (Pharmaceutical Companies, Biotechnology Companies, Medical Device Companies, Academic Institutions), By Phase of Development (Preclinical, Phase I, Phase II, Phase III, Phase IV) and By Regional (North America, Europe, South America, Asia Pacific, Middle East and Africa) - Growth Outlook & Industry Forecast 2025 To 2035
Contract Research Organization Market
Market Size
Forecast Period2026-2035
CAGR (2026-2035)7.8%
2025 Market SizeUSD 81.1 Billion
2035 Market SizeUSD 171.8 Billion
Key Players
IQVIA
ICON plc
Thermo Fisher Scientific
Syneos Health
Parexel
Labcorp
Opportunities
  • AI-Enabled Feasibility and Protocol Design
  • Emerging-Market Site Networks
  • Real-World Evidence and Data-Driven Business Models
  1. 1 Market Summary | |
  2. 2 Key Report Takeaways | |
    1. 2.1 By Service Type | |
    2. 2.2 By Therapeutic Area | |
    3. 2.3 By End User | |
    4. 2.4 By Delivery Model | |
    5. 2.5 By Region | |
  3. 3 Market Size and Forecast (2021–2035) | |
  4. 4 Driver Impact Analysis | |
    1. 4.1 Emerging Biopharma Pipeline Growth | |
    2. 4.2 Rising Protocol Complexity | |
    3. 4.3 Regulatory Modernization | |
    4. 4.4 Decentralized and Digital Trial Technologies | |
    5. 4.5 Pandemic-Preparedness and Vaccine Funding | |
    6. 4.6 Asia-Pacific Site Capacity and Cost Advantage | |
    7. 4.7 Medical Device Evidence Requirements | |
  5. 5 Restraints Impact Analysis | |
    1. 5.1 Biotech Funding Volatility and Cancellations | |
    2. 5.2 Sponsor Pricing Pressure and Vendor Consolidation | |
    3. 5.3 Clinical Workforce and Site Capacity Shortages | |
    4. 5.4 Geopolitical and Data-Sovereignty Restrictions | |
    5. 5.5 Data Privacy and Cybersecurity Compliance Costs | |
  6. 6 Opportunities | |
    1. 6.1 AI-Enabled Feasibility and Protocol Design | |
    2. 6.2 Emerging-Market Site Networks | |
    3. 6.3 Real-World Evidence and Data-Driven Business Models | |
    4. 6.4 Cell, Gene, and Rare Disease Specialist Services | |
    5. 6.5 Device and Diagnostic Validation | |
  7. 7 Regional Market Share and Country-Level Analysis | |
    1. 7.1 North America | | |
      1. 7.1.1 US | | |
      2. 7.1.2 Canada | | |
      3. 7.1.3 Mexico | |
    2. 7.2 Europe | | |
      1. 7.2.1 Germany | | |
      2. 7.2.2 UK | | |
      3. 7.2.3 France | | |
      4. 7.2.4 Italy | | |
      5. 7.2.5 Spain | | |
      6. 7.2.6 Nordic Countries | | |
      7. 7.2.7 Russia | | |
      8. 7.2.8 Rest of Europe | |
    3. 7.3 Asia-Pacific | | |
      1. 7.3.1 China | | |
      2. 7.3.2 India | | |
      3. 7.3.3 Japan | | |
      4. 7.3.4 South Korea | | |
      5. 7.3.5 ASEAN | | |
      6. 7.3.6 Rest of Asia-Pacific | |
    4. 7.4 South America | | |
      1. 7.4.1 Brazil | | |
      2. 7.4.2 Argentina | | |
      3. 7.4.3 Rest of South America | |
    5. 7.5 Middle East & Africa | | |
      1. 7.5.1 Saudi Arabia | | |
      2. 7.5.2 UAE | | |
      3. 7.5.3 South Africa | | |
      4. 7.5.4 Egypt | | |
      5. 7.5.5 Rest of MEA | |
  8. 8 Future Outlook (2026–2035) | |
    1. 8.1 AI-Native Trial Operations | |
    2. 8.2 Platform Economics and Data Ecosystems | |
    3. 8.3 Geographic Rebalancing and Supply-Chain De-Risking | |
    4. 8.4 Sustainability and Patient-Centric Trial Design | |
  9. 9 Segmentation Analysis | |
    1. 9.1 By Service Type | | |
      1. 9.1.1 Early-Phase Development | | |
      2. 9.1.2 Clinical Research Services | | |
      3. 9.1.3 Laboratory Services | | |
      4. 9.1.4 Consulting Services | |
    2. 9.2 By Therapeutic Area | | |
      1. 9.2.1 Oncology | | |
      2. 9.2.2 Infectious Diseases | | |
      3. 9.2.3 Central Nervous System | | |
      4. 9.2.4 Immunology | | |
      5. 9.2.5 Cardiovascular | | |
      6. 9.2.6 Respiratory | | |
      7. 9.2.7 Other Therapeutic Areas | |
    3. 9.3 By End User | | |
      1. 9.3.1 Pharmaceutical & Biopharmaceutical Companies | | |
      2. 9.3.2 Medical Device Companies | | |
      3. 9.3.3 Academic & Government Institutes | | |
      4. 9.3.4 Others | |
    4. 9.4 By Delivery Model | | |
      1. 9.4.1 Full-Service/Integrated | | |
      2. 9.4.2 Functional Service Provider (FSP) | | |
      3. 9.4.3 Hybrid | |
  10. 10 Competitive Landscape | |
  11. 11 Recent News & Developments | |
  12. 12 Report Scope and Methodology | |
  13. 13 Detailed Sources and Citations | |
  14. 14 Frequently Asked Questions (FAQs) | | LIST OF TABLES | |
  15. TABLE 1 Global CRO Market Snapshot, 2025 and 2035 | |
  16. TABLE 2 Global CRO Market Size & Forecast, by Revenue (USD Billion), 2021–2035 | |
  17. TABLE 3 Driver Impact Analysis – Global CRO Market | |
  18. TABLE 4 Restraints Impact Analysis – Global CRO Market | |
  19. TABLE 5 Global CRO Market, Regional Summary, 2025 | |
  20. TABLE 6 North America CRO Market, by Country | |
  21. TABLE 7 Europe CRO Market, by Country | |
  22. TABLE 8 Asia-Pacific CRO Market, by Country | |
  23. TABLE 9 South America CRO Market, by Country | |
  24. TABLE 10 Middle East & Africa CRO Market, by Country | |
  25. TABLE 11 Global CRO Market, by Service Type | |
  26. TABLE 12 Global CRO Market, by Therapeutic Area | |
  27. TABLE 13 Global CRO Market, by End User | |
  28. TABLE 14 Global CRO Market, by Delivery Model | |
  29. TABLE 15 Competitive Benchmarking Matrix – Global CRO Market | |
  30. TABLE 16 Report Scope and Methodology | |
  31. TABLE 17 Detailed Sources and Citations | |
  32. TABLE 18 Segmentation Quick Reference | |
  33. TABLE 19 Service Type Sub-Segment Trends | |
  34. TABLE 20 Therapeutic Area Sub-Segment Trends | |
  35. TABLE 21 End User Sub-Segment Trends | |
  36. TABLE 22 Delivery Model Sub-Segment Trends | | LIST OF FIGURES | |
  37. FIGURE 1 Global CRO Market Dynamics Overview | |
  38. FIGURE 2 CRO Industry Value Chain Analysis | |
  39. FIGURE 3 Porter's Five Forces Analysis – Global CRO Market | |
  40. FIGURE 4 Global CRO Market Size Trend, 2021–2035 (USD Billion) | |
  41. FIGURE 5 Global CRO Market Share, by Service Type, 2025 | |
  42. FIGURE 6 Global CRO Market Share, by Therapeutic Area, 2025 | |
  43. FIGURE 7 Global CRO Market Share, by End User, 2025 | |
  44. FIGURE 8 Global CRO Market Share, by Delivery Model, 2025 | |
  45. FIGURE 9 Global CRO Market Share, by Region, 2025 | |
  46. FIGURE 10 Asia-Pacific CRO Market Growth, by Country, 2026–2035 | |
  47. FIGURE 11 Global CRO Market Competitive Share Analysis, 2025 | |
  48. FIGURE 12 Competitive Positioning Matrix – Key CRO Providers

Segmentation Quick Reference

DimensionSub-SegmentsDominant SegmentFastest Growing Segment
By Service TypeEarly-Phase Development; Clinical Research Services; Laboratory Services; Consulting ServicesClinical Research Services (57.8% share)Early-Phase Development (10.1% CAGR)
By Therapeutic AreaOncology; Infectious Diseases; Central Nervous System; Immunology; Cardiovascular; Respiratory; Other Therapeutic AreasOncology (20.1% share)Infectious Diseases (10.2% CAGR)
By End UserPharmaceutical & Biopharmaceutical Companies; Medical Device Companies; Academic & Government Institutes; OthersPharmaceutical & Biopharmaceutical Companies (52.0% share)Medical Device Companies (9.0% CAGR)
By Delivery ModelFull-Service/Integrated; Functional Service Provider (FSP); HybridFull-Service/Integrated (58.4% share)Functional Service Provider (FSP) (9.8% CAGR)
By RegionNorth America; Europe; Asia-Pacific; South America; Middle East & AfricaNorth America (45.8% share)Asia-Pacific (9.6% CAGR)


Market Segmentation Overview

By Service Type

Sub-SegmentKey Trend
Early-Phase DevelopmentBiotech sponsors outsource Discovery and Pre-clinical work to reach proof-of-concept faster
Clinical Research ServicesPhase I commands premium rates while Phase II and Phase III monitoring commoditizes
Laboratory ServicesBiomarker-selected cohorts raise central and bioanalytical lab volumes
Consulting ServicesDemand concentrates on complex regulatory and adaptive design strategy


Clinical Research Services lead with a 57.8% share because global Phase III programs require site coordination and monitoring capacity few sponsors hold internally. Early-Phase Development grows fastest at a 10.1% CAGR, as venture-funded biotechs pay premiums for rapid first-in-human execution. Laboratory Services gain as biomarker-driven eligibility adds analytical complexity to each enrolled patient.

By Therapeutic Area

Sub-SegmentKey Trend
OncologyActivity shifts from late-stage trials to post-marketing commitments for approved immunotherapies
Infectious DiseasesPreparedness funding and mRNA platforms sustain vaccine trial pipelines
Central Nervous SystemDigital biomarkers reduce reliance on subjective clinical scales
ImmunologyBispecific and autoimmune biologics widen trial volumes
CardiovascularObesity-related outcome studies partly offset generic erosion
RespiratoryBiologic programs replace declining small-molecule inhaler research
Other Therapeutic AreasRare disease programs depend on proprietary patient registries


Oncology holds the leading 20.1% share on the breadth of targeted, immuno-oncology, and cell therapy assets, though its growth is maturing. Infectious Diseases expands fastest at a 10.2% CAGR, backed by public preparedness funding and antimicrobial incentives. Central Nervous System and Immunology programs favor providers with specialist investigator networks able to manage long follow-up.

By End User

Sub-SegmentKey Trend
Pharmaceutical & Biopharmaceutical CompaniesHybrid outsourcing retains strategic oversight while offloading execution
Medical Device CompaniesAI/ML validation and EU MDR rules drive outsourced clinical evidence
Academic & Government InstitutesPrice-sensitive buyers favor regional partners and fixed-price contracts
OthersDiagnostics sponsors seek performance-evaluation studies


Pharmaceutical & Biopharmaceutical Companies remain dominant at a 52.0% share, using preferred-provider agreements to scale tactical execution. Medical Device Companies grow fastest at a 9.0% CAGR because prospective AI validation and cybersecurity testing exceed most device firms' internal clinical capacity. Academic & Government Institutes contribute smaller budgets but high-visibility investigator-initiated research.

By Delivery Model

Sub-SegmentKey Trend
Full-Service/IntegratedCentralized command preferred for global Phase III programs
Functional Service Provider (FSP)Sponsors buy modular capacity in data management, biostatistics, and monitoring
HybridMid-size biotechs combine full-service governance with selective FSP components


Full-Service/Integrated engagements lead with a 58.4% share because turnkey accountability lowers execution risk on large multinational studies. Functional Service Provider (FSP) contracts grow fastest at a 9.8% CAGR, letting sponsors scale specific functions up or down as pipelines change. Hybrid arrangements appeal to budget-constrained biotechs that still need strategic guidance.




Download PDF ×

We do not share your information with anyone. However, we may send you emails based on your report interest from time to time. You may contact us at any time to opt-out.