• Cat-intel
  • MedIntelliX
  • Resources
  • About Us
  • Hero Background
    English
    Chinese
    French
    Japanese
    Korean
    German
    Spanish

    Contactor Market Share

    ID: MRFR/E&P/2799-CR
    173 Pages
    Anshula Mandaokar
    October 2020

    Contactors Market Research Report Information By Product (DC Contractors and AC Contractors), By End User (Electric Vehicles {Passenger Vehicles, Commercial Vehicles, Buses}, Renewable Energy & Storage, Aerospace & Defense, Industrial Machinery, and Others), And By Region (North America, Europe, Asia-Pacific, And Rest Of The World) – Market Forecast Till 2035

    Share:
    Download PDF ×

    We do not share your information with anyone. However, we may send you emails based on your report interest from time to time. You may contact us at any time to opt-out.

    Contactor Market Infographic
    $ 4,950.0
    $ 5,950.0
    $ 7,250.0

    Market Share

    Contactor Market Share Analysis

    The Contactor Market, a crucial component in electrical systems, has seen dynamic shifts in market share positioning strategies to meet evolving industry demands. Companies in this sector employ various strategies to gain a competitive edge and expand their market presence.

    One prevalent approach is differentiation, where companies focus on offering unique features and capabilities in their contactors. This strategy aims to set a product apart from competitors, attracting customers seeking specialized solutions. For instance, some companies may prioritize developing contactors with enhanced durability, while others might focus on energy efficiency or compact designs. By catering to specific needs, companies can carve out a niche market for themselves, thereby securing a distinct market share.

    Another key strategy is cost leadership, where companies aim to become the low-cost producer in the Contactor Market. By optimizing manufacturing processes, sourcing materials efficiently, and streamlining operations, companies can reduce production costs. This allows them to offer competitive pricing, attracting price-sensitive customers and gaining a significant market share. However, it is crucial for companies employing this strategy to maintain a balance between cost-cutting measures and product quality to ensure long-term success.

    Market segmentation is a strategy that involves dividing the Contactor Market into distinct segments based on factors such as industry, application, or geography. Companies then tailor their products to meet the specific needs of each segment, effectively capturing diverse market shares. For example, a company might develop specialized contactors for industrial applications while simultaneously offering a different line of products for residential use. This approach enables companies to address a wide range of customer requirements, enhancing their overall market position.

    Collaborative partnerships are increasingly becoming a vital strategy in the Contactor Market. Companies form alliances with other organizations to combine their strengths and resources. This collaborative approach allows companies to access new markets, technologies, or distribution channels that may have been difficult to penetrate independently. By leveraging the expertise of partners, companies can strengthen their market position and gain a competitive advantage.

    Innovation is a driving force behind market share positioning in the Contactor Market. Companies invest heavily in research and development to introduce cutting-edge technologies and features. By being at the forefront of innovation, companies can attract customers looking for advanced solutions, securing a larger market share. Continuous improvement and staying ahead of technological trends are essential components of this strategy.

    Furthermore, a focus on customer service and satisfaction is crucial for maintaining and expanding market share. Companies that prioritize excellent customer support, warranty programs, and after-sales services build strong relationships with their customers. Satisfied customers are more likely to become repeat buyers and advocates, contributing to the company's market share growth through positive word-of-mouth and brand loyalty.

    The Contactor Market witnesses a dynamic interplay of strategies as companies vie for a larger market share. Differentiation, cost leadership, market segmentation, collaborative partnerships, innovation, and customer-centric approaches all play crucial roles in determining the success and positioning of companies within this competitive landscape. As the industry continues to evolve, companies will need to adapt and refine their strategies to stay ahead in the Contactor Market.

    Market Summary

    As per Market Research Future Analysis, the Global Contactors Market was valued at USD 0.32 billion in 2021 and is projected to grow to USD 0.52 billion by 2030, with a CAGR of 6.30% from 2024 to 2030. The market growth is driven by the rising application of contactors in HVAC systems, electric vehicles (EVs), and renewable energy projects, particularly solar energy. The increasing demand for electricity due to urbanization and industrialization, especially in the Asia-Pacific region, further supports market expansion. The DC contractors segment held a significant market share of approximately 56% in 2021, driven by their use in automotive systems and power distribution networks.

    Key Market Trends & Highlights

    Key trends influencing the Contactors Market include the following:

    • Growing usage of contactors in EVs and HEVs due to rising fuel prices and government incentives.
    • Increasing demand for renewable energy, particularly solar energy, enhancing contactor applications in PV plants.
    • Rapid urbanization in Asia-Pacific, with a projected population increase from 55% in urban areas in 2018 to 68% by 2050.

    Market Size & Forecast

    2021 Market Size USD 0.32 Billion
    2022 Market Size USD 0.34 Billion
    2030 Market Size USD 0.52 Billion
    CAGR (2024-2030) 6.30%
    Largest Regional Market Share in 2021 North America.

    Major Players

    Major players in the Contactors market include Siemens (Germany), Eaton (Ireland), ABB (Switzerland), Schneider Electric (France), and Mitsubishi Electric Corporation (Japan).

    Market Trends

    Growing Usage of Contactors in Electric Vehicles (EVs) and Hybrid Electric Vehicles (HEVs)  to boost market growth

    The demand for EVs and HEVs is increasing owing to the rising fuel prices and incentives rolled out by government bodies. The government across various countries is encouraging the usage of e-mobility to cut down the dependency on crude oil and reduce vehicle pollutions. Numerous automotive manufacturers have started producing electric vehicles or hybrid electric vehicles, subsequently supporting the growth of the market. These contactors are used in EVs or HEVs to isolate the high voltage battery from the high voltage network.

    The growing awareness towards maintaining a clean environment has propelled the growth of renewable energy projects. Solar energy is considered the fastest-growing application in renewable energy. In addition, the continuously increasing demand for growing green energy shares is also supporting the growth of solar energy. The main application for contactors in PV plants is disconnecting the inverter from the PV strings when the required output is low. In addition, these contactors are used to change the PV strings configuration to increase the plant efficiency by diverting other strings to an optimal converter.

    Therefore, such condition has enhanced the Contactors market CAGR across the globe in the recent years. 

    The growing industrialization and urbanization in the Asia Pacific region, especially in China and India, have boosted the electricity demand. The growing population in the region has increased per capita electricity consumption, thus providing an opportunity for the contactor market as these contactors can play important role in controlling the flow of electricity. Rising population and growing urbanization rates are likely to increase energy demand across the globe. According to the United Nations report, in 2018, 55% of the world’s population lives in urban areas, projected to increase to 68% by 2050.

    In addition, rapid urbanization is also supporting the growth of these connectors/.

    However, increasing use of Contactors in the power distribution network for switching an electrical power circuit for smooth functioning of electrical equipment is another factor driving the growth of the Contactors market revenue.

    The Global Contactors Market is poised for growth, driven by increasing demand for automation and energy efficiency across various sectors, indicating a shift towards more sophisticated electrical control solutions.

    U.S. Department of Energy

    Contactor Market Market Drivers

    Market Growth Projections

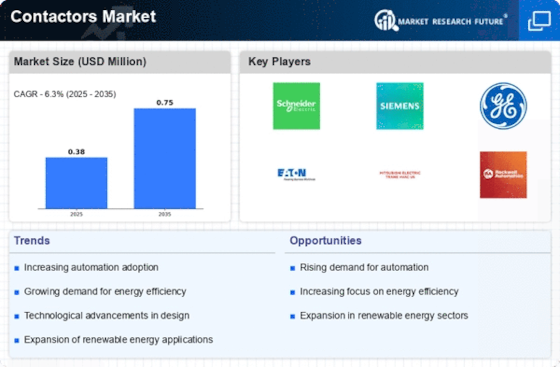
    The Global Contactors Market Industry is poised for substantial growth, with projections indicating a market value of 0.38 USD Billion in 2024 and an anticipated increase to 0.71 USD Billion by 2035. This growth trajectory suggests a compound annual growth rate of 5.79% from 2025 to 2035, reflecting the increasing demand for contactors across various applications. The market dynamics are influenced by factors such as technological advancements, infrastructure development, and the shift towards renewable energy sources. These elements collectively contribute to a robust outlook for the Global Contactors Market Industry.

    Rising Demand for Automation

    The Global Contactors Market Industry experiences a notable surge in demand for automation across various sectors, including manufacturing and construction. As industries increasingly adopt automated systems, the need for reliable contactors to manage electrical loads becomes paramount. For instance, the integration of smart technologies in industrial settings necessitates advanced contactors that can handle higher operational demands. This trend is projected to contribute to the market's growth, with an estimated value of 0.38 USD Billion in 2024, reflecting a shift towards more efficient and automated solutions.

    Growing Focus on Energy Efficiency

    The Global Contactors Market Industry is witnessing a growing focus on energy efficiency across various sectors. As organizations aim to reduce operational costs and minimize environmental impact, the demand for energy-efficient electrical components, including contactors, is increasing. This trend is particularly evident in commercial and industrial applications, where energy savings can lead to substantial cost reductions. For example, the implementation of energy-efficient contactors can enhance system performance while lowering energy consumption. This heightened emphasis on efficiency is likely to drive market growth, as businesses seek to adopt solutions that align with their sustainability objectives.

    Expansion of Renewable Energy Sources

    The Global Contactors Market Industry is significantly influenced by the expansion of renewable energy sources. As countries strive to meet sustainability goals, the adoption of solar and wind energy systems is on the rise. These systems require specialized contactors to manage the electrical flow effectively. For example, the installation of solar panels necessitates contactors that can withstand variable loads and ensure safety. This shift towards renewable energy is expected to drive market growth, with projections indicating a market value of 0.71 USD Billion by 2035, highlighting the increasing reliance on sustainable energy solutions.

    Increasing Infrastructure Development

    The Global Contactors Market Industry is positively impacted by the increasing infrastructure development worldwide. Governments and private sectors are investing heavily in infrastructure projects, including transportation, utilities, and urban development. These projects require reliable electrical systems, where contactors play a vital role in ensuring operational efficiency and safety. For instance, the construction of smart cities necessitates advanced electrical solutions, including contactors that can handle complex load requirements. This ongoing infrastructure boom is expected to bolster the market, as the demand for contactors continues to rise in tandem with these large-scale projects.

    Technological Advancements in Electrical Components

    Technological advancements in electrical components play a crucial role in shaping the Global Contactors Market Industry. Innovations such as enhanced materials and smart technologies enable the development of more efficient and durable contactors. These advancements not only improve performance but also reduce energy consumption, aligning with global sustainability initiatives. As industries seek to optimize their operations, the demand for technologically advanced contactors is likely to rise. This trend is anticipated to contribute to a compound annual growth rate of 5.79% from 2025 to 2035, indicating a robust growth trajectory for the market.

    Market Segment Insights

    Contactors Product Type Insights

    The Contactors Market segmentation, based on product type, includes DC contractors and AC contractors. The DC contractors segment held the majority share in 2021 contribution to around ~56% in respect to the Contactors Market revenue. The Increasing demand for end-use applications of DC contactors and the growing use of contractors in the power distribution network for switching an electrical power circuit for the smooth functioning of electrical equipment are some of the major factors driving the growth of the DC Contactor Market.

    The rise in the production of automobiles across the globe has led to an increase in the use of DC contractors for maintaining the effective demand-side load in automotive systems. Such developments are anticipated to increase the use of DC contractors to maintain stability and ensure sound demand-side load management.

    Source: Secondary Research, Primary Research, Market Research Future Database and Analyst Review

    Contactors End User Insights

    The Contactors Market segmentation, based on End User, includes electric vehicles {passenger vehicles, commercial vehicles, buses}, renewable energy & storage, aerospace & defense, industrial machinery, and others. The electric vehicles segment dominated the market in 2021 and is projected to be the faster-growing segment during the forecast period, 2022-2030 owing to their increasing demand. Electric vehicles are less harmful to the environment, less expensive, and are cheaper to maintain. Therefore, many vehicle manufacturers are producing electric vehicles and hybrid electric vehicles.. Hence, rising applications of for Contactors positively impacts the market growth.

    Get more detailed insights about Contactor Market Research Report - Global Forecast till 2030

    Regional Insights

    By Region, the study provides the market insights into North America, Europe, Asia-Pacific and Rest of the World. North America Contactors market accounted for USD 0.13 billion in 2021 and is expected to exhibit a significant CAGR growth during the study period. According to the American Automotive Policy Council report 2018, the total vehicles manufactured in the US is expected to reach 12 million, per year by 2025. The rise in production of the automotive in the region has led to an increase in the use of Contactors for maintaining the effective demand side load in automotive systems.

    Such developments are expected to increase the use of Contactors to maintain stability and ensuring sound demand side load management. Therefore, the increase in the demand for Contactors is driving the global Contactor market demand during the forecast period.

    Further, the major countries studied in the market report are: The U.S, Canada, Germany, France, UK, Italy, Spain, China, Japan, India, Australia, South Korea, and Brazil.

    Figure 3: Global Contactors Market Share By Region 2021 (%)

    Global Contactors Market Share

    Source: Secondary Research, Primary Research, Market Research Future Database and Analyst Review

    Europe Contactors market accounts for the second-largest market share. In the European region, various countries such as Germany, Argentina, France, and others have set their target of zero-emission of carbon-dioxide by 2050, which has increased the renewable energy projects in the region and has bolstered market growth. In addition, the region has some of the world's largest automotive manufacturers such as Volkswagen Group, BMW, Daimler, Delphi, Ford, Hyundai, Renault, and many others, who are shifting towards EVs and HEVs promoted the usage of these types of contactors in the region.

    Further, the Germany Contactors market held the largest market share, and the UK Contactors market was the fastest growing market in the European region

    The Asia-Pacific Contactors Market is expected to grow at the fastest CAGR from 2022 to 2030. Moreover, the increase in demand due to the growing population and per capita income creates a huge market opportunity for the growth of renewable energy sources in the Asia-Pacific region. Moreover, China Contactors market held the largest market share, and the India Contactors market was the fastest growing market in the Asia-Pacific region

    Key Players and Competitive Insights

    Major market players are spending a lot of money on R&D to increase their product lines, which will help the Contactors market grow even more. Market participants are also taking a range of strategic initiatives to grow their worldwide footprint, with key market developments such as new product launches, contractual agreements, mergers and acquisitions, increased investments, and collaboration with other organizations. Competitors in the Contactors industry must offer cost-effective items to expand and survive in an increasingly competitive and rising market environment.

    One of the primary business strategies adopted by manufacturers in the global Contactors industry to benefit clients and expand the market sector is to manufacture locally to reduce operating costs. In recent years, Contactors industry has provided with some of the most significant benefits. The Contactors market major player such as Medtronic Inc (Ireland), Abbott Laboratories (US), Stryker Corporation (US), and others are working to expand the market demand by investing in research and development activities.

    Siemens AG (Siemens) is engaged in the production and supply of systems for power generation, power transmission, and medical diagnosis. It operates through the power and gas, wind power and renewables, energy management, building technologies, mobility, digital factory, process industries and drives, healthcare, and financial services business divisions. The company offers smart building solutions through its building technology segment. The energy management segment covers high voltage products, low voltage power distribution, power transmission, smart grid solutions and services, transformers, medium voltage switchgear and devices, and energy automation.

    The building technologies segment comprises automation technologies and services for commercial, industrial, and public buildings and infrastructure. In May 2021, Siemens Electric and Allied Electronics & Automation launched the Easy TeSys product line with a short-circuit ratings range up to 35kA at 480V. This product line is targeted at small OEMs, panel builders, and low-capacity motors.

    Also, Trombetta combines industry-leading engineering and innovation with quality manufacturing and unsurpassed customer service. Their products are designed to perform in the harshest conditions across a broad range of markets and industries. In May 2019 Trombetta Inc., a leading automotive parts manufacturer, and distributor have introduced fully sealed full Silver PowerSeal contactors for high-performance and intermittent duty applications.

    Key Companies in the Contactor Market market include

    Industry Developments

    October 2020: As the electrical energy requirement increases, renewable energy sources have become essential means for electricity generation. Hotson International is a leading manufacturer of high voltage contactors in China, has introduced the new Direct current contactors for wind turbine systems. These contactors are ideal for wind energy application to ensure the connection is maintained under strict conditions.

    Schaltbau GmbH presented the C303 contactor family in March 2024, a new product within its Eddicy brand, aimed at use in several markets. This range is designed for stationary charging infrastructure, non-IATF electric vehicles, battery test benches and intralogistics.

    Siemens has pledged to invest €115m in Chippenham, Wiltshire, during March 2024 to create a state-of-the-art factory. The move will improve the firm’s infrastructure.

    December 2023- Hubbell Incorporated consummated the acquisition of Northern Star Holdings Inc., also known as Systems Control commercially, which was owned by Comvest Partners and was a leading manufacturer of substation control and relay panels.

    November 2023: SaaS solution allows Siemens and Elvia to expand grid capacity throughout Norway by 2030.

    November 2023- Hailo Technologies processors were integrated into Schneider Electric to enhance AI capabilities.

    During September 2023, Sensata Technologies said it would be launching GTM400 and GTM500 bidirectional contactors for applications such as energy storage systems, DC fast chargers (EVSEs) and heavy-duty vehicles. The contactor launched can survive up to 1500V applications.

    April 2023: Littelfuse released “DCNLR Series DC contactors,” which had continuous current ratings up to 500 and maximum voltage ratings up to 1800V for eMobility & industrial applications in April ‘23.

    Sunricher partnered with Prince Bay in March 2022. It is viewed as an opportunity that helps them introduce technology into their new projects.

    In January 2022, Mila collaborated with LEDVANCE. Also technological acquisitions may be possible thanks to strategic initiatives. This partnership with LEDVANCE allows the company to expand in the German market.

    Sep ‘21, C&S Electric indeed brought forward its latest DX series of contactors with a busbar termination facility; these contactors are designed in 3 pole configuration to provide improved functionality and flexibility for various electrical applications.

    Future Outlook

    Contactor Market Future Outlook

    The Global Contactors Market is projected to grow at a 5.79% CAGR from 2024 to 2035, driven by technological advancements, increasing automation, and rising demand for energy-efficient solutions.

    New opportunities lie in:

    • Develop smart contactors integrating IoT for enhanced energy management.
    • Expand product lines to include eco-friendly materials and designs.
    • Leverage AI for predictive maintenance solutions in industrial applications.

    By 2035, the market is expected to exhibit robust growth, reflecting advancements and increased demand.

    Market Segmentation

    Contactors Type Outlook

    • DC Contractors
    • AC Contractors

    Contactors End User Outlook

    Electric Vehicles
    • Passenger Vehicles
    • Commercial Vehicles
    • Buses

    Contactors Regional Outlook

    North America
    • US
    • Canada

    Report Scope

    Attribute/Metric Details
    Market Size 2021 USD 0.32 billion
    Market Size 2022 USD 0.34 billion
    Market Size 2030 USD 0.52 billion
    Compound Annual Growth Rate (CAGR) 6.30% (2024-2030)
    Base Year 2023
    Market Forecast Period 2024-2030
    Historical Data 2018 & 2022
    Market Forecast Units Value (USD Billion)
    Report Coverage Revenue Forecast, Market Competitive Landscape, Growth Factors, and Trends
    Segments Covered Product Type, End User, and Region
    Geographies Covered North America, Europe, Asia Pacific, and Rest of the World
    Countries Covered The U.S, Canada, Germany, France, UK, Italy, Spain, China, Japan, India, Australia, South Korea, and Brazil
    Key Companies Profiled Siemens (Germany), Eaton (Ireland), ABB (Switzerland), Schneider Electric (France), Mitsubishi Electric (Japan), TE Connectivity (Switzerland), Toshiba (Japan), LSIS Co. Ltd (South Korea), CG Power and Industrial Solutions Limited (India), Larsen & Toubro Limited (India), Phoenix Contact (Germany), Rockwell Automation, Inc. (US), Fuji Electric FA Components & Systems Co., Ltd. (Japan), Crydom Inc. (Japan), and Panasonic Corporation of North America (US)
    Key Market Opportunities Rising Demand for EVs and HEVs
    Key Market Dynamics Growing awareness towards maintaining a clean environment

    Market Highlights

    Author

    Anshula Mandaokar
    Team Lead - Research

    She holds an experience of about 6+ years in market research and business consulting, working under the spectrum of information communication technology, telecommunications and semiconductor domains. aarti conceptualizes and implements a scalable business strategy and provides strategic leadership to the clients. her expertise lies in market estimation, competitive intelligence, pipeline analysis, customer assessment, etc.

    Leave a Comment

    Latest Comments

    John Doe
    john@example.com

    This is a great article! Really helped me understand the topic better.

    Posted on July 23, 2025, 10:15 AM
    Jane Smith
    jane@domain.com

    Thanks for sharing this. I’ve bookmarked it for later reference.

    Posted on July 22, 2025, 7:45 PM

    FAQs

    How much is the Contactors market?

    The Contactors Market size was valued at USD 0.32 Billion in 2021.

    What is the growth rate of the Contactors market?

    The global market is projected to grow at a CAGR of 4.7% during the forecast period, 2024-2030.

    Which region held the largest market share in the Contactors market?

    North America had the largest share in the global market

    Who are the key players in the Contactors market?

    The key players in the market are Siemens (Germany), Eaton (Ireland), ABB (Switzerland), Schneider Electric (France), Mitsubishi Electric (Japan), TE Connectivity (Switzerland), Toshiba (Japan),etc.

    Who are the end users of contactor?

    Power, automotive, food & beverages, oil & gas, mining, construction, FA Robots, and Data Centers are end-users of contractors.

    Which product type led the Contactors market?

    The DC contractors category dominated the market in 2021.

    Which end user had the largest market share in the Contactors market?

    The electric vehicle had the largest share in the global market.

    1. EXECUTIVE SUMMARY\r\n \r\n1.1 Market Attractiveness
      1. Analysis 18\r\n \r\n1.1.1 Global Contactors Market, By
    2. Type 18\r\n \r\n1.1.2 Global Contactors Market, By Product
    3. 19\r\n \r\n1.1.3 Global Contactors Market, By Number
      1. Of Poles 20\r\n \r\n1.1.4 Global Contactors Market, By
      2. Voltage 21\r\n \r\n1.1.5 Global Contactors Market, By
      3. End-Use 22\r\n \r\n1.1.6 Global Contactors Market, By
      4. Region 23\r\n \r\n2 MARKET INTRODUCTION\r\n \r\n2.1
      5. Definition 24\r\n \r\n2.2 Scope Of The Study 24\r\n \r\n2.3
      6. Market Structure 25\r\n \r\n2.4 Key Buying Criteria 26\r\n \r\n3
      7. MARKET INSIGHTS\r\n \r\n \r\n \r\n4
      8. RESEARCH METHODOLOGY\r\n \r\n4.1 Research Process 30\r\n \r\n4.2
      9. Primary Research 31\r\n \r\n4.3 Secondary Research 32\r\n \r\n4.4
      10. Market Size Estimation 32\r\n \r\n4.5 Forecast Model
      11. 33\r\n \r\n4.6 List Of Assumptions 34\r\n \r\n5
      12. MARKET DYNAMICS\r\n \r\n5.1 Drivers 35\r\n \r\n5.1.1
      13. Need For Effective LMS 35\r\n \r\n5.1.2 Rise In Use Of
      14. Contactors Within HVAC Systems 35\r\n \r\n5.2 Restraints
      15. 36\r\n \r\n5.2.1 High Procurement Cost 36\r\n \r\n5.3
      16. Opportunities 36\r\n \r\n5.3.1 Demand For Electrical
      17. Equipment In Asia-Pacific 36\r\n \r\n5.3.2 Investments
      18. In Commercial And Industrial Sectors 36\r\n \r\n5.4 Evolution
      19. Of Production Technology 36\r\n \r\n5.5 Technology Trends
      20. 37\r\n \r\n5.5.1 Switching To Efficient Electrical System
      21. 37\r\n \r\n5.6 Case Examples 38\r\n \r\n5.6.1
      22. Emerson Electric Co (US) – Smart Contactors 38\r\n \r\n5.6.2
      23. TE Connectivity (Switzerland) – Hartman Smart AC Contactors 38\r\n \r\n5.6.3
      24. Crydom Inc (US) – Hybrid Solid State Contactor 38\r\n \r\n5.6.4
      25. Esterline Technologies Corporation (US) – Leach Smart Relays And Contactors
      26. 38\r\n \r\n5.7 SAFETY STANDARDS 39\r\n \r\n6
      27. MARKET FACTOR ANALYSIS\r\n \r\n6.1 Porter’s Five
      28. Forces Model 40\r\n \r\n6.1.1 Threat Of New Entrants
      29. 40\r\n \r\n6.1.2 Bargaining Power Of Suppliers 41\r\n \r\n6.1.3
      30. Bargaining Power Of Buyers 41\r\n \r\n6.1.4 Threat Of
      31. Substitutes 41\r\n \r\n6.1.5 Rivalry 41\r\n \r\n6.2
      32. Supply Chain Analysis 42\r\n \r\n6.2.1 Design & Development
      33. 42\r\n \r\n6.2.2 Raw Material Supply 42\r\n \r\n6.2.3
      34. Manufacturing & Assembly 43\r\n \r\n6.2.4 Sales And
      35. Distribution 43\r\n \r\n6.2.5 End Use 43\r\n \r\n7
    4. Global Contactors Market, By Type\r\n \r\n7.1 Overview
      1. 44\r\n \r\n7.2 Solid-State Contactor 45\r\n \r\n7.3
      2. Magnetic Contactor 45\r\n \r\n7.4 Vacuum Contactor 45\r\n \r\n7.5
      3. Lighting Contactor 46\r\n \r\n8 Global Contactors Market,
      4. By Product\r\n \r\n8.1 Overview 47\r\n \r\n8.2
      5. DC Contactor 48\r\n \r\n8.3 AC Contactor 48\r\n \r\n9
    5. Global Contactors Market, By Number Of Poles\r\n \r\n9.1
      1. Overview 51\r\n \r\n9.2 2-Pole 52\r\n \r\n9.3
      2. 3-Pole 52\r\n \r\n9.4 4-Pole 52\r\n \r\n9.5
    6. Others 53\r\n \r\n10 Global Contactors Market, By Voltage\r\n \r\n10.1
      1. Overview 54\r\n \r\n10.2 Low Voltage (Up To 1 KV) 55\r\n \r\n10.3
      2. Medium Voltage (1 KV – 7.2 KV) 55\r\n \r\n10.4
      3. High Voltage (Above 7.2 KV) 56\r\n \r\n11 Global Contactors
    7. Market, By End-Use\r\n \r\n11.1 Overview 57\r\n \r\n11.2
      1. Automotive 59\r\n \r\n11.3 Power 59\r\n \r\n11.4
      2. Oil & Gas 59\r\n \r\n11.5 Food & Beverage 59\r\n \r\n11.6
      3. Construction 59\r\n \r\n11.7 Mining 60\r\n \r\n11.8
      4. Data Centers 60\r\n \r\n11.9 FA Robots 60\r\n \r\n11.10
      5. Power Storage Battery Systems 60\r\n \r\n11.11 AGV And
      6. AMR 60\r\n \r\n11.12 Others 61\r\n \r\n12
    8. Global Contactors Market, By Region\r\n \r\n12.1 Overview
      1. 62\r\n \r\n12.2 North America 63\r\n \r\n12.2.1
      2. US 66\r\n \r\n12.2.2 Canada 68\r\n \r\n12.2.3
      3. Mexico 71\r\n \r\n12.3 Asia-Pacific 74\r\n \r\n12.3.1
      4. China 77\r\n \r\n12.3.2 India 79\r\n \r\n12.3.3
      5. Japan 82\r\n \r\n12.3.4 Australia 84\r\n \r\n12.3.5
      6. Rest Of Asia-Pacific 86\r\n \r\n12.4 Europe 89\r\n \r\n12.4.1
      7. Germany 92\r\n \r\n12.4.2 UK 94\r\n \r\n12.4.3
      8. France 97\r\n \r\n12.4.4 Italy 99\r\n \r\n12.4.5
      9. Rest Of Europe 102\r\n \r\n12.5 Middle East & Africa
      10. 105\r\n \r\n12.5.1 Saudi Arabia 108\r\n \r\n12.5.2
      11. UAE 110\r\n \r\n12.5.3 South Africa 113\r\n \r\n12.5.4
      12. Rest Of Middle East & Africa 115\r\n \r\n12.6 South
      13. America 118\r\n \r\n12.6.1 Argentina 120\r\n \r\n12.6.2
      14. Brazil 123\r\n \r\n12.6.3 Rest Of South America 125\r\n \r\n13
      15. Competitive Landscape\r\n \r\n13.1 Competitive Scenario
      16. 128\r\n \r\n13.1.1 Competitive Overview 128\r\n \r\n13.2
      17. Competitor Dashboard 129\r\n \r\n13.3 Major Growth Strategy
      18. In The Global Contactor Market 130\r\n \r\n13.4 Competitive
      19. Benchmarking 131\r\n \r\n13.5 Market Share Analysis 132\r\n \r\n13.6
      20. TE Connectivity: The Leading Player In Terms Of Number Of Developments In Global
      21. Contactor Market 132\r\n \r\n14 Company Profiles\r\n \r\n14.1
      22. Siemens 133\r\n \r\n14.1.1 Company Overview 133\r\n \r\n14.1.2
      23. Financial Overview 134\r\n \r\n14.1.3 Products Offered
      24. 135\r\n \r\n14.1.4 Key Developments 135\r\n \r\n14.1.5
      25. SWOT Analysis 136\r\n \r\n14.1.6 Key Strategies 136\r\n \r\n14.2
      26. Eaton 137\r\n \r\n14.2.1 Company Overview 137\r\n \r\n14.2.2
      27. Financial Overview 137\r\n \r\n14.2.3 Products Offered
      28. 138\r\n \r\n14.2.4 Key Developments 138\r\n \r\n14.2.5
      29. SWOT Analysis 139\r\n \r\n14.2.6 Key Strategies 139\r\n \r\n14.3
      30. ABB 140\r\n \r\n14.3.1 Company Overview 140\r\n \r\n14.3.2
      31. Financial Overview 141\r\n \r\n14.3.3 Products Offered
      32. 141\r\n \r\n14.3.4 Key Developments 143\r\n \r\n14.3.5
      33. SWOT Analysis 143\r\n \r\n14.3.6 Key Strategies 143\r\n \r\n14.4
      34. Schneider Electric 144\r\n \r\n14.4.1 Company Overview
      35. 144\r\n \r\n14.4.2 Financial Overview 144\r\n \r\n14.4.3
      36. Products Offered 145\r\n \r\n14.4.4 Key Developments
      37. 145\r\n \r\n14.4.5 SWOT Analysis 145\r\n \r\n14.4.6
      38. Key Strategies 146\r\n \r\n14.5 Mitsubishi Electric Corporation
      39. 147\r\n \r\n14.5.1 Company Overview 147\r\n \r\n14.5.2
      40. Financial Overview 148\r\n \r\n14.5.3 Products Offered
      41. 149\r\n \r\n14.5.4 Key Developments 149\r\n \r\n14.6
      42. TE Connectivity 150\r\n \r\n14.6.1 Company Overview 150\r\n \r\n14.6.2
      43. Financial Overview 150\r\n \r\n14.6.3 Products Offered
      44. 151\r\n \r\n14.6.4 Key Developments 151\r\n \r\n14.6.5
      45. SWOT Analysis 152\r\n \r\n14.6.6 Key Strategies 152\r\n \r\n14.7
      46. Toshiba Corporation 153\r\n \r\n14.7.1 Company Overview
      47. 153\r\n \r\n14.7.2 Financial Overview 153\r\n \r\n14.7.3
      48. Products Offered 154\r\n \r\n14.7.4 Key Developments
      49. 154\r\n \r\n14.8 LSIS Co. Ltd 155\r\n \r\n14.8.1
      50. Company Overview 155\r\n \r\n14.8.2 Financial Overview
      51. 155\r\n \r\n14.8.3 Products Offered 156\r\n \r\n14.8.4
      52. Key Developments 156\r\n \r\n14.9 CG Power And Industrial
      53. Solutions Limited 157\r\n \r\n14.9.1 Company Overview
      54. 157\r\n \r\n14.9.2 Financial Overview 158\r\n \r\n14.9.3
      55. Products Offered 158\r\n \r\n14.9.4 Key Developments
      56. 159\r\n \r\n14.10 Larsen & Toubro Limited 160\r\n \r\n14.10.1
      57. Company Overview 160\r\n \r\n14.10.2 Financial Overview
      58. 161\r\n \r\n14.10.3 Products Offered 162\r\n \r\n14.10.4
      59. Key Developments 162\r\n \r\n14.11 Phoenix Contact 163\r\n \r\n14.11.1
      60. Company Overview 163\r\n \r\n14.11.2 Financial Overview
      61. 163\r\n \r\n14.11.3 Products Offered 163\r\n \r\n14.11.4
      62. Key Developments 163\r\n \r\n14.12 Rockwell Automation,
      63. Inc. 164\r\n \r\n14.12.1 Company Overview 164\r\n \r\n14.12.2
      64. Financial Overview 165\r\n \r\n14.12.3 Products/Services
      65. Offered 166\r\n \r\n14.12.4 Key Developments 167\r\n \r\n14.13
      66. Fuji Electric FA Components & Systems Co., Ltd. 168\r\n \r\n14.13.1
      67. Company Overview 168\r\n \r\n14.13.2 Financial Overview
      68. 168\r\n \r\n14.13.3 Products Offered 168\r\n \r\n14.13.4
      69. Key Developments 169\r\n \r\n14.14 Crydom Inc. 170\r\n \r\n14.14.1
      70. Company Overview 170\r\n \r\n14.14.2 Financial Overview
      71. 170\r\n \r\n14.14.3 Products Offered 170\r\n \r\n14.14.4
      72. Key Developments 171\r\n \r\n14.15 Panasonic Corporation
      73. Of North America 172\r\n \r\n14.15.1 Company Overview
      74. 172\r\n \r\n14.15.2 Financial Overview 172\r\n \r\n14.15.3
      75. Products Offered 172\r\n \r\n14.15.4 Key Developments
      76. 172\r\n \r\n15 LIST OF TABLES\r\n \r\nTABLE
    9. LIST OF ASSUMPTIONS 34\r\n \r\nTABLE 2 GLOBAL CONTACTORS
    10. MARKET ESTIMATES & FORECAST, BY TYPE, 2024–2030 (USD MILLION) 44\r\n \r\nTABLE
    11. GLOBAL Contactor MARKET ESTIMATES & FORECAST, BY PRODUCT, 2024–2030
      1. (USD MILLION) 47\r\n \r\nTABLE 4 GLOBAL Contactor MARKET
      2. ESTIMATES & FORECAST, BY DC Contactor, 2024–2030 (USD MILLION) 49\r\n \r\nTABLE
    12. GLOBAL Contactor MARKET ESTIMATES & FORECAST, BY AC Contactor, 2024–2030
      1. (USD MILLION) 50\r\n \r\nTABLE 6 GLOBAL Contactor MARKET
      2. ESTIMATES & FORECAST, BY NUMBER OF POLES, 2024–2030 (USD MILLION) 51\r\n \r\nTABLE
    13. GLOBAL CONTACTORS MARKET ESTIMATES & FORECAST, BY VOLTAGE, 2024–2030
      1. (USD MILLION) 54\r\n \r\nTABLE 8 GLOBAL CONTACTORS MARKET
      2. ESTIMATES & FORECAST, BY END-USE, 2024–2030 (USD MILLION) 58\r\n \r\nTABLE
    14. GLOBAL CONTACTORS MARKET, BY REGION, 2024–2030 (USD MILLION) 62\r\n \r\nTABLE
    15. NORTH AMERICA: CONTACTORS MARKET, BY COUNTRY, 2024–2030 (USD MILLION) 63\r\n \r\nTABLE
    16. NORTH AMERICA: CONTACTORS MARKET, BY TYPE, 2024–2030 (USD MILLION) 64\r\n \r\nTABLE
    17. NORTH AMERICA: CONTACTORS MARKET ESTIMATES & FORECAST, BY PRODUCT, 2024–2030
      1. (USD MILLION) 64\r\n \r\nTABLE 13 NORTH AMERICA: CONTACTORS
    18. MARKET ESTIMATES & FORECAST, BY NUMBER OF POLES, 2024–2030 (USD MILLION)
      1. 64\r\n \r\nTABLE 14 NORTH AMERICA: CONTACTORS MARKET
      2. ESTIMATES & FORECAST, BY VOLTAGE, 2024–2030 (USD MILLION) 65\r\n \r\nTABLE
    19. NORTH AMERICA: CONTACTORS MARKET ESTIMATES & FORECAST, BY END-USE, 2024–2030
      1. (USD MILLION) 65\r\n \r\nTABLE 16 US: CONTACTORS MARKET,
      2. BY TYPE, 2024–2030 (USD MILLION) 66\r\n \r\nTABLE
    20. US: CONTACTORS MARKET ESTIMATES & FORECAST, BY PRODUCT, 2024–2030 (USD
      1. MILLION) 66\r\n \r\nTABLE 18 US: CONTACTORS MARKET ESTIMATES
      2. & FORECAST, BY NUMBER OF POLES, 2024–2030 (USD MILLION) 67\r\n \r\nTABLE
    21. US: CONTACTORS MARKET ESTIMATES & FORECAST, BY VOLTAGE, 2024–2030 (USD
      1. MILLION) 67\r\n \r\nTABLE 20 US: CONTACTORS MARKET ESTIMATES
      2. & FORECAST, BY END-USE, 2024–2030 (USD MILLION) 68\r\n \r\nTABLE
    22. CANADA: CONTACTORS MARKET, BY TYPE, 2024–2030 (USD MILLION) 69\r\n \r\nTABLE
    23. CANADA: CONTACTORS MARKET ESTIMATES & FORECAST, BY PRODUCT, 2024–2030
      1. (USD MILLION) 69\r\n \r\nTABLE 23 CANADA: CONTACTORS
    24. MARKET ESTIMATES & FORECAST, BY NUMBER OF POLES, 2024–2030 (USD MILLION)
      1. 70\r\n \r\nTABLE 24 CANADA: CONTACTORS MARKET ESTIMATES
      2. & FORECAST, BY VOLTAGE, 2024–2030 (USD MILLION) 70\r\n \r\nTABLE
    25. CANADA: CONTACTORS MARKET ESTIMATES & FORECAST, BY END-USE, 2024–2030
      1. (USD MILLION) 71\r\n \r\nTABLE 26 MEXICO: CONTACTORS
    26. MARKET, BY TYPE, 2024–2030 (USD MILLION) 71\r\n \r\nTABLE
    27. MEXICO: CONTACTORS MARKET ESTIMATES & FORECAST, BY PRODUCT, 2024–2030(USD
      1. MILLION) 72\r\n \r\nTABLE 28 MEXICO: CONTACTORS MARKET
      2. ESTIMATES & FORECAST, BY NUMBER OF POLES, 2024–2030 (USD MILLION) 72\r\n \r\nTABLE
    28. MEXICO: CONTACTORS MARKET ESTIMATES & FORECAST, BY VOLTAGE, 2024–2030
      1. (USD MILLION) 73\r\n \r\nTABLE 30 MEXICO: CONTACTORS
    29. MARKET ESTIMATES & FORECAST, BY END-USE, 2024–2030 (USD MILLION) 73\r\n \r\nTABLE
    30. ASIA-PACIFIC: CONTACTORS MARKET, BY COUNTRY, 2024–2030 (USD MILLION) 74\r\n \r\nTABLE
    31. ASIA-PACIFIC: CONTACTORS MARKET, BY TYPE, 2024–2030 (USD MILLION) 75\r\n \r\nTABLE
    32. ASIA-PACIFIC: CONTACTORS MARKET ESTIMATES & FORECAST, BY PRODUCT, 2024–2030
      1. (USD MILLION) 75\r\n \r\nTABLE 34 ASIA-PACIFIC: CONTACTORS
    33. MARKET ESTIMATES & FORECAST, BY NUMBER OF POLES, 2024–2030 (USD MILLION)
      1. 75\r\n \r\nTABLE 35 ASIA-PACIFIC: CONTACTORS MARKET ESTIMATES
      2. & FORECAST, BY VOLTAGE, 2024–2030 (USD MILLION) 76\r\n \r\nTABLE
    34. ASIA-PACIFIC: CONTACTORS MARKET ESTIMATES & FORECAST, BY END-USE, 2024–2030
      1. (USD MILLION) 76\r\n \r\nTABLE 37 CHINA: CONTACTORS MARKET,
      2. BY TYPE, 2024–2030 (USD MILLION) 77\r\n \r\nTABLE
    35. CHINA: CONTACTORS MARKET ESTIMATES & FORECAST, BY PRODUCT, 2024–2030
      1. (USD MILLION) 77\r\n \r\nTABLE 39 CHINA: CONTACTORS MARKET
      2. ESTIMATES & FORECAST, BY NUMBER OF POLES, 2024–2030 (USD MILLION) 78\r\n \r\nTABLE
    36. CHINA: CONTACTORS MARKET ESTIMATES & FORECAST, BY VOLTAGE, 2024–2030
      1. (USD MILLION) 78\r\n \r\nTABLE 41 CHINA: CONTACTORS MARKET
      2. ESTIMATES & FORECAST, BY END-USE, 2024–2030 (USD MILLION) 79\r\n \r\nTABLE
    37. INDIA: CONTACTORS MARKET, BY TYPE, 2024–2030 (USD MILLION) 79\r\n \r\nTABLE
    38. INDIA: CONTACTORS MARKET ESTIMATES & FORECAST, BY PRODUCT, 2024–2030
      1. (USD MILLION) 80\r\n \r\nTABLE 44 INDIA: CONTACTORS MARKET
      2. ESTIMATES & FORECAST, BY NUMBER OF POLES, 2024–2030 (USD MILLION) 80\r\n \r\nTABLE
    39. INDIA: CONTACTORS MARKET ESTIMATES & FORECAST, BY VOLTAGE, 2024–2030
      1. (USD MILLION) 81\r\n \r\nTABLE 46 INDIA: CONTACTORS MARKET
      2. ESTIMATES & FORECAST, BY END-USE, 2024–2030 (USD MILLION) 81\r\n \r\nTABLE
    40. JAPAN: CONTACTORS MARKET, BY TYPE, 2024–2030 (USD MILLION) 82\r\n \r\nTABLE
    41. JAPAN: CONTACTORS MARKET ESTIMATES & FORECAST, BY PRODUCT, 2024–2030
      1. (USD MILLION) 82\r\n \r\nTABLE 49 JAPAN: CONTACTORS MARKET
      2. ESTIMATES & FORECAST, BY NUMBER OF POLES, 2024–2030 (USD MILLION) 83\r\n \r\nTABLE
    42. JAPAN: CONTACTORS MARKET ESTIMATES & FORECAST, BY VOLTAGE, 2024–2030
      1. (USD MILLION) 83\r\n \r\nTABLE 51 JAPAN: CONTACTORS MARKET
      2. ESTIMATES & FORECAST, BY END-USE, 2024–2030 (USD MILLION) 84\r\n \r\nTABLE
    43. AUSTRALIA: CONTACTORS MARKET, BY TYPE, 2024–2030 (USD MILLION) 84\r\n \r\nTABLE
    44. AUSTRALIA: CONTACTORS MARKET ESTIMATES & FORECAST, BY PRODUCT, 2024–2030(USD
      1. MILLION) 85\r\n \r\nTABLE 54 AUSTRALIA: CONTACTORS MARKET
      2. ESTIMATES & FORECAST, BY NUMBER OF POLES, 2024–2030 (USD MILLION) 85\r\n \r\nTABLE
    45. AUSTRALIA: CONTACTORS MARKET ESTIMATES & FORECAST, BY VOLTAGE, 2024–2030
      1. (USD MILLION) 85\r\n \r\nTABLE 56 AUSTRALIA: CONTACTORS
    46. MARKET ESTIMATES & FORECAST, BY END-USE, 2024–2030 (USD MILLION) 86\r\n \r\nTABLE
    47. REST OF ASIA-PACIFIC: CONTACTORS MARKET, BY TYPE, 2024–2030 (USD MILLION)
      1. 87\r\n \r\nTABLE 58 REST OF ASIA-PACIFIC: CONTACTORS
    48. MARKET ESTIMATES & FORECAST, BY PRODUCT, 2024–2030 (USD MILLION) 87\r\n \r\nTABLE
    49. REST OF ASIA-PACIFIC: CONTACTORS MARKET ESTIMATES & FORECAST, BY NUMBER OF
      1. POLES, 2024–2030 (USD MILLION) 87\r\n \r\nTABLE
    50. REST OF ASIA-PACIFIC: CONTACTORS MARKET ESTIMATES & FORECAST, BY VOLTAGE,
    51. OF ASIA-PACIFIC: CONTACTORS MARKET ESTIMATES & FORECAST, BY END-USE, 2024–2030
      1. (USD MILLION) 88\r\n \r\nTABLE 62 EUROPE: CONTACTORS
    52. MARKET, BY COUNTRY, 2024–2030 (USD MILLION) 89\r\n \r\nTABLE
    53. EUROPE: CONTACTORS MARKET, BY TYPE, 2024–2030 (USD MILLION) 90\r\n \r\nTABLE
    54. EUROPE: CONTACTORS MARKET ESTIMATES & FORECAST, BY PRODUCT, 2024–2030(USD
      1. MILLION) 90\r\n \r\nTABLE 65 EUROPE: CONTACTORS MARKET
      2. ESTIMATES & FORECAST, BY NUMBER OF POLES, 2024–2030 (USD MILLION) 90\r\n \r\nTABLE
    55. EUROPE: CONTACTORS MARKET ESTIMATES & FORECAST, BY VOLTAGE, 2024–2030
      1. (USD MILLION) 91\r\n \r\nTABLE 67 EUROPE: CONTACTORS
    56. MARKET ESTIMATES & FORECAST, BY END-USE, 2024–2030 (USD MILLION) 91\r\n \r\nTABLE
    57. GERMANY: CONTACTORS MARKET, BY TYPE, 2024–2030 (USD MILLION) 92\r\n \r\nTABLE
    58. GERMANY: CONTACTORS MARKET ESTIMATES & FORECAST, BY PRODUCT, 2024–2030(USD
      1. MILLION) 92\r\n \r\nTABLE 70 GERMANY: CONTACTORS MARKET
      2. ESTIMATES & FORECAST, BY NUMBER OF POLES, 2024–2030 (USD MILLION) 93\r\n \r\nTABLE
    59. GERMANY: CONTACTORS MARKET ESTIMATES & FORECAST, BY VOLTAGE, 2024–2030
      1. (USD MILLION) 93\r\n \r\nTABLE 72 GERMANY: CONTACTORS
    60. MARKET ESTIMATES & FORECAST, BY END-USE, 2024–2030 (USD MILLION) 94\r\n \r\nTABLE
    61. UK: CONTACTORS MARKET, BY TYPE, 2024–2030 (USD MILLION) 94\r\n \r\nTABLE
    62. UK: CONTACTORS MARKET ESTIMATES & FORECAST, BY PRODUCT, 2024–2030(USD
      1. MILLION) 95\r\n \r\nTABLE 75 UK: CONTACTORS MARKET ESTIMATES
      2. & FORECAST, BY NUMBER OF POLES, 2024–2030(USD MILLION) 95\r\n \r\nTABLE
    63. UK: CONTACTORS MARKET ESTIMATES & FORECAST, BY VOLTAGE, 2024–2030 (USD
      1. MILLION) 96\r\n \r\nTABLE 77 UK: CONTACTORS MARKET ESTIMATES
      2. & FORECAST, BY END-USE, 2024–2030 (USD MILLION) 96\r\n \r\nTABLE
    64. FRANCE: CONTACTORS MARKET, BY TYPE, 2024–2030 (USD MILLION) 97\r\n \r\nTABLE
    65. FRANCE: CONTACTORS MARKET ESTIMATES & FORECAST, BY PRODUCT, 2024–2030(USD
      1. MILLION) 97\r\n \r\nTABLE 80 FRANCE: CONTACTORS MARKET
      2. ESTIMATES & FORECAST, BY NUMBER OF POLES, 2024–2030 (USD MILLION) 98\r\n \r\nTABLE
    66. FRANCE: CONTACTORS MARKET ESTIMATES & FORECAST, BY VOLTAGE, 2024–2030
      1. (USD MILLION) 98\r\n \r\nTABLE 82 FRANCE: CONTACTORS
    67. MARKET ESTIMATES & FORECAST, BY END-USE, 2024–2030 (USD MILLION) 99\r\n \r\nTABLE
    68. ITALY: CONTACTORS MARKET, BY TYPE, 2024–2030 (USD MILLION) 99\r\n \r\nTABLE
    69. ITALY: CONTACTORS MARKET ESTIMATES & FORECAST, BY PRODUCT, 2024–2030
      1. (USD MILLION) 100\r\n \r\nTABLE 85 ITALY: CONTACTORS
    70. MARKET ESTIMATES & FORECAST, BY NUMBER OF POLES, 2024–2030 (USD MILLION)
      1. 100\r\n \r\nTABLE 86 ITALY: CONTACTORS MARKET ESTIMATES
      2. & FORECAST, BY VOLTAGE, 2024–2030 (USD MILLION) 101\r\n \r\nTABLE
    71. ITALY: CONTACTORS MARKET ESTIMATES & FORECAST, BY END-USE, 2024–2030
      1. (USD MILLION) 101\r\n \r\nTABLE 88 REST OF EUROPE: CONTACTORS
    72. MARKET, BY TYPE, 2024–2030 (USD MILLION) 102\r\n \r\nTABLE
    73. REST OF EUROPE: CONTACTORS MARKET ESTIMATES & FORECAST, BY PRODUCT, 2024–2030
      1. (USD MILLION) 102\r\n \r\nTABLE 90 REST OF EUROPE: CONTACTORS
    74. MARKET ESTIMATES & FORECAST, BY NUMBER OF POLES, 2024–2030 (USD MILLION)
      1. 103\r\n \r\nTABLE 91 REST OF EUROPE: CONTACTORS MARKET
      2. ESTIMATES & FORECAST, BY VOLTAGE, 2024–2030 (USD MILLION) 103\r\n \r\nTABLE
    75. REST OF EUROPE: CONTACTORS MARKET ESTIMATES & FORECAST, BY END-USE, 2024–2030
      1. (USD MILLION) 104\r\n \r\nTABLE 93 MIDDLE EAST &
    76. AFRICA: CONTACTORS MARKET, BY COUNTRY, 2024–2030 (USD MILLION) 105\r\n \r\nTABLE
    77. MIDDLE EAST & AFRICA: CONTACTORS MARKET, BY TYPE, 2024–2030 (USD MILLION)
      1. 106\r\n \r\nTABLE 95 MIDDLE EAST & AFRICA: CONTACTORS
    78. MARKET ESTIMATES & FORECAST, BY PRODUCT, 2024–2030(USD MILLION) 106\r\n \r\nTABLE
    79. MIDDLE EAST & AFRICA: CONTACTORS MARKET ESTIMATES & FORECAST, BY NUMBER
      1. OF POLES, 2024–2030 (USD MILLION) 106\r\n \r\nTABLE
    80. MIDDLE EAST & AFRICA: CONTACTORS MARKET ESTIMATES & FORECAST, BY VOLTAGE,
    81. EAST & AFRICA: CONTACTORS MARKET ESTIMATES & FORECAST, BY END-USE, 2024–2030
      1. (USD MILLION) 107\r\n \r\nTABLE 99 SAUDI ARABIA: CONTACTORS
    82. MARKET, BY TYPE, 2024–2030 (USD MILLION) 108\r\n \r\nTABLE
    83. SAUDI ARABIA: CONTACTORS MARKET ESTIMATES & FORECAST, BY PRODUCT, 2024–2030
      1. (USD MILLION) 108\r\n \r\nTABLE 101 SAUDI ARABIA: CONTACTORS
    84. MARKET ESTIMATES & FORECAST, BY NUMBER OF POLES, 2024–2030 (USD MILLION)
      1. 109\r\n \r\nTABLE 102 SAUDI ARABIA: CONTACTORS MARKET
      2. ESTIMATES & FORECAST, BY VOLTAGE, 2024–2030 (USD MILLION) 109\r\n \r\nTABLE
    85. SAUDI ARABIA: CONTACTORS MARKET ESTIMATES & FORECAST, BY END-USE, 2024–2030
      1. (USD MILLION) 110\r\n \r\nTABLE 104 UAE: CONTACTORS MARKET,
      2. BY TYPE, 2024–2030 (USD MILLION) 110\r\n \r\nTABLE
    86. UAE: CONTACTORS MARKET ESTIMATES & FORECAST, BY PRODUCT, 2024–2030
      1. (USD MILLION) 111\r\n \r\nTABLE 106 UAE: CONTACTORS MARKET
      2. ESTIMATES & FORECAST, BY NUMBER OF POLES, 2024–2030 (USD MILLION) 111\r\n \r\nTABLE
    87. UAE: CONTACTORS MARKET ESTIMATES & FORECAST, BY VOLTAGE, 2024–2030
      1. (USD MILLION) 112\r\n \r\nTABLE 108 UAE: CONTACTORS MARKET
      2. ESTIMATES & FORECAST, BY END-USE, 2024–2030 (USD MILLION) 112\r\n \r\nTABLE
    88. SOUTH AFRICA: CONTACTORS MARKET, BY TYPE, 2024–2030 (USD MILLION) 113\r\n \r\nTABLE
    89. SOUTH AFRICA: CONTACTORS MARKET ESTIMATES & FORECAST, BY PRODUCT, 2024–2030
      1. (USD MILLION) 113\r\n \r\nTABLE 111 SOUTH AFRICA: CONTACTORS
    90. MARKET ESTIMATES & FORECAST, BY NUMBER OF POLES, 2024–2030 (USD MILLION)
      1. 114\r\n \r\nTABLE 112 SOUTH AFRICA: CONTACTORS MARKET
      2. ESTIMATES & FORECAST, BY VOLTAGE, 2024–2030 (USD MILLION) 114\r\n \r\nTABLE
    91. SOUTH AFRICA: CONTACTORS MARKET ESTIMATES & FORECAST, BY END-USE, 2024–2030
      1. (USD MILLION) 115\r\n \r\nTABLE 114 REST OF MIDDLE EAST
    92. & AFRICA: CONTACTORS MARKET, BY TYPE, 2024–2030 (USD MILLION) 115\r\n \r\nTABLE
    93. REST OF MIDDLE EAST & AFRICA: CONTACTORS MARKET ESTIMATES & FORECAST,
      1. BY PRODUCT, 2024–2030 (USD MILLION) 116\r\n \r\nTABLE
    94. REST OF MIDDLE EAST & AFRICA: CONTACTORS MARKET ESTIMATES & FORECAST,
      1. BY NUMBER OF POLES, 2024–2030\r\n \r\n(USD MILLION)
      2. 116\r\n \r\nTABLE 117 REST OF MIDDLE EAST & AFRICA:
    95. CONTACTORS MARKET ESTIMATES & FORECAST, BY VOLTAGE, 2024–2030 (USD MILLION)
      1. 117\r\n \r\nTABLE 118 REST OF MIDDLE EAST & AFRICA:
    96. CONTACTORS MARKET ESTIMATES & FORECAST, BY END-USE, 2024–2030 (USD MILLION)
      1. 117\r\n \r\nTABLE 119 SOUTH AMERICA: CONTACTORS MARKET,
      2. BY COUNTRY, 2024–2030 (USD MILLION) 118\r\n \r\nTABLE
    97. SOUTH AMERICA: CONTACTORS MARKET, BY TYPE, 2024–2030 (USD MILLION) 118\r\n \r\nTABLE
    98. SOUTH AMERICA: CONTACTORS MARKET ESTIMATES & FORECAST, BY PRODUCT, 2024–2030
      1. (USD MILLION) 119\r\n \r\nTABLE 122 SOUTH AMERICA: CONTACTORS
    99. MARKET ESTIMATES & FORECAST, BY NUMBER OF POLES, 2024–2030 (USD MILLION)
      1. 119\r\n \r\nTABLE 123 SOUTH AMERICA: CONTACTORS MARKET
      2. ESTIMATES & FORECAST, BY VOLTAGE, 2024–2030 (USD MILLION) 119\r\n \r\nTABLE
    100. SOUTH AMERICA: CONTACTORS MARKET ESTIMATES & FORECAST, BY END-USE, 2024–2030
      1. (USD MILLION) 120\r\n \r\nTABLE 125 ARGENTINA: CONTACTORS
    101. MARKET, BY TYPE, 2024–2030 (USD MILLION) 121\r\n \r\nTABLE
    102. ARGENTINA: CONTACTORS MARKET ESTIMATES & FORECAST, BY PRODUCT, 2024–2030(USD
      1. MILLION) 121\r\n \r\nTABLE 127 ARGENTINA: CONTACTORS
    103. MARKET ESTIMATES & FORECAST, BY NUMBER OF POLES, 2024–2030 (USD MILLION)
      1. 121\r\n \r\nTABLE 128 ARGENTINA: CONTACTORS MARKET ESTIMATES
      2. & FORECAST, BY VOLTAGE, 2024–2030 (USD MILLION) 122\r\n \r\nTABLE
    104. ARGENTINA: CONTACTORS MARKET ESTIMATES & FORECAST, BY END-USE, 2024–2030
      1. (USD MILLION) 122\r\n \r\nTABLE 130 BRAZIL: CONTACTORS
    105. MARKET, BY TYPE, 2024–2030 (USD MILLION) 123\r\n \r\nTABLE
    106. BRAZIL: CONTACTORS MARKET ESTIMATES & FORECAST, BY PRODUCT, 2024–2030(USD
      1. MILLION) 123\r\n \r\nTABLE 132 BRAZIL: CONTACTORS MARKET
      2. ESTIMATES & FORECAST, BY NUMBER OF POLES, 2024–2030 (USD MILLION) 124\r\n \r\nTABLE
    107. BRAZIL: CONTACTORS MARKET ESTIMATES & FORECAST, BY VOLTAGE, 2024–2030
      1. (USD MILLION) 124\r\n \r\nTABLE 134 BRAZIL: CONTACTORS
    108. MARKET ESTIMATES & FORECAST, BY END-USE, 2024–2030 (USD MILLION) 125\r\n \r\nTABLE
    109. REST OF SOUTH AMERICA: CONTACTORS MARKET, BY TYPE, 2024–2030 (USD MILLION)
      1. 125\r\n \r\nTABLE 136 REST OF SOUTH AMERICA: CONTACTORS
    110. MARKET ESTIMATES & FORECAST, BY PRODUCT, 2024–2030(USD MILLION) 126\r\n \r\nTABLE
    111. REST OF SOUTH AMERICA: CONTACTORS MARKET ESTIMATES & FORECAST, BY NUMBER
      1. OF POLES, 2024–2030\r\n \r\n(USD MILLION) 126\r\n \r\nTABLE
    112. REST OF SOUTH AMERICA: CONTACTORS MARKET ESTIMATES & FORECAST, BY VOLTAGE,
    113. OF SOUTH AMERICA: CONTACTORS MARKET ESTIMATES & FORECAST, BY END-USE, 2024–2030
      1. (USD MILLION) 127\r\n \r\nTABLE 140 TE CONNECTIVITY:
      2. THE MOST ACTIVE PLAYER IN THE GLOBAL Contactor MARKET 132\r\n \r\nTABLE
    114. SIEMENS: PRODUCTS OFFERED 135\r\n \r\nTABLE 142 SIEMENS:
      1. KEY DEVELOPMENTS 135\r\n \r\nTABLE 143 EATON: PRODUCTS
      2. OFFERED 138\r\n \r\nTABLE 144 EATON: KEY DEVELOPMENTS
      3. 138\r\n \r\nTABLE 145 ABB: PRODUCTS OFFERED 141\r\n \r\nTABLE
    115. ABB: KEY DEVELOPMENTS 143\r\n \r\nTABLE 147 SCHNEIDER
      1. ELECTRIC: PRODUCTS OFFERED 145\r\n \r\nTABLE 148 SCHNEIDER
      2. ELECTRIC: KEY DEVELOPMENTS 145\r\n \r\nTABLE 149 MITSUBISHI
      3. ELECTRIC CORPORATION: PRODUCTS OFFERED 149\r\n \r\nTABLE
    116. TE CONNECTIVITY: PRODUCTS OFFERED 151\r\n \r\nTABLE
    117. TE CONNECTIVITY: KEY DEVELOPMENTS 151\r\n \r\nTABLE
    118. TOSHIBA CORPORATION: PRODUCTS OFFERED 154\r\n \r\nTABLE
    119. LSIS CO. LTD.: PRODUCTS OFFERED 156\r\n \r\nTABLE
    120. LSIS CO. LTD: KEY DEVELOPMENTS 156\r\n \r\nTABLE
    121. CG POWER AND INDUSTRIAL SOLUTIONS LIMITED: PRODUCTS OFFERED 158\r\n \r\nTABLE
    122. CG POWER AND INDUSTRIAL SOLUTIONS LIMITED: KEY DEVELOPMENTS 159\r\n \r\nTABLE
    123. LARSEN & TOUBRO LIMITED: PRODUCTS OFFERED 162\r\n \r\nTABLE
    124. PHOENIX CONTACT: PRODUCTS OFFERED 163\r\n \r\nTABLE
    125. ROCKWELL AUTOMATION, INC.: PRODUCT OFFERED 166\r\n \r\nTABLE
    126. ROCKWELL AUTOMATION, INC.: KEY DEVELOPMENTS 167\r\n \r\nTABLE
    127. FUJI ELECTRIC FA COMPONENTS & SYSTEMS CO., LTD: PRODUCTS OFFERED 168\r\n \r\nTABLE
    128. FUJI ELECTRIC FA COMPONENTS & SYSTEMS CO., LTD: KEY DEVELOPMENTS 169\r\n \r\nTABLE
    129. CRYDOM INC: PRODUCTS OFFERED 170\r\n \r\nTABLE 164
      1. CRYDOM INC: KEY DEVELOPMENTS 171\r\n \r\nTABLE 165 PANASONIC
      2. CORPORATION OF NORTH AMERICA: PRODUCTS OFFERED 172\r\n \r\n16
      3. LIST OF FIGURES\r\n \r\nFIGURE 1 MARKET SYNOPSIS 17\r\n \r\nFIGURE
    130. MARKET ATTRACTIVENESS ANALYSIS: GLOBAL CONTACTORS MARKET 18\r\n \r\nFIGURE
    131. GLOBAL CONTACTORS MARKET ANALYSIS, BY TYPE 18\r\n \r\nFIGURE
    132. GLOBAL CONTACTORS MARKET ANALYSIS, BY PRODUCT 19\r\n \r\nFIGURE
    133. GLOBAL CONTACTORS MARKET ANALYSIS, BY NUMBER OF POLES 20\r\n \r\nFIGURE
    134. GLOBAL CONTACTORS MARKET ANALYSIS, BY VOLTAGE 21\r\n \r\nFIGURE
    135. GLOBAL CONTACTORS MARKET ANALYSIS, BY END-USERS 22\r\n \r\nFIGURE
    136. GLOBAL CONTACTORS MARKET ANALYSIS, BY REGION 23\r\n \r\nFIGURE
    137. GLOBAL CONTACTORS MARKET: MARKET STRUCTURE 25\r\n \r\nFIGURE
    138. KEY BUYING CRITERIA OF BOOM TRUCK CRANE 26\r\n \r\nFIGURE
    139. NORTH AMERICA MARKET SIZE & MARKET SHARE BY REGION (2022 VS 2030) 27\r\n \r\nFIGURE
    140. EUROPE MARKET SIZE & MARKET SHARE BY REGION (2022 VS 2030) 27\r\n \r\nFIGURE
    141. ASIA-PACIFIC MARKET SIZE & MARKET SHARE BY REGION (2022 VS 2030) 28\r\n \r\nFIGURE
    142. MIDDLE EAST & AFRICA MARKET SIZE & MARKET SHARE BY REGION (2022 VS 2030)
      1. 28\r\n \r\nFIGURE 15 SOUTH AMERICA MARKET SIZE &
      2. MARKET SHARE BY REGION (2022 VS 2030) 29\r\n \r\nFIGURE
    143. RESEARCH PROCESS OF MRFR 30\r\n \r\nFIGURE 17 TOP-DOWN
      1. AND BOTTOM-UP APPROACH 33\r\n \r\nFIGURE 18 PORTER'S
      2. FIVE FORCES ANALYSIS: GLOBAL CONTACTORS MARKET 40\r\n \r\nFIGURE
    144. SUPPLY CHAIN ANALYSIS: GLOBAL CONTACTORS MARKET 42\r\n \r\nFIGURE
    145. GLOBAL CONTACTORS MARKET, BY TYPE, 2020 (% SHARE) 44\r\n \r\nFIGURE
    146. GLOBAL CONTACTORS MARKET, BY TYPE, 2024–2030 (USD MILLION) 45\r\n \r\nFIGURE
    147. GLOBAL CONTACTORS MARKET, BY PRODUCT, 2020 (% SHARE) 47\r\n \r\nFIGURE
    148. GLOBAL CONTACTORS MARKET, BY PRODUCT, 2024–2030 (USD MILLION) 48\r\n \r\nFIGURE
    149. GLOBAL CONTACTORS MARKET, BY NUMBER OF POLES, 2020 (% SHARE) 51\r\n \r\nFIGURE
    150. GLOBAL CONTACTORS MARKET, BY NUMBER OF POLES, 2024–2030 (USD MILLION) 52\r\n \r\nFIGURE
    151. GLOBAL CONTACTORS MARKET, BY VOLTAGE, 2020 (% SHARE) 54\r\n \r\nFIGURE
    152. GLOBAL CONTACTORS MARKET, BY VOLTAGE, 2024–2030 (USD MILLION) 55\r\n \r\nFIGURE
    153. GLOBAL CONTACTORS MARKET, BY END-USE, 2020 (% SHARE) 57\r\n \r\nFIGURE
    154. GLOBAL CONTACTORS MARKET, BY END-USE, 2024–2030 (USD MILLION) 58\r\n \r\nFIGURE
    155. GLOBAL CONTACTORS MARKET, BY REGION, 2024–2030 (USD MILLION) 63\r\n \r\nFIGURE
    156. COMPETITOR DASHBOARD: GLOBAL Contactor MARKET 129\r\n \r\nFIGURE
    157. CONTRACTS & AGREEMENTS: THE MAJOR STRATEGY ADOPTED BY KEY PLAYERS IN GLOBAL
      1. Contactor MARKET 130\r\n \r\nFIGURE 33 BENCHMARKING OF
      2. MAJOR COMPETITORS 131\r\n \r\nFIGURE 34 MAJOR MANUFACTURER
      3. MARKET SHARE ANALYSIS, 2020 132\r\n \r\nFIGURE 35 SIEMENS:
      4. TOTAL REVENUE VS RESEARCH AND DEVELOPMENT AND GEOGRAPHIC REVENUE (2024–2022)
      5. 134\r\n \r\nFIGURE 36 SIEMENS: SWOT ANALYSIS 136\r\n \r\nFIGURE
    158. EATON: TOTAL REVENUE VS RESEARCH AND DEVELOPMENT AND GEOGRAPHIC REVENUE (2024–2022)
      1. 137\r\n \r\nFIGURE 38 EATON: SWOT ANALYSIS 139\r\n \r\nFIGURE
    159. ABB: TOTAL REVENUE VS RESEARCH AND DEVELOPMENT AND GEOGRAPHIC REVENUE (2024–2022)
      1. 141\r\n \r\nFIGURE 40 ABB: SWOT ANALYSIS 143\r\n \r\nFIGURE
    160. SCHNEIDER ELECTRIC: TOTAL REVENUE VS RESEARCH AND DEVELOPMENT AND GEOGRAPHIC
      1. REVENUE (2024–2022) 144\r\n \r\nFIGURE 42 SCHNEIDER
      2. ELECTRIC: SWOT ANALYSIS 145\r\n \r\nFIGURE 43 MITSUBISHI
      3. ELECTRIC CORPORATION: TOTAL REVENUE VS RESEARCH AND DEVELOPMENT AND GEOGRAPHIC REVENUE\r\n \r\n(2024–2022)
      4. 148\r\n \r\nFIGURE 44 TE CONNECTIVITY: TOTAL REVENUE
      5. VS RESEARCH AND DEVELOPMENT AND GEOGRAPHIC REVENUE (2024–2022) 150\r\n \r\nFIGURE
    161. TE CONNECTIVITY: SWOT ANALYSIS 152\r\n \r\nFIGURE
    162. TOSHIBA CORPORATION: TOTAL REVENUE VS RESEARCH AND DEVELOPMENT AND GEOGRAPHIC
      1. REVENUE (2024–2022) 153\r\n \r\nFIGURE 47 LSIS
      2. CO. LTD: TOTAL REVENUE VS RESEARCH AND DEVELOPMENT AND GEOGRAPHIC REVENUE (2024–2022)
      3. 155\r\n \r\nFIGURE 48 CG POWER AND INDUSTRIAL SOLUTIONS
      4. LIMITED: TOTAL REVENUE VS RESEARCH AND DEVELOPMENT AND GEOGRAPHIC\r\n \r\nREVENUE
      5. (2024–2022) 158\r\n \r\nFIGURE 49 LARSEN &
      6. TOUBRO LIMITED: TOTAL REVENUE VS RESEARCH AND DEVELOPMENT AND GEOGRAPHIC REVENUE
      7. (2024–2022) 161\r\n \r\nFIGURE 50 ROCKWELL AUTOMATION,
      8. INC.: TOTAL REVENUE VS RESEARCH AND DEVELOPMENT AND GEOGRAPHIC REVENUE (2024–2022)
      9. 165

    Contactor Market Segmentation

    Contactors Type Outlook (USD Billion, 2018-2030)

    • Solid State Contractors
    • Magnetic Contractors
    • Vacuum Contractors
    • Lighting Contractors

    Contactors Product Outlook (USD Billion, 2018-2030)

    • DC Contractors
    • AC Contractors

    Contactors Number of Poles Outlook (USD Billion, 2018-2030)

    • 2 Poles
    • 3 Poles
    • 4 Poles
    • Others

    Contactors Voltage Outlook (USD Billion, 2018-2030)

    • Low Voltage
    • Medium Voltage
    • High Voltage

    Contactors Regional Outlook (USD Billion, 2018-2030)

    • North America Outlook (USD Billion, 2018-2030)

      • Contactors Type Outlook (USD Billion, 2018-2030)

        • Solid State Contractors
        • Magnetic Contractors
        • Vacuum Contractors
        • Lighting Contractors
      • Contactors Product Outlook (USD Billion, 2018-2030)

        • DC Contractors
        • AC Contractors
      • Contactors Number of Poles Outlook (USD Billion, 2018-2030)

        • 2 Poles
        • 3 Poles
        • 4 Poles
        • Others
      • Contactors Voltage Outlook (USD Billion, 2018-2030)

        • Low Voltage
        • Medium Voltage
        • High Voltage
      • US Outlook (USD Billion, 2018-2030)

      • Contactors Type Outlook (USD Billion, 2018-2030)

        • Solid State Contractors
        • Magnetic Contractors
        • Vacuum Contractors
        • Lighting Contractors
      • Contactors Product Outlook (USD Billion, 2018-2030)

        • DC Contractors
        • AC Contractors
      • Contactors Number of Poles Outlook (USD Billion, 2018-2030)

        • 2 Poles
        • 3 Poles
        • 4 Poles
        • Others
      • Contactors Voltage Outlook (USD Billion, 2018-2030)

        • Low Voltage
        • Medium Voltage
        • High Voltage
      • CANADA Outlook (USD Billion, 2018-2030)

      • Contactors Type Outlook (USD Billion, 2018-2030)

        • Solid State Contractors
        • Magnetic Contractors
        • Vacuum Contractors
        • Lighting Contractors
      • Contactors Product Outlook (USD Billion, 2018-2030)

        • DC Contractors
        • AC Contractors
      • Contactors Number of Poles Outlook (USD Billion, 2018-2030)

        • 2 Poles
        • 3 Poles
        • 4 Poles
        • Others
      • Contactors Voltage Outlook (USD Billion, 2018-2030)

        • Low Voltage
        • Medium Voltage
        • High Voltage
    • Europe Outlook (USD Billion, 2018-2030)

      • Contactors Type Outlook (USD Billion, 2018-2030)

        • Solid State Contractors
        • Magnetic Contractors
        • Vacuum Contractors
        • Lighting Contractors
      • Contactors Product Outlook (USD Billion, 2018-2030)

        • DC Contractors
        • AC Contractors
      • Contactors Number of Poles Outlook (USD Billion, 2018-2030)

        • 2 Poles
        • 3 Poles
        • 4 Poles
        • Others
      • Contactors Voltage Outlook (USD Billion, 2018-2030)

        • Low Voltage
        • Medium Voltage
        • High Voltage
      • Germany Outlook (USD Billion, 2018-2030)

      • Contactors Type Outlook (USD Billion, 2018-2030)

        • Solid State Contractors
        • Magnetic Contractors
        • Vacuum Contractors
        • Lighting Contractors
      • Contactors Product Outlook (USD Billion, 2018-2030)

        • DC Contractors
        • AC Contractors
      • Contactors Number of Poles Outlook (USD Billion, 2018-2030)

        • 2 Poles
        • 3 Poles
        • 4 Poles
        • Others
      • Contactors Voltage Outlook (USD Billion, 2018-2030)

        • Low Voltage
        • Medium Voltage
        • High Voltage
      • France Outlook (USD Billion, 2018-2030)

      • Contactors Type Outlook (USD Billion, 2018-2030)

        • Solid State Contractors
        • Magnetic Contractors
        • Vacuum Contractors
        • Lighting Contractors
      • Contactors Product Outlook (USD Billion, 2018-2030)

        • DC Contractors
        • AC Contractors
      • Contactors Number of Poles Outlook (USD Billion, 2018-2030)

        • 2 Poles
        • 3 Poles
        • 4 Poles
        • Others
      • Contactors Voltage Outlook (USD Billion, 2018-2030)

        • Low Voltage
        • Medium Voltage
        • High Voltage
      • UK Outlook (USD Billion, 2018-2030)

      • Contactors Type Outlook (USD Billion, 2018-2030)

        • Solid State Contractors
        • Magnetic Contractors
        • Vacuum Contractors
        • Lighting Contractors
      • Contactors Product Outlook (USD Billion, 2018-2030)

        • DC Contractors
        • AC Contractors
      • Contactors Number of Poles Outlook (USD Billion, 2018-2030)

        • 2 Poles
        • 3 Poles
        • 4 Poles
        • Others
      • Contactors Voltage Outlook (USD Billion, 2018-2030)

        • Low Voltage
        • Medium Voltage
        • High Voltage
      • ITALY Outlook (USD Billion, 2018-2030)

      • Contactors Type Outlook (USD Billion, 2018-2030)

        • Solid State Contractors
        • Magnetic Contractors
        • Vacuum Contractors
        • Lighting Contractors
      • Contactors Product Outlook (USD Billion, 2018-2030)

        • DC Contractors
        • AC Contractors
      • Contactors Number of Poles Outlook (USD Billion, 2018-2030)

        • 2 Poles
        • 3 Poles
        • 4 Poles
        • Others
      • Contactors Voltage Outlook (USD Billion, 2018-2030)

        • Low Voltage
        • Medium Voltage
        • High Voltage
      • SPAIN Outlook (USD Billion, 2018-2030)

      • Contactors Type Outlook (USD Billion, 2018-2030)

        • Solid State Contractors
        • Magnetic Contractors
        • Vacuum Contractors
        • Lighting Contractors
      • Contactors Product Outlook (USD Billion, 2018-2030)

        • DC Contractors
        • AC Contractors
      • Contactors Number of Poles Outlook (USD Billion, 2018-2030)

        • 2 Poles
        • 3 Poles
        • 4 Poles
        • Others
      • Contactors Voltage Outlook (USD Billion, 2018-2030)

        • Low Voltage
        • Medium Voltage
        • High Voltage
    • Asia-Pacific Outlook (USD Billion, 2018-2030)

      • Contactors Type Outlook (USD Billion, 2018-2030)

        • Solid State Contractors
        • Magnetic Contractors
        • Vacuum Contractors
        • Lighting Contractors
      • Contactors Product Outlook (USD Billion, 2018-2030)

        • DC Contractors
        • AC Contractors
      • Contactors Number of Poles Outlook (USD Billion, 2018-2030)

        • 2 Poles
        • 3 Poles
        • 4 Poles
        • Others
      • Contactors Voltage Outlook (USD Billion, 2018-2030)

        • Low Voltage
        • Medium Voltage
        • High Voltage
      • China Outlook (USD Billion, 2018-2030)

      • Contactors Type Outlook (USD Billion, 2018-2030)

        • Solid State Contractors
        • Magnetic Contractors
        • Vacuum Contractors
        • Lighting Contractors
      • Contactors Product Outlook (USD Billion, 2018-2030)

        • DC Contractors
        • AC Contractors
      • Contactors Number of Poles Outlook (USD Billion, 2018-2030)

        • 2 Poles
        • 3 Poles
        • 4 Poles
        • Others
      • Contactors Voltage Outlook (USD Billion, 2018-2030)

        • Low Voltage
        • Medium Voltage
        • High Voltage
      • Japan Outlook (USD Billion, 2018-2030)

      • Contactors Type Outlook (USD Billion, 2018-2030)

        • Solid State Contractors
        • Magnetic Contractors
        • Vacuum Contractors
        • Lighting Contractors
      • Contactors Product Outlook (USD Billion, 2018-2030)

        • DC Contractors
        • AC Contractors
      • Contactors Number of Poles Outlook (USD Billion, 2018-2030)

        • 2 Poles
        • 3 Poles
        • 4 Poles
        • Others
      • Contactors Voltage Outlook (USD Billion, 2018-2030)

        • Low Voltage
        • Medium Voltage
        • High Voltage
      • India Outlook (USD Billion, 2018-2030)

      • Contactors Type Outlook (USD Billion, 2018-2030)

        • Solid State Contractors
        • Magnetic Contractors
        • Vacuum Contractors
        • Lighting Contractors
      • Contactors Product Outlook (USD Billion, 2018-2030)

        • DC Contractors
        • AC Contractors
      • Contactors Number of Poles Outlook (USD Billion, 2018-2030)

        • 2 Poles
        • 3 Poles
        • 4 Poles
        • Others
      • Contactors Voltage Outlook (USD Billion, 2018-2030)

        • Low Voltage
        • Medium Voltage
        • High Voltage
      • Australia Outlook (USD Billion, 2018-2030)

      • Contactors Type Outlook (USD Billion, 2018-2030)

        • Solid State Contractors
        • Magnetic Contractors
        • Vacuum Contractors
        • Lighting Contractors
      • Contactors Product Outlook (USD Billion, 2018-2030)

        • DC Contractors
        • AC Contractors
      • Contactors Number of Poles Outlook (USD Billion, 2018-2030)

        • 2 Poles
        • 3 Poles
        • 4 Poles
        • Others
      • Contactors Voltage Outlook (USD Billion, 2018-2030)

        • Low Voltage
        • Medium Voltage
        • High Voltage
      • Rest of Asia-Pacific Outlook (USD Billion, 2018-2030)

      • Contactors Type Outlook (USD Billion, 2018-2030)

        • Solid State Contractors
        • Magnetic Contractors
        • Vacuum Contractors
        • Lighting Contractors
      • Contactors Product Outlook (USD Billion, 2018-2030)

        • DC Contractors
        • AC Contractors
      • Contactors Number of Poles Outlook (USD Billion, 2018-2030)

        • 2 Poles
        • 3 Poles
        • 4 Poles
        • Others
      • Contactors Voltage Outlook (USD Billion, 2018-2030)

        • Low Voltage
        • Medium Voltage
        • High Voltage
    • Rest of the World Outlook (USD Billion, 2018-2030)

      • Contactors Type Outlook (USD Billion, 2018-2030)

        • Solid State Contractors
        • Magnetic Contractors
        • Vacuum Contractors
        • Lighting Contractors
      • Contactors Product Outlook (USD Billion, 2018-2030)

        • DC Contractors
        • AC Contractors
      • Contactors Number of Poles Outlook (USD Billion, 2018-2030)

        • 2 Poles
        • 3 Poles
        • 4 Poles
        • Others
      • Contactors Voltage Outlook (USD Billion, 2018-2030)

        • Low Voltage
        • Medium Voltage
        • High Voltage
        •  
      • Middle East Outlook (USD Billion, 2018-2030)

      • Contactors Type Outlook (USD Billion, 2018-2030)

        • Solid State Contractors
        • Magnetic Contractors
        • Vacuum Contractors
        • Lighting Contractors
      • Contactors Product Outlook (USD Billion, 2018-2030)

        • DC Contractors
        • AC Contractors
      • Contactors Number of Poles Outlook (USD Billion, 2018-2030)

        • 2 Poles
        • 3 Poles
        • 4 Poles
        • Others
      • Contactors Voltage Outlook (USD Billion, 2018-2030)

        • Low Voltage
        • Medium Voltage
        • High Voltage
      • Africa Outlook (USD Billion, 2018-2030)

      • Contactors Type Outlook (USD Billion, 2018-2030)

        • Solid State Contractors
        • Magnetic Contractors
        • Vacuum Contractors
        • Lighting Contractors
      • Contactors Product Outlook (USD Billion, 2018-2030)

        • DC Contractors
        • AC Contractors
      • Contactors Number of Poles Outlook (USD Billion, 2018-2030)

        • 2 Poles
        • 3 Poles
        • 4 Poles
        • Others
      • Contactors Voltage Outlook (USD Billion, 2018-2030)

        • Low Voltage
        • Medium Voltage
        • High Voltage
      • Latin America Outlook (USD Billion, 2018-2030)

      • Contactors Type Outlook (USD Billion, 2018-2030)

        • Solid State Contractors
        • Magnetic Contractors
        • Vacuum Contractors
        • Lighting Contractors
      • Contactors Product Outlook (USD Billion, 2018-2030)

        • DC Contractors
        • AC Contractors
      • Contactors Number of Poles Outlook (USD Billion, 2018-2030)

        • 2 Poles
        • 3 Poles
        • 4 Poles
        • Others
      • Contactors Voltage Outlook (USD Billion, 2018-2030)

        • Low Voltage
        • Medium Voltage
        • High Voltage
    Infographic

    Free Sample Request

    Kindly complete the form below to receive a free sample of this Report

    Get Free Sample

    Customer Strories

    “I am very pleased with how market segments have been defined in a relevant way for my purposes (such as "Portable Freezers & refrigerators" and "last-mile"). In general the report is well structured. Thanks very much for your efforts.”

    Victoria Milne

    Founder
    Case Study
    Chemicals and Materials