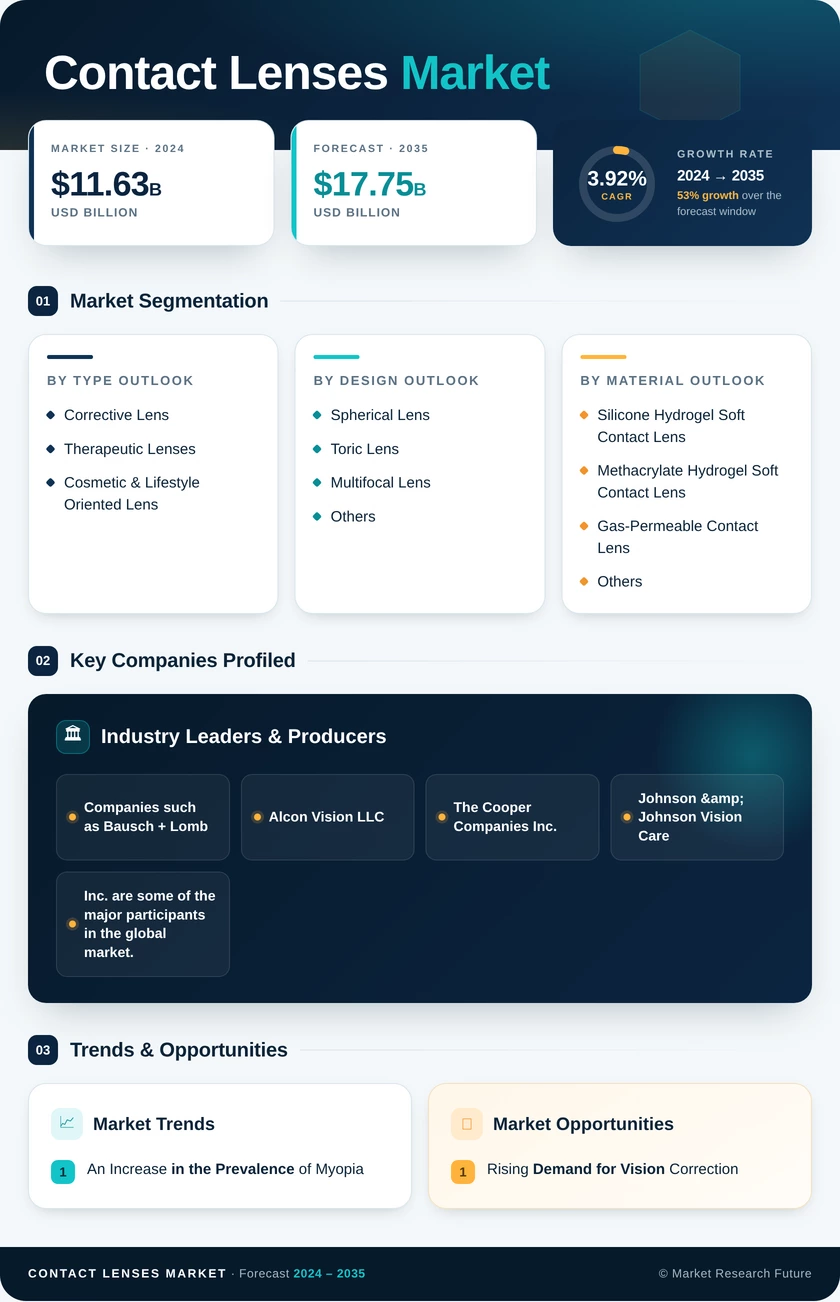
Contact Lenses Market (2026 - 2035)

ID: MRFR/MED/63826-CR 129 Pages Rahul Gotadki Last Updated: September 15, 2026
Contact Lenses Market Research Report Information By Type (Corrective Lens, Therapeutic Lenses, and Cosmetic & Lifestyle Oriented Lens), By Wear Type (Daily Disposable Lenses, Disposable Lenses (Two Weeks or Sooner), Frequent Replacement Lenses (Monthly or Quarterly), and Conventional Lenses), By Material (Methacrylate Hydrogel Soft Contact Lens, Silicone Hydrogel Soft Contact Lens, Gas-Permeable Contact Lens, and Others), By Design (Spherical Lens, Toric Lens, Multifocal Lens, and Others) And By Region (North America, Europe, Asia-Pacific, And Rest Of The World) – Lenses Industry Forecast Till 2035
Contact Lenses Market
Market Size
Forecast Period2026-2035
CAGR (2026-2035)3.9%
2025 Market SizeUSD 11.31 Billion
2035 Market SizeUSD 16.58 Billion
Key Players
Johnson & Johnson Vision Care
Alcon
CooperVision
Bausch + Lomb
Hoya Corporation
Menicon Co., Ltd.
Opportunities
  • Myopia Management as a Reimbursed Category
  • Emerging-Market Penetration
  • Subscription and Data-Led Business Models
  1. 1 Market Summary |
    1. 1.1 Study Assumptions & Market Definition |
    2. 1.2 Scope of the Study |
    3. 1.3 Research Methodology
  2. 2 Key Report Takeaways |
    1. 2.1 By Material |
    2. 2.2 By Application |
    3. 2.3 By Geography
  3. 3 Market Size & Forecast (2021–2035) |
    1. 3.1 Historical Market Size (2021–2024) |
    2. 3.2 Base Year Estimate (2025) |
    3. 3.3 Forecast Market Size (2026–2035) |
    4. 3.4 Year-over-Year Growth Analysis
  4. 4 Driver Impact Analysis |
    1. 4.1 Myopia Prevalence as Structural Demand |
    2. 4.2 Replacement-Schedule Economics |
    3. 4.3 Presbyopia and the Ageing Wearer |
    4. 4.4 Channel Digitisation
  5. 5 Restraints Impact Analysis |
    1. 5.1 Wearer Dropout and Retention Loss |
    2. 5.2 Substitution From Refractive Surgery |
    3. 5.3 Regulatory Friction on Decorative Formats
  6. 6 Opportunities |
    1. 6.1 Myopia Management as a Reimbursed Category |
    2. 6.2 Emerging-Market Penetration |
    3. 6.3 Subscription and Data-Led Business Models |
    4. 6.4 Drug-Eluting and Therapeutic Platforms |
    5. 6.5 Specialty Scleral and Irregular-Cornea Fitting
  7. 7 Regional Market Share & Country-Level Analysis |
    1. 7.1 North America | |
      1. 7.1.1 US | |
      2. 7.1.2 Canada | |
      3. 7.1.3 Mexico |
    2. 7.2 Europe | |
      1. 7.2.1 Germany | |
      2. 7.2.2 UK | |
      3. 7.2.3 France | |
      4. 7.2.4 Italy | |
      5. 7.2.5 Spain | |
      6. 7.2.6 Nordic Countries | |
      7. 7.2.7 Russia | |
      8. 7.2.8 Rest of Europe |
    3. 7.3 Asia-Pacific | |
      1. 7.3.1 China | |
      2. 7.3.2 India | |
      3. 7.3.3 Japan | |
      4. 7.3.4 South Korea | |
      5. 7.3.5 ASEAN | |
      6. 7.3.6 Rest of Asia-Pacific |
    4. 7.4 South America | |
      1. 7.4.1 Brazil | |
      2. 7.4.2 Argentina | |
      3. 7.4.3 Rest of South America |
    5. 7.5 Middle East & Africa | |
      1. 7.5.1 Saudi Arabia | |
      2. 7.5.2 UAE | |
      3. 7.5.3 South Africa | |
      4. 7.5.4 Egypt | |
      5. 7.5.5 Rest of MEA
  8. 8 Future Outlook (2026–2035) |
    1. 8.1 Sensor-Embedded and Smart Lens Platforms |
    2. 8.2 Myopia Control as Standard of Care |
    3. 8.3 Platform Economics and Direct Relationships |
    4. 8.4 Sustainability and Materials Compliance
  9. 9 Market Segmentation Analysis |
    1. 9.1 By Material | |
      1. 9.1.1 Silicone Hydrogel | |
      2. 9.1.2 Hydrogel | |
      3. 9.1.3 Gas Permeable | |
      4. 9.1.4 Other Materials |
    2. 9.2 By Design | |
      1. 9.2.1 Spherical | |
      2. 9.2.2 Toric | |
      3. 9.2.3 Multifocal/Progressive | |
      4. 9.2.4 Other Designs |
    3. 9.3 By Usability | |
      1. 9.3.1 Daily Disposable | |
      2. 9.3.2 Weekly/Bi-Weekly | |
      3. 9.3.3 Monthly Disposable | |
      4. 9.3.4 Traditional (Reusable) |
    4. 9.4 By Application | |
      1. 9.4.1 Vision Correction | |
      2. 9.4.2 Therapeutic | |
      3. 9.4.3 Cosmetic | |
      4. 9.4.4 Other Applications |
    5. 9.5 By Distribution Channel | |
      1. 9.5.1 Retail Optical Stores | |
      2. 9.5.2 Online / E-commerce | |
      3. 9.5.3 Eye Care Practitioners/Clinics | |
      4. 9.5.4 Other Channels
  10. 10 Competitive Landscape |
    1. 10.1 Market Concentration Analysis (2026) |
    2. 10.2 Competitive Benchmarking Matrix |
    3. 10.3 Industry Value Chain Analysis |
    4. 10.4 Porter's Five Forces Analysis |
    5. 10.5 Company Profiles | |
      1. 10.5.1 Johnson & Johnson Vision Care | |
      2. 10.5.2 Alcon | |
      3. 10.5.3 CooperVision | |
      4. 10.5.4 Bausch + Lomb | |
      5. 10.5.5 Hoya Corporation | |
      6. 10.5.6 Menicon Co., Ltd. | |
      7. 10.5.7 SEED Co., Ltd. | |
      8. 10.5.8 St. Shine Optical | |
      9. 10.5.9 BenQ Materials | |
      10. 10.5.10 Contamac
  11. 11 Recent News & Developments
  12. 12 Report Scope & Methodology |
    1. 12.1 Study Period & Base Year |
    2. 12.2 Data Sources |
    3. 12.3 Abbreviations
  13. 13 Detailed Sources & Citations
  14. 14 Frequently Asked Questions
  15. 15 LIST OF TABLES |
  16. TABLE 1 Global Contact Lenses Market Size & Forecast, by Revenue (USD Billion), 2021–2035 |
  17. TABLE 2 Global Contact Lenses Market – Year-over-Year Growth Analysis, 2021–2035 |
  18. TABLE 3 Driver Impact Analysis – Estimated Contribution to CAGR, 2026–2035 |
  19. TABLE 4 Restraint Impact Analysis – Estimated Drag on CAGR, 2026–2035 |
  20. TABLE 5 Global Contact Lenses Market Size, by Region, 2021–2035 (USD Billion) |
  21. TABLE 6 North America Contact Lenses Market Size, by Country, 2021–2035 (USD Billion) |
  22. TABLE 7 Europe Contact Lenses Market Size, by Country, 2021–2035 (USD Billion) |
  23. TABLE 8 Asia-Pacific Contact Lenses Market Size, by Country, 2021–2035 (USD Billion) |
  24. TABLE 9 South America Contact Lenses Market Size, by Country, 2021–2035 (USD Billion) |
  25. TABLE 10 Middle East & Africa Contact Lenses Market Size, by Country, 2021–2035 (USD Billion) |
  26. TABLE 11 Global Contact Lenses Market Size, by Material, 2021–2035 (USD Billion) |
  27. TABLE 12 Global Contact Lenses Market Size, by Design, 2021–2035 (USD Billion) |
  28. TABLE 13 Global Contact Lenses Market Size, by Usability, 2021–2035 (USD Billion) |
  29. TABLE 14 Global Contact Lenses Market Size, by Application, 2021–2035 (USD Billion) |
  30. TABLE 15 Global Contact Lenses Market Size, by Distribution Channel, 2021–2035 (USD Billion) |
  31. TABLE 16 North America Contact Lenses Market Size, by Material and Usability, 2021–2035 (USD Billion) |
  32. TABLE 17 Europe Contact Lenses Market Size, by Material and Usability, 2021–2035 (USD Billion) |
  33. TABLE 18 Asia-Pacific Contact Lenses Market Size, by Material and Usability, 2021–2035 (USD Billion) |
  34. TABLE 19 South America Contact Lenses Market Size, by Application, 2021–2035 (USD Billion) |
  35. TABLE 20 Middle East & Africa Contact Lenses Market Size, by Application, 2021–2035 (USD Billion) |
  36. TABLE 21 Competitive Benchmarking Matrix – Global Contact Lenses Market, 2026 |
  37. TABLE 22 Company Profiles – Key Players, Global Contact Lenses Market |
  38. TABLE 23 Recent Developments & Strategic Announcements, 2023–2025 |
  39. TABLE 24 Report Scope & Methodology Summary |
  40. TABLE 25 Detailed Sources & Citations Index
  41. 16 LIST OF FIGURES |
  42. FIGURE 1 Global Contact Lenses Market – Market Dynamics Overview (Drivers, Restraints, Opportunities) |
  43. FIGURE 2 Industry Value Chain Analysis – Materials to Practitioner Dispensing |
  44. FIGURE 3 Porter's Five Forces Analysis – Global Contact Lenses Market |
  45. FIGURE 4 Global Market Size Trend Line, 2021–2035 (USD Billion) |
  46. FIGURE 5 Year-over-Year Growth Rate Curve, 2022–2035 (%) |
  47. FIGURE 6 Market Share by Material, 2025 vs 2035 (%) |
  48. FIGURE 7 Market Share by Design, 2025 vs 2035 (%) |
  49. FIGURE 8 Segment CAGR Comparison by Usability, 2026–2035 (%) |
  50. FIGURE 9 Market Share by Application, 2025 (%) |
  51. FIGURE 10 Market Share by Distribution Channel, 2025 vs 2035 (%) |
  52. FIGURE 11 Regional Revenue Share Distribution, 2025 (%) |
  53. FIGURE 12 Regional CAGR Comparison, 2026–2035 (%) |
  54. FIGURE 13 North America Country-Level Share Breakdown, 2025 (%) |
  55. FIGURE 14 Asia-Pacific Country-Level Growth Comparison, 2026–2035 (%) |
  56. FIGURE 15 Competitive Landscape – Estimated Revenue Share Bands, 2026 |
  57. FIGURE 16 Strategic Positioning Matrix – Scale vs Specialty Focus

Segmentation Quick Reference

DimensionSub-SegmentsDominant SegmentFastest Growing Segment
By MaterialSilicone Hydrogel; Hydrogel; Gas Permeable; Other MaterialsSilicone HydrogelSilicone Hydrogel
By DesignSpherical; Toric; Multifocal/Progressive; Other DesignsSphericalMultifocal/Progressive
By UsabilityDaily Disposable; Weekly/Bi-Weekly; Monthly Disposable; Traditional (Reusable)Monthly DisposableDaily Disposable
By ApplicationVision Correction; Therapeutic; Cosmetic; Other ApplicationsVision CorrectionCosmetic
By Distribution ChannelRetail Optical Stores; E-commerce; Eye Care Practitioners/Clinics; Other ChannelsRetail Optical StoresE-commerce
By GeographyNorth America; Europe; Asia-Pacific; South America; Middle East & AfricaNorth AmericaAsia-Pacific


Market Segmentation Overview

By Material

Sub-SegmentKey Trend
Silicone HydrogelHigh oxygen transmissibility becoming the default clinical prescribing standard.
HydrogelRetained in value tiers and high-volume single-use production
Gas PermeableConcentrated in keratoconus, orthokeratology and post-surgical fitting
Other MaterialsHybrid constructions and novel polymers targeting comfort differentiation


Material choice now drives retention more than optics does. Producers that raise oxygen performance without sacrificing modulus win on wear time, and wear time is what keeps a wearer in the category for another year.

By Design

Sub-SegmentKey Trend
SphericalVolume base, exposed to online price competition
ToricExpanding stock parameter ranges converting astigmats from spectacles.
Multifocal/ProgressivePresbyopia demographics driving premium mix upgrade.
Other DesignsScleral and custom lathe-cut growth in specialty practice


Design is where premium pricing survives. Toric and multifocal both carry durable premiums because they require fitting expertise that pure e-commerce channels cannot replicate.

By Usability

Sub-SegmentKey Trend
Daily DisposableHighest revenue per wearer; primary target of capacity investment
Weekly/Bi-WeeklyStructural decline as prescribing habits shift
Monthly DisposableResilient in cost-sensitive European and Asian markets
Traditional (Reusable)Confined to specialty and gas permeable applications


Replacement frequency remains the single strongest determinant of category revenue. Every conversion from monthly to single-use multiplies annual spend per patient without adding a new wearer.

By Application

Sub-SegmentKey Trend
Vision CorrectionCore demand tied to global refractive error prevalence
TherapeuticDrug-eluting and bandage applications opening pharmaceutical pricing
CosmeticAesthetic demand concentrated in East Asia and Gulf markets.
Other ApplicationsDiagnostic and research-grade use cases


Therapeutic remains small but strategically outsized. It is the only application where pricing decouples from optical retail benchmarks entirely.

By Distribution Channel

Sub-SegmentKey Trend
Retail Optical StoresFitting expertise sustains share despite online pressure
E-commerceFastest channel growth; auto-replenishment building recurring revenue
Eye Care Practitioners/ClinicsPrescription origination point and specialty fitting hub
Other ChannelsPharmacy and mass merchandiser presence in select geographies


Channel economics are bifurcating. Practitioners keep the high-complexity fits and the prescribing relationship, while online captures repeat replenishment on stable prescriptions.




Download PDF ×

We do not share your information with anyone. However, we may send you emails based on your report interest from time to time. You may contact us at any time to opt-out.