Connected Logistics Market (2026 - 2035)

ID: MRFR/ICT/3451-HCR
100 Pages
Apoorva Priyadarshi
Last Updated: August 13, 2026
Connected Logistics Market Size, Share and Trends Analysis Report By Software (Asset Management, Warehouse management system, Security), Platform (Application Management, Device Management, Connectivity Management), Transportation Mode (Roadways, Railways, Airways, Waterways) - Global Forecast till 2035.
Connected Logistics Market
Market Size
Forecast Period2026-2035
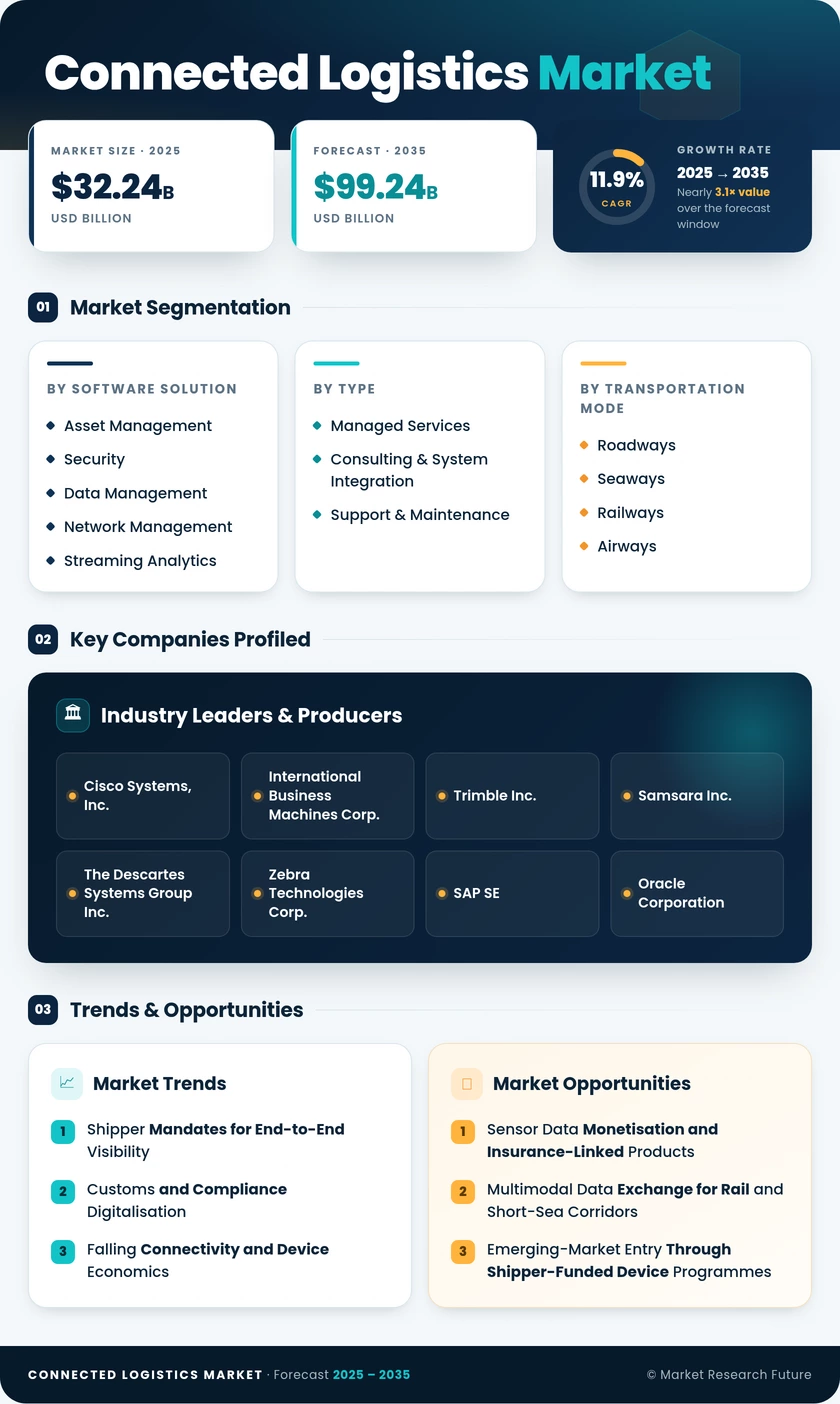
CAGR (2026-2035)11.9%
2025 Market SizeUSD 32.24 Billion
2035 Market SizeUSD 99.24 Billion
Key Players
Cisco Systems, Inc.
International Business Machines Corp.
Trimble Inc.
Samsara Inc.
The Descartes Systems Group Inc.
Zebra Technologies Corp.
Opportunities
  • Sensor Data Monetisation and Insurance-Linked Products
  • Multimodal Data Exchange for Rail and Short-Sea Corridors
  • Emerging-Market Entry Through Shipper-Funded Device Programmes
  1. 1 Market Overview |
    1. 1.1 Study Assumptions & Market Definition |
    2. 1.2 Scope of the Study |
    3. 1.3 Research Methodology
  2. 2 Market Summary & Key Report Takeaways |
    1. 2.1 Key Takeaways by Technology |
    2. 2.2 Key Takeaways by Sector |
    3. 2.3 Key Takeaways by Geography
  3. 3 Global Market Size & Forecast (2021–2035) |
    1. 3.1 Historical Market Size (2021–2024) |
    2. 3.2 Base Year Estimate (2025) |
    3. 3.3 Forecast Market Size (2026–2035) |
    4. 3.4 Year-over-Year Growth Analysis
  4. 4 Market Dynamics — Drivers |
    1. 4.1 Shipper Mandates for End-to-End Visibility |
    2. 4.2 Customs and Compliance Digitalisation |
    3. 4.3 Falling Connectivity and Device Economics |
    4. 4.4 Cold-Chain and Product Integrity Requirements |
    5. 4.5 Driver Impact Assessment Matrix
  5. 5 Market Dynamics — Restraints |
    1. 5.1 Interoperability Debt Across Carrier Networks |
    2. 5.2 Security and Data-Sovereignty Compliance Burden |
    3. 5.3 Capital Scarcity in the Long Tail of Carriers |
    4. 5.4 Restraint Impact Assessment Matrix
  6. 6 Market Opportunity Analysis |
    1. 6.1 Sensor Data Monetisation and Insurance-Linked Products |
    2. 6.2 Multimodal Data Exchange for Rail and Short-Sea Corridors |
    3. 6.3 Emerging-Market Entry Through Shipper-Funded Device Programmes |
    4. 6.4 Port and Terminal Private Networks as an Anchor Workload |
    5. 6.5 Emissions-Grade Freight Data as a Reporting Product |
    6. 6.6 Industry Value Chain Analysis |
    7. 6.7 Porter's Five Forces Analysis
  7. 7 Regional Analysis |
    1. 7.1 North America | |
      1. 7.1.1 United States | |
      2. 7.1.2 Canada | |
      3. 7.1.3 Mexico |
    2. 7.2 Europe | |
      1. 7.2.1 Germany | |
      2. 7.2.2 United Kingdom | |
      3. 7.2.3 France | |
      4. 7.2.4 Italy | |
      5. 7.2.5 Spain | |
      6. 7.2.6 Nordic Countries | |
      7. 7.2.7 Russia | |
      8. 7.2.8 Rest of Europe |
    3. 7.3 Asia-Pacific | |
      1. 7.3.1 China | |
      2. 7.3.2 India | |
      3. 7.3.3 Japan | |
      4. 7.3.4 South Korea | |
      5. 7.3.5 ASEAN | |
      6. 7.3.6 Rest of Asia-Pacific |
    4. 7.4 South America | |
      1. 7.4.1 Brazil | |
      2. 7.4.2 Argentina | |
      3. 7.4.3 Rest of South America |
    5. 7.5 Middle East & Africa | |
      1. 7.5.1 Saudi Arabia | |
      2. 7.5.2 United Arab Emirates | |
      3. 7.5.3 South Africa | |
      4. 7.5.4 Egypt | |
      5. 7.5.5 Rest of Middle East & Africa
  8. 8 Future Outlook (2026–2035) |
    1. 8.1 Autonomous and Semi-Autonomous Operations |
    2. 8.2 Platform Economics and Consolidation |
    3. 8.3 Fleet Electrification and Energy-Aware Routing |
    4. 8.4 Emissions Accounting as Core Functionality
  9. 9 Market Segmentation Analysis |
    1. 9.1 By Software Solution | |
      1. 9.1.1 Asset Management | |
      2. 9.1.2 Security | |
      3. 9.1.3 Data Management | |
      4. 9.1.4 Network Management | |
      5. 9.1.5 Streaming Analytics |
    2. 9.2 By Product Type | |
      1. 9.2.1 Device Management | |
      2. 9.2.2 Application Management | |
      3. 9.2.3 Connectivity Management |
    3. 9.3 By Transportation Mode | |
      1. 9.3.1 Roadways | |
      2. 9.3.2 Railways | |
      3. 9.3.3 Seaways | |
      4. 9.3.4 Airways |
    4. 9.4 By End-User Industry | |
      1. 9.4.1 Automotive | |
      2. 9.4.2 Manufacturing | |
      3. 9.4.3 Retail & E-commerce | |
      4. 9.4.4 Healthcare | |
      5. 9.4.5 Food & Beverage | |
      6. 9.4.6 Oil, Gas & Chemicals | |
      7. 9.4.7 Others |
    5. 9.5 By Service Type | |
      1. 9.5.1 Managed Services | |
      2. 9.5.2 Consulting & System Integration | |
      3. 9.5.3 Support & Maintenance |
    6. 9.6 By Deployment Mode | |
      1. 9.6.1 Cloud | |
      2. 9.6.2 On-Premise | |
      3. 9.6.3 Hybrid |
    7. 9.7 By Organization Size | |
      1. 9.7.1 Large Enterprises | |
      2. 9.7.2 Small & Medium Enterprises
  10. 10 Competitive Landscape |
    1. 10.1 Market Concentration Analysis |
    2. 10.2 Competitive Benchmarking Matrix |
    3. 10.3 Company Profiles | |
      1. 10.3.1 Cisco Systems, Inc. | |
      2. 10.3.2 International Business Machines Corporation | |
      3. 10.3.3 Trimble Inc. | |
      4. 10.3.4 Samsara Inc. | |
      5. 10.3.5 The Descartes Systems Group Inc. | |
      6. 10.3.6 Zebra Technologies Corporation | |
      7. 10.3.7 SAP SE | |
      8. 10.3.8 Oracle Corporation | |
      9. 10.3.9 ORBCOMM Inc. | |
      10. 10.3.10 project44, Inc. | |
      11. 10.3.11 Honeywell International Inc.
  11. 11 Recent News & Developments (2023–2025)
  12. 12 Report Scope & Methodology |
    1. 12.1 Study Period & Base Year |
    2. 12.2 Valuation Currency & Conversion Basis |
    3. 12.3 Data Sources & Citations |
    4. 12.4 Abbreviations
  13. 13 Detailed Sources and Citations
  14. 14 Frequently Asked Questions
  15. 15 LIST OF TABLES |
  16. TABLE 1 Global Connected Logistics Market Size & Forecast, by Revenue (USD billion), 2021–2035 |
  17. TABLE 2 Global Connected Logistics Market — Year-over-Year Growth Analysis, 2021–2035 |
  18. TABLE 3 Driver Impact Assessment Matrix, 2026–2035 |
  19. TABLE 4 Restraint Impact Assessment Matrix, 2026–2035 |
  20. TABLE 5 Global Connected Logistics Market Size, by Region, 2021–2035 (USD billion) |
  21. TABLE 6 North America Connected Logistics Market Size, by Country, 2021–2035 (USD billion) |
  22. TABLE 7 Europe Connected Logistics Market Size, by Country, 2021–2035 (USD billion) |
  23. TABLE 8 Asia-Pacific Connected Logistics Market Size, by Country, 2021–2035 (USD billion) |
  24. TABLE 9 South America Connected Logistics Market Size, by Country, 2021–2035 (USD billion) |
  25. TABLE 10 Middle East & Africa Connected Logistics Market Size, by Country, 2021–2035 (USD billion) |
  26. TABLE 11 Global Connected Logistics Market Size, by Software Solution, 2021–2035 (USD billion) |
  27. TABLE 12 Global Connected Logistics Market Size, by Product Type, 2021–2035 (USD billion) |
  28. TABLE 13 Global Connected Logistics Market Size, by Transportation Mode, 2021–2035 (USD billion) |
  29. TABLE 14 Global Connected Logistics Market Size, by End-User Industry, 2021–2035 (USD billion) |
  30. TABLE 15 Global Connected Logistics Market Size, by Service Type, 2021–2035 (USD billion) |
  31. TABLE 16 Global Connected Logistics Market Size, by Deployment Mode, 2021–2035 (USD billion) |
  32. TABLE 17 Global Connected Logistics Market Size, by Organization Size, 2021–2035 (USD billion) |
  33. TABLE 18 North America Connected Logistics Market Size, by Software Solution, 2021–2035 (USD billion) |
  34. TABLE 19 North America Connected Logistics Market Size, by Transportation Mode, 2021–2035 (USD billion) |
  35. TABLE 20 North America Connected Logistics Market Size, by End-User Industry, 2021–2035 (USD billion) |
  36. TABLE 21 Europe Connected Logistics Market Size, by Software Solution, 2021–2035 (USD billion) |
  37. TABLE 22 Europe Connected Logistics Market Size, by Transportation Mode, 2021–2035 (USD billion) |
  38. TABLE 23 Europe Connected Logistics Market Size, by End-User Industry, 2021–2035 (USD billion) |
  39. TABLE 24 Asia-Pacific Connected Logistics Market Size, by Software Solution, 2021–2035 (USD billion) |
  40. TABLE 25 Asia-Pacific Connected Logistics Market Size, by Transportation Mode, 2021–2035 (USD billion) |
  41. TABLE 26 Asia-Pacific Connected Logistics Market Size, by End-User Industry, 2021–2035 (USD billion) |
  42. TABLE 27 South America Connected Logistics Market Size, by Software Solution, 2021–2035 (USD billion) |
  43. TABLE 28 South America Connected Logistics Market Size, by End-User Industry, 2021–2035 (USD billion) |
  44. TABLE 29 Middle East & Africa Connected Logistics Market Size, by Software Solution, 2021–2035 (USD billion) |
  45. TABLE 30 Middle East & Africa Connected Logistics Market Size, by End-User Industry, 2021–2035 (USD billion) |
  46. TABLE 31 United States Connected Logistics Market Size, by Segment, 2021–2035 (USD billion) |
  47. TABLE 32 Germany Connected Logistics Market Size, by Segment, 2021–2035 (USD billion) |
  48. TABLE 33 China Connected Logistics Market Size, by Segment, 2021–2035 (USD billion) |
  49. TABLE 34 India Connected Logistics Market Size, by Segment, 2021–2035 (USD billion) |
  50. TABLE 35 Brazil Connected Logistics Market Size, by Segment, 2021–2035 (USD billion) |
  51. TABLE 36 Saudi Arabia Connected Logistics Market Size, by Segment, 2021–2035 (USD billion) |
  52. TABLE 37 Competitive Benchmarking Matrix — Global Connected Logistics Market, 2026 |
  53. TABLE 38 Company Profiles — Key Players, Global Connected Logistics Market |
  54. TABLE 39 Recent Developments & Strategic Announcements, 2023–2025 |
  55. TABLE 40 Report Scope & Methodology Summary |
  56. TABLE 41 Detailed Sources and Citations Register
  57. 16 LIST OF FIGURES |
  58. FIGURE 1 Global Connected Logistics Market — Market Dynamics Snapshot (Drivers, Restraints, Opportunities) |
  59. FIGURE 2 Industry Value Chain Analysis — Device, Connectivity, Platform, Services |
  60. FIGURE 3 Porter's Five Forces Analysis — Global Connected Logistics Market |
  61. FIGURE 4 Global Market Size Trend & Forecast, 2021–2035 (USD billion) |
  62. FIGURE 5 Year-over-Year Growth Trajectory, 2022–2035 (%) |
  63. FIGURE 6 Market Share by Software Solution, 2025 vs 2035 (%) |
  64. FIGURE 7 Market Share by Product Type, 2025 (%) |
  65. FIGURE 8 Market Share by Transportation Mode, 2025 (%) |
  66. FIGURE 9 Market Share by End-User Industry, 2025 (%) |
  67. FIGURE 10 Market Share by Service Type, 2025 (%) |
  68. FIGURE 11 Market Share by Deployment Mode, 2025 vs 2035 (%) |
  69. FIGURE 12 Market Share by Organization Size, 2025 (%) |
  70. FIGURE 13 Regional Market Share Distribution, 2025 (%) |
  71. FIGURE 14 Regional Growth Rate Comparison, CAGR 2026–2035 (%) |
  72. FIGURE 15 North America Country-Level Share Distribution, 2025 (%) |
  73. FIGURE 16 Europe Country-Level Share Distribution, 2025 (%) |
  74. FIGURE 17 Asia-Pacific Country-Level Growth Comparison, 2026–2035 (%) |
  75. FIGURE 18 Competitive Landscape — Vendor Positioning Matrix, 2026 |
  76. FIGURE 19 Top-5 Vendor Revenue Share Concentration, 2025 (%) |
  77. FIGURE 20 Strategic Development Timeline, 2023–2025

Segmentation Quick Reference

DimensionSub-SegmentsDominant SegmentFastest Growing Segment
By Software SolutionAsset Management; Security; Data Management; Network Management; Streaming AnalyticsAsset ManagementStreaming Analytics
By Product TypeDevice Management; Application Management; Connectivity ManagementDevice ManagementConnectivity Management
By Transportation ModeRoadways; Railways; Seaways; AirwaysRoadwaysSeaways
By End-User IndustryAutomotive; Manufacturing; Retail & E-commerce; Healthcare; Food & Beverage; Oil, Gas & Chemicals; OthersManufacturingHealthcare
By Service TypeManaged Services; Consulting & System Integration; Support & MaintenanceManaged ServicesConsulting & System Integration
By Deployment ModeCloud; On-Premise; HybridCloudHybrid
By Organization SizeLarge Enterprises; Small & Medium EnterprisesLarge EnterprisesSmall & Medium Enterprises
By GeographyNorth America; Europe; Asia-Pacific; South America; Middle East & AfricaNorth AmericaAsia-Pacific


Market Segmentation Overview

By Software Solution

Sub-SegmentKey Trend
Asset ManagementInstrumentation moving from tractor to trailer, container, and reusable packaging.
SecurityGeofence-triggered tamper alerts replacing periodic manual seal checks
Data ManagementCarrier event normalisation becoming a standalone contracted service.
Network ManagementMulti-generation device estates driving centralised provisioning tools
Streaming AnalyticsReal-time exception scoring displacing overnight batch reporting


Software solution mix is shifting from record-keeping toward decision support. Buyers who deployed asset tracking between 2019 and 2023 are now layering analytics on top of existing telemetry rather than replacing platforms, which favours vendors selling modular upgrades over full-suite rip-and-replace.

By Product Type

Sub-SegmentKey Trend
Device ManagementFirmware lifecycle governance across mixed-vendor hardware fleets
Application ManagementLow-code workflow configuration replacing custom integration builds
Connectivity ManagementMulti-operator SIM orchestration to control cross-border roaming cost


Product type spend tracks the operational reality that fleets never standardise on one hardware generation. Connectivity Management grows fastest because roaming economics on international lanes are punishing under single-operator agreements.

By Transportation Mode

Sub-SegmentKey Trend
RoadwaysCompliance mandates creating a hardware adoption floor
RailwaysWagon-level telemetry closing the intermodal visibility gap.
SeawaysContainer instrumentation tied to emissions and dwell reporting
AirwaysHigh-value cargo condition monitoring at unit-load-device level


Modal adoption is converging as shippers demand door-to-door continuity. Seaways lead growth because ocean carriers absorbed new emissions accounting duties that only instrumented voyages can satisfy.

By End-User Industry

Sub-SegmentKey Trend
AutomotiveJust-in-sequence supplier flows requiring minute-level inbound accuracy
ManufacturingLine-stoppage risk modelling driving inbound telemetry investment
Retail & E-commercePromise-date accuracy and reverse logistics visibility
HealthcareExcursion prevention for biologics and serialised pharmaceutical flows
Food & BeverageTraceability readiness for recall and shelf-life optimisation
Oil, Gas & ChemicalsHazmat routing controls and regulatory chain-of-custody records
OthersConstruction, defence, and public sector fleet digitalisation


Vertical adoption correlates tightly with the cost of a single failure. Manufacturing and healthcare lead because a stopped line or a spoiled biologic shipment carries losses no software subscription approaches.

By Service Type

Sub-SegmentKey Trend
Managed ServicesOutsourced IoT operations filling a persistent internal skills gap
Consulting & System IntegrationLegacy execution-system integration remains the largest project cost line.
Support & MaintenanceDevice replacement cycles sustaining recurring service revenue.


Services capture a growing share of total programme spend as deployments extend beyond pilots into multi-region rollouts. Integration work, not licensing, is what determines project timelines.

By Deployment Mode

Sub-SegmentKey Trend
CloudElastic event processing supporting rapid multi-site expansion
On-PremiseData-residency requirements and terminal system co-location
HybridEdge processing at ports paired with centralised analytics


Cloud remains the default, but hybrid architectures grow fastest as latency-sensitive terminal workloads and data-sovereignty rules push processing back toward the edge.

By Organization Size

Sub-SegmentKey Trend
Large EnterprisesControl-tower consolidation across previously siloed regional systems
Small & Medium EnterprisesShipper-imposed visibility clauses forcing adoption at contract renewal


Enterprise buyers dominate revenue, but the growth story sits with smaller carriers pulled in by contractual requirement rather than internal business case.




Download PDF ×

We do not share your information with anyone. However, we may send you emails based on your report interest from time to time. You may contact us at any time to opt-out.