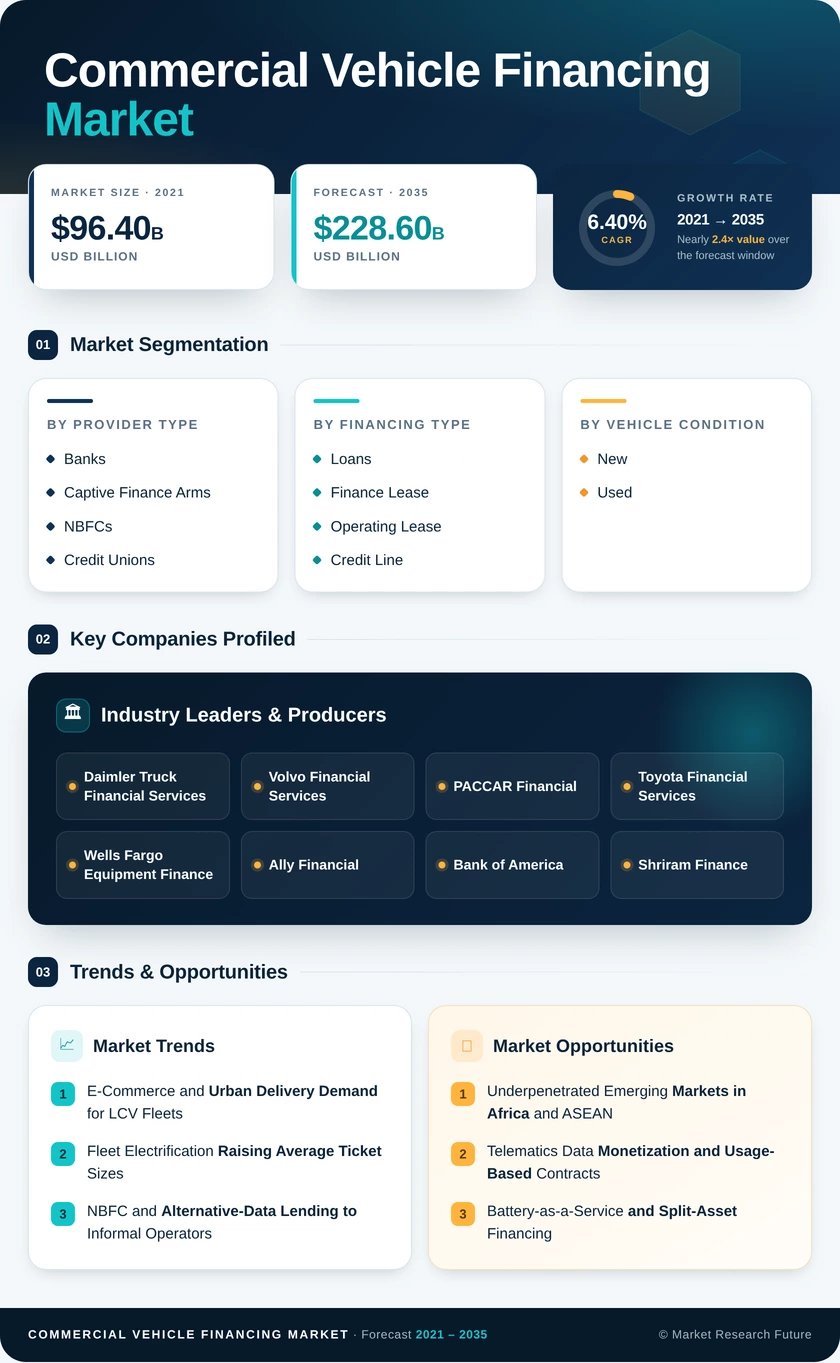
Segmentation Quick Reference
| Dimension | Sub-Segments | Dominant Segment | Fastest Growing Segment |
|---|---|---|---|
| By Provider Type | Banks; Captive Finance Arms; NBFCs; Credit Unions | Banks (44.4% share) | NBFCs (6.42% CAGR) |
| By Financing Type | Loans; Finance Lease; Operating Lease; Credit Line | Loans (60.7% share) | Operating Lease (6.50% CAGR) |
| By Vehicle Condition | New; Used | New (54.3% share) | Used (6.52% CAGR) |
| By Vehicle Type | LCV; Medium/Heavy Trucks; Buses; Special-Purpose | LCV (42.9% share) | LCV (42.9% share) |
| By Channel | Direct; Online Aggregators; Broker-Assisted | Direct (69.0% share) | Online Aggregators (6.55% CAGR) |
| By Region | North America; Europe; Asia-Pacific; South America; Middle East & Africa | Asia-Pacific (36.4% share) | Middle East & Africa (6.47% CAGR) |
Market Segmentation Overview
By Provider Type
| Sub-Segment | Key Trend |
|---|---|
| Banks | Capital charges under CRR3 and Basel III reforms slowing balance-sheet growth |
| Captive Finance Arms | Telematics-linked pricing and bundled service contracts |
| NBFCs | Alternative-data scoring for informal owner-operators |
| Credit Unions | Relationship underwriting in North American local fleets |
Banks hold the largest share because they fund large fleets at low deposit-based costs, but rising risk weights are eroding their pricing edge. NBFCs grow fastest by lending to first-time owner-operators using fuel-card and mobile-wallet data, a borrower pool bank models reject. Captive Finance Arms defend new-vehicle deals through embedded telematics that bank lenders cannot replicate.
By Financing Type
| Sub-Segment | Key Trend |
|---|---|
| Loans | Ownership preference among owner-operators |
| Finance Lease | Mid-size fleets seeking eventual ownership |
| Operating Lease | Residual-risk transfer and mileage-based billing |
| Credit Line | Floating-rate exposure limits adoption. |
Loans lead because owner-operators prefer building equity in their trucks. Operating Lease grows fastest as electrification makes residual values harder to forecast, pushing fleets to shift that risk onto lessors with service depots and valuation models. Finance Lease occupies the middle ground, while Credit Line stays niche due to rate volatility.
By Vehicle Condition
| Sub-Segment | Key Trend |
|---|---|
| New | Emission-norm replacement and captive point-of-sale finance |
| Used | Certified pre-owned programs and AI depreciation models |
New vehicles lead on the back of captive programs and pre-buys ahead of stricter emission rules. Used grows faster as certified pre-owned offers and machine-learning residual forecasts cut lender losses and let financiers extend tenors on older trucks.
By Vehicle Type
| Sub-Segment | Key Trend |
|---|---|
| LCV | Parcel delivery, quick commerce and low-emission zones |
| Medium/Heavy Trucks | Large tickets, slower replacement under high rates |
| Buses | Public transit electrification tenders |
| Special-Purpose | Project-based finance for construction and mining |
LCV both leads and grows fastest because urban delivery fleets are expanding and city low-emission zones accelerate electric van adoption. Medium/Heavy Trucks carry the largest ticket sizes, but higher borrowing costs are stretching replacement cycles. Buses and Special-Purpose units depend on public procurement and bespoke project structures.
By Channel
| Sub-Segment | Key Trend |
|---|---|
| Direct | Dealer desks and captive portals |
| Online Aggregators | AI underwriting and freight-invoice data |
| Broker-Assisted | Complex multi-lender fleet transactions |
Direct origination dominates because most truck and van purchases close at the dealer, where captives and bank partners sit. Online Aggregators grow fastest by matching small fleets with lenders in minutes using invoice and telematics data. Broker-Assisted deals retain a role in large, structured transactions but lose simple loans to digital platforms.


 Noah Malgeri
Co-Founder

 Peter Groot koerkamp
Account and Business Manager

 Younghwan Choi
Senior Retail Manager

 Mark Irwin
Management Consultant

 Akif Moroglu
Strategy & Business Development Director

 Guilherme Gomes Martins
Product Management Director

 Joseph Aguayo
Sales Operations & Pricing Manager

 La Terria Dodd
Program Support Specialist

 Rob Kooiker
Group Product Manager HVAC & Fire Protection GMA