Request Free Sample ×

Kindly complete the form below to receive a free sample of this Report

* Please use a valid business email

Leading companies partner with us for data-driven Insights

clients tt-cursor
Hero Background

Coin Sorter Market

ID: MRFR/BS/21557-HCR
200 Pages
Aarti Dhapte
Last Updated: April 06, 2026

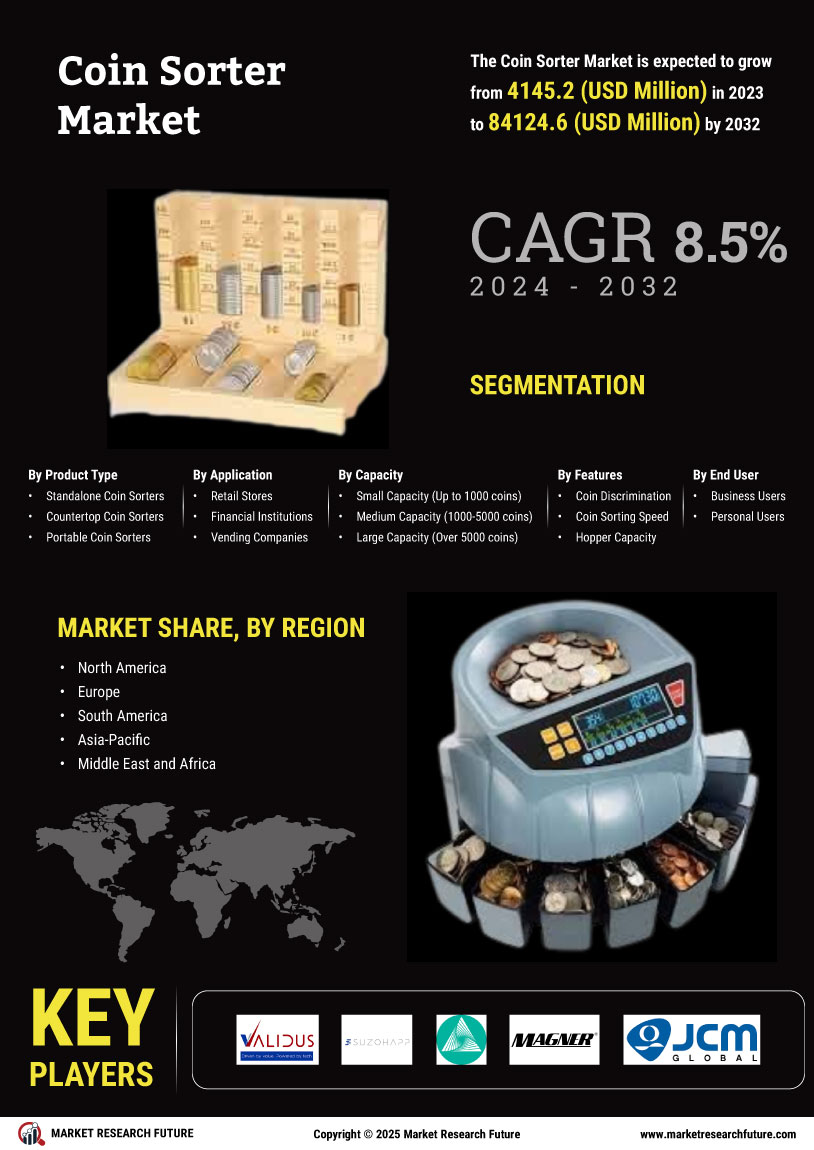
Coin Sorter Market Size, Share and Research Report By Product Type (Standalone Coin Sorters, Countertop Coin Sorters, Portable Coin Sorters), By Application (Retail Stores, Financial Institutions, Vending Companies, Casinos, Hotels), By Capacity (Small Capacity (Up to 1000 coins), Medium Capacity (1000-5000 coins), Large Capacity (Over 5000 coins)), By Features (Coin Discrimination, Coin Sorting Speed, Hopper Capacity, Jam Detection, Durability), By End User (Business Users, Personal Users) and By Regional (North America, Europe, South America, Asia-Pacific, Middle East and Africa) – Industry Forecast Till 2035

Share:
Download PDF ×

We do not share your information with anyone. However, we may send you emails based on your report interest from time to time. You may contact us at any time to opt-out.

Coin Sorter Market Infographic
Purchase Options
  1. 1 SECTION I: EXECUTIVE SUMMARY AND KEY HIGHLIGHTS
    1. 1.1 EXECUTIVE SUMMARY
      1. 1.1.1 Market Overview
      2. 1.1.2 Key Findings
      3. 1.1.3 Market Segmentation
      4. 1.1.4 Competitive Landscape
      5. 1.1.5 Challenges and Opportunities
      6. 1.1.6 Future Outlook
  2. 2 SECTION II: SCOPING, METHODOLOGY AND MARKET STRUCTURE
    1. 2.1 MARKET INTRODUCTION
      1. 2.1.1 Definition
      2. 2.1.2 Scope of the study
        1. 2.1.2.1 Research Objective
        2. 2.1.2.2 Assumption
        3. 2.1.2.3 Limitations
    2. 2.2 RESEARCH METHODOLOGY
      1. 2.2.1 Overview
      2. 2.2.2 Data Mining
      3. 2.2.3 Secondary Research
      4. 2.2.4 Primary Research
        1. 2.2.4.1 Primary Interviews and Information Gathering Process
        2. 2.2.4.2 Breakdown of Primary Respondents
      5. 2.2.5 Forecasting Model
      6. 2.2.6 Market Size Estimation
        1. 2.2.6.1 Bottom-Up Approach
        2. 2.2.6.2 Top-Down Approach
      7. 2.2.7 Data Triangulation
      8. 2.2.8 Validation
  3. 3 SECTION III: QUALITATIVE ANALYSIS
    1. 3.1 MARKET DYNAMICS
      1. 3.1.1 Overview
      2. 3.1.2 Drivers
      3. 3.1.3 Restraints
      4. 3.1.4 Opportunities
    2. 3.2 MARKET FACTOR ANALYSIS
      1. 3.2.1 Value chain Analysis
      2. 3.2.2 Porter's Five Forces Analysis
        1. 3.2.2.1 Bargaining Power of Suppliers
        2. 3.2.2.2 Bargaining Power of Buyers
        3. 3.2.2.3 Threat of New Entrants
        4. 3.2.2.4 Threat of Substitutes
        5. 3.2.2.5 Intensity of Rivalry
      3. 3.2.3 COVID-19 Impact Analysis
        1. 3.2.3.1 Market Impact Analysis
        2. 3.2.3.2 Regional Impact
        3. 3.2.3.3 Opportunity and Threat Analysis
  4. 4 SECTION IV: QUANTITATIVE ANALYSIS
    1. 4.1 Coin Sorter Market, BY Application (USD Million)
      1. 4.1.1 Retail
      2. 4.1.2 Banking
      3. 4.1.3 Gaming
      4. 4.1.4 Vending
      5. 4.1.5 Home
    2. 4.2 Coin Sorter Market, BY End Use (USD Million)
      1. 4.2.1 Commercial
      2. 4.2.2 Residential
      3. 4.2.3 Industrial
      4. 4.2.4 Financial Institutions
    3. 4.3 Coin Sorter Market, BY Type (USD Million)
      1. 4.3.1 Manual Coin Sorter
      2. 4.3.2 Electric Coin Sorter
      3. 4.3.3 Digital Coin Sorter
      4. 4.3.4 Portable Coin Sorter
    4. 4.4 Coin Sorter Market, BY Sorting Capacity (USD Million)
      1. 4.4.1 Low Capacity
      2. 4.4.2 Medium Capacity
      3. 4.4.3 High Capacity
    5. 4.5 Coin Sorter Market, BY Technology (USD Million)
      1. 4.5.1 Optical Sorting
      2. 4.5.2 Mechanical Sorting
      3. 4.5.3 Electromagnetic Sorting
    6. 4.6 Coin Sorter Market, BY Region (USD Million)
      1. 4.6.1 North America
        1. 4.6.1.1 US
        2. 4.6.1.2 Canada
      2. 4.6.2 Europe
        1. 4.6.2.1 Germany
        2. 4.6.2.2 UK
        3. 4.6.2.3 France
        4. 4.6.2.4 Russia
        5. 4.6.2.5 Italy
        6. 4.6.2.6 Spain
        7. 4.6.2.7 Rest of Europe
      3. 4.6.3 APAC
        1. 4.6.3.1 China
        2. 4.6.3.2 India
        3. 4.6.3.3 Japan
        4. 4.6.3.4 South Korea
        5. 4.6.3.5 Malaysia
        6. 4.6.3.6 Thailand
        7. 4.6.3.7 Indonesia
        8. 4.6.3.8 Rest of APAC
      4. 4.6.4 South America
        1. 4.6.4.1 Brazil
        2. 4.6.4.2 Mexico
        3. 4.6.4.3 Argentina
        4. 4.6.4.4 Rest of South America
      5. 4.6.5 MEA
        1. 4.6.5.1 GCC Countries
        2. 4.6.5.2 South Africa
        3. 4.6.5.3 Rest of MEA
  5. 5 SECTION V: COMPETITIVE ANALYSIS
    1. 5.1 Competitive Landscape
      1. 5.1.1 Overview
      2. 5.1.2 Competitive Analysis
      3. 5.1.3 Market share Analysis
      4. 5.1.4 Major Growth Strategy in the BFSI
      5. 5.1.5 Competitive Benchmarking
      6. 5.1.6 Leading Players in Terms of Number of Developments in the BFSI
      7. 5.1.7 Key developments and growth strategies
        1. 5.1.7.1 New Product Launch/Service Deployment
        2. 5.1.7.2 Merger & Acquisitions
        3. 5.1.7.3 Joint Ventures
      8. 5.1.8 Major Players Financial Matrix
        1. 5.1.8.1 Sales and Operating Income
        2. 5.1.8.2 Major Players R&D Expenditure. 2023
    2. 5.2 Company Profiles
      1. 5.2.1 Coinstar (US)
        1. 5.2.1.1 Financial Overview
        2. 5.2.1.2 Products Offered
        3. 5.2.1.3 Key Developments
        4. 5.2.1.4 SWOT Analysis
        5. 5.2.1.5 Key Strategies
      2. 5.2.2 Royal Sovereign (US)
        1. 5.2.2.1 Financial Overview
        2. 5.2.2.2 Products Offered
        3. 5.2.2.3 Key Developments
        4. 5.2.2.4 SWOT Analysis
        5. 5.2.2.5 Key Strategies
      3. 5.2.3 AccuBANKER (US)
        1. 5.2.3.1 Financial Overview
        2. 5.2.3.2 Products Offered
        3. 5.2.3.3 Key Developments
        4. 5.2.3.4 SWOT Analysis
        5. 5.2.3.5 Key Strategies
      4. 5.2.4 Giesecke+Devrient (DE)
        1. 5.2.4.1 Financial Overview
        2. 5.2.4.2 Products Offered
        3. 5.2.4.3 Key Developments
        4. 5.2.4.4 SWOT Analysis
        5. 5.2.4.5 Key Strategies
      5. 5.2.5 NRI (JP)
        1. 5.2.5.1 Financial Overview
        2. 5.2.5.2 Products Offered
        3. 5.2.5.3 Key Developments
        4. 5.2.5.4 SWOT Analysis
        5. 5.2.5.5 Key Strategies
      6. 5.2.6 Magner (IE)
        1. 5.2.6.1 Financial Overview
        2. 5.2.6.2 Products Offered
        3. 5.2.6.3 Key Developments
        4. 5.2.6.4 SWOT Analysis
        5. 5.2.6.5 Key Strategies
      7. 5.2.7 Cassida (US)
        1. 5.2.7.1 Financial Overview
        2. 5.2.7.2 Products Offered
        3. 5.2.7.3 Key Developments
        4. 5.2.7.4 SWOT Analysis
        5. 5.2.7.5 Key Strategies
      8. 5.2.8 Kisan (IN)
        1. 5.2.8.1 Financial Overview
        2. 5.2.8.2 Products Offered
        3. 5.2.8.3 Key Developments
        4. 5.2.8.4 SWOT Analysis
        5. 5.2.8.5 Key Strategies
      9. 5.2.9 HSM (DE)
        1. 5.2.9.1 Financial Overview
        2. 5.2.9.2 Products Offered
        3. 5.2.9.3 Key Developments
        4. 5.2.9.4 SWOT Analysis
        5. 5.2.9.5 Key Strategies
    3. 5.3 Appendix
      1. 5.3.1 References
      2. 5.3.2 Related Reports

Coin Sorter Market Segmentation

Coin Sorter Market By Application (USD Million, 2025-2035)

  • Retail
  • Banking
  • Gaming
  • Vending
  • Home

Coin Sorter Market By End Use (USD Million, 2025-2035)

  • Commercial
  • Residential
  • Industrial
  • Financial Institutions

Coin Sorter Market By Type (USD Million, 2025-2035)

  • Manual Coin Sorter
  • Electric Coin Sorter
  • Digital Coin Sorter
  • Portable Coin Sorter

Coin Sorter Market By Sorting Capacity (USD Million, 2025-2035)

  • Low Capacity
  • Medium Capacity
  • High Capacity

Coin Sorter Market By Technology (USD Million, 2025-2035)

  • Optical Sorting
  • Mechanical Sorting
  • Electromagnetic Sorting

Compare Licence

×
Features License Type
Single User Multiuser License Enterprise User
Price $4,950 $5,950 $7,250
Maximum User Access Limit 1 User Upto 10 Users Unrestricted Access Throughout the Organization
Free Customization
Direct Access to Analyst
Deliverable Format
Platform Access
Discount on Next Purchase 10% 15% 15%
Printable Versions