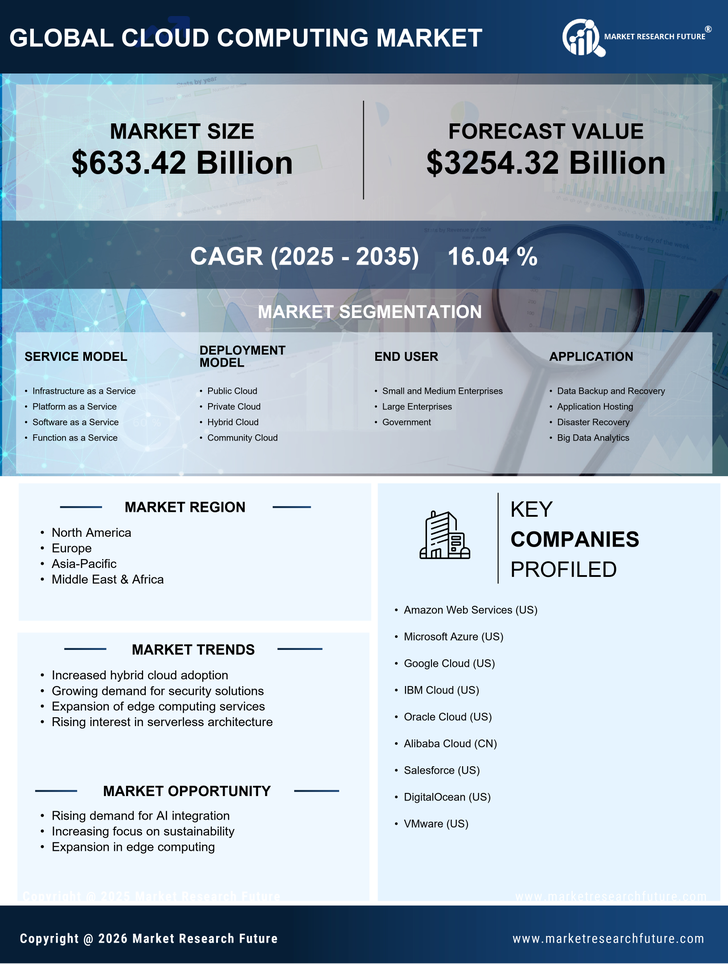


Global Cloud Computing Market by Service Model Outlook (USD Billion, 2019-2035)
Platform-as-a-Service (PaaS)
Software-as-a-Service (SaaS)
Infrastructure-as-a-Service (IAAS)
Global Cloud Computing Market by Deployment Model Outlook (USD Billion, 2019-2035)
Public
Private
Hybrid
Global Cloud Computing Market by Organization Size Outlook (USD Billion, 2019-2035)
Large Enterprises
Small And Medium-Sized Enterprises (SMEs)
Global Cloud Computing Market by Application Outlook (USD Billion, 2019-2035)
Data Backup and Recovery
Application Hosting
Disaster Recovery
Big Data Analytics
Global Cloud Computing Market by Industry Vertical Outlook (USD Billion, 2019-2035)
Banking, Financial Services, and Insurance (BFSI)
IT and Telecommunications
Government Public Sector
Healthcare
Retail and Consumer Goods
Manufacturing
Education
Others
Cloud Computing Market Regional Outlook (USD Million, 2019-2035)
North America Outlook (USD Million, 2019-2035)
North America Cloud Computing Market by Service Model Outlook (USD Billion, 2019-2035)
Platform-as-a-Service (PaaS)
Software-as-a-Service (SaaS)
Infrastructure-as-a-Service (IAAS)
North America Cloud Computing Market by Deployment Model Outlook (USD Billion, 2019-2035)
Public
Private
Hybrid
North America Cloud Computing Market by Organization Size Outlook (USD Billion, 2019-2035)
Large Enterprises
Small And Medium-Sized Enterprises (SMEs)
North America Cloud Computing Market by Application Outlook (USD Billion, 2019-2035)
Data Backup and Recovery
Application Hosting
Disaster Recovery
Big Data Analytics
North America Cloud Computing Market by Industry Vertical Outlook (USD Billion, 2019-2035)
Banking, Financial Services, and Insurance (BFSI)
IT and Telecommunications
Government Public Sector
Healthcare
Retail and Consumer Goods
Manufacturing
Education
Others
US Outlook (USD Million, 2019-2035)
US Cloud Computing Market by Service Model Outlook (USD Billion, 2019-2035)
Platform-as-a-Service (PaaS)
Software-as-a-Service (SaaS)
Infrastructure-as-a-Service (IAAS)
US Cloud Computing Market by Deployment Model Outlook (USD Billion, 2019-2035)
Public
Private
Hybrid
US Cloud Computing Market by Organization Size Outlook (USD Billion, 2019-2035)
Large Enterprises
Small And Medium-Sized Enterprises (SMEs)
US Cloud Computing Market by Application Outlook (USD Billion, 2019-2035)
Data Backup and Recovery
Application Hosting
Disaster Recovery
Big Data Analytics
US Cloud Computing Market by Industry Vertical Outlook (USD Billion, 2019-2035)
Banking, Financial Services, and Insurance (BFSI)
IT and Telecommunications
Government Public Sector
Healthcare
Retail and Consumer Goods
Manufacturing
Education
Others
Canada Outlook (USD Million, 2019-2035)
Global Cloud Computing Market by Service Model Outlook (USD Billion, 2019-2035)
Platform-as-a-Service (PaaS)
Software-as-a-Service (SaaS)
Infrastructure-as-a-Service (IAAS)
Global Cloud Computing Market by Deployment Model Outlook (USD Billion, 2019-2035)
Public
Private
Hybrid
Global Cloud Computing Market by Organization Size Outlook (USD Billion, 2019-2035)
Large Enterprises
Small And Medium-Sized Enterprises (SMEs)
Global Cloud Computing Market by Application Outlook (USD Billion, 2019-2035)
Data Backup and Recovery
Application Hosting
Disaster Recovery
Big Data Analytics
Global Cloud Computing Market by Industry Vertical Outlook (USD Billion, 2019-2035)
Banking, Financial Services, and Insurance (BFSI)
IT and Telecommunications
Government Public Sector
Healthcare
Retail and Consumer Goods
Manufacturing
Education
Others
Europe Outlook (USD Million, 2019-2035)
Global Cloud Computing Market by Service Model Outlook (USD Billion, 2019-2035)
Platform-as-a-Service (PaaS)
Software-as-a-Service (SaaS)
Infrastructure-as-a-Service (IAAS)
Global Cloud Computing Market by Deployment Model Outlook (USD Billion, 2019-2035)
Public
Private
Hybrid
Global Cloud Computing Market by Organization Size Outlook (USD Billion, 2019-2035)
Large Enterprises
Small And Medium-Sized Enterprises (SMEs)
Global Cloud Computing Market by Application Outlook (USD Billion, 2019-2035)
Data Backup and Recovery
Application Hosting
Disaster Recovery
Big Data Analytics
Global Cloud Computing Market by Industry Vertical Outlook (USD Billion, 2019-2035)
Banking, Financial Services, and Insurance (BFSI)
IT and Telecommunications
Government Public Sector
Healthcare
Retail and Consumer Goods
Manufacturing
Education
Others
GermanyOutlook (USD Million, 2019-2035)
Germany Germanium-68 Gallium-68 Generator Market by Product type Outlook (USD Million, 2019-2035)
Column Generators
Automated Generator Systems
Germany Germanium-68 Gallium-68 Generator Market by Production Method Outlook (USD Million, 2019-2035)
Cyclotron-Based Production
Nuclear Reactor-Based Production
Germany Germanium-68 Gallium-68 Generator Market by Application Outlook (USD Million, 2019-2035)
Positron Emission Tomography
Radiopharmaceutical Manufacturing
Research Activities
Germany Germanium-68 Gallium-68 Generator Market by Capacity Outlook (USD Million, 2019-2035)
High Capacity
Low Capacity
Medium Capacity
Germany Germanium-68 Gallium-68 Generator Market by Indication Outlook (USD Million, 2019-2035)
Neuroendocrine Tumors
Prostate Cancer
Infection & Inflammation
Others
Germany Germanium-68 Gallium-68 Generator Market by End-User Outlook (USD Million, 2019-2035)
Hospitals
Independent Radiotherapy Centers
Pharmaceutical & Biotech Companies
Academic & Research Institutes
GermanyGermanium-68 Gallium-68 Generator Market by Distribution Channel Outlook (USD Million, 2019-2035)
Direct Sales
Distributors
UK Outlook (USD Million, 2019-2035)
UK Germanium-68 Gallium-68 Generator Market by Product type Outlook (USD Million, 2019-2035)
Column Generators
Automated Generator Systems
UK Germanium-68 Gallium-68 Generator Market by Production Method Outlook (USD Million, 2019-2035)
Cyclotron-Based Production
Nuclear Reactor-Based Production
UK Germanium-68 Gallium-68 Generator Market by Application Outlook (USD Million, 2019-2035)
Positron Emission Tomography
Radiopharmaceutical Manufacturing
Research Activities
UK Germanium-68 Gallium-68 Generator Market by Capacity Outlook (USD Million, 2019-2035)
High Capacity
Low Capacity
Medium Capacity
UK Germanium-68 Gallium-68 Generator Market by Indication Outlook (USD Million, 2019-2035)
Neuroendocrine Tumors
Prostate Cancer
Infection & Inflammation
Others
UK Germanium-68 Gallium-68 Generator Market by End-User Outlook (USD Million, 2019-2035)
Hospitals
Independent Radiotherapy Centers
Pharmaceutical & Biotech Companies
Academic & Research Institutes
UK Germanium-68 Gallium-68 Generator Market by Distribution Channel Outlook (USD Million, 2019-2035)
Direct Sales
Distributors
France Outlook (USD Million, 2019-2035)
France Germanium-68 Gallium-68 Generator Market by Product type Outlook (USD Million, 2019-2035)
Column Generators
Automated Generator Systems
France Germanium-68 Gallium-68 Generator Market by Production Method Outlook (USD Million, 2019-2035)
Cyclotron-Based Production
Nuclear Reactor-Based Production
France Germanium-68 Gallium-68 Generator Market by Application Outlook (USD Million, 2019-2035)
Positron Emission Tomography
Radiopharmaceutical Manufacturing
Research Activities
France Germanium-68 Gallium-68 Generator Market by Capacity Outlook (USD Million, 2019-2035)
High Capacity
Low Capacity
Medium Capacity
France Germanium-68 Gallium-68 Generator Market by Indication Outlook (USD Million, 2019-2035)
Neuroendocrine Tumors
Prostate Cancer
Infection & Inflammation
Others
France Germanium-68 Gallium-68 Generator Market by End-User Outlook (USD Million, 2019-2035)
Hospitals
Independent Radiotherapy Centers
Pharmaceutical & Biotech Companies
Academic & Research Institutes
France Germanium-68 Gallium-68 Generator Market by Distribution Channel Outlook (USD Million, 2019-2035)
Direct Sales
Distributors
Russia Outlook (USD Million, 2019-2035)
RussiaGermanium-68 Gallium-68 Generator Market by Product type Outlook (USD Million, 2019-2035)
Column Generators
Automated Generator Systems
Russia Germanium-68 Gallium-68 Generator Market by Production Method Outlook (USD Million, 2019-2035)
Cyclotron-Based Production
Nuclear Reactor-Based Production
Russia Germanium-68 Gallium-68 Generator Market by Application Outlook (USD Million, 2019-2035)
Positron Emission Tomography
Radiopharmaceutical Manufacturing
Research Activities
Russia Germanium-68 Gallium-68 Generator Market by Capacity Outlook (USD Million, 2019-2035)
High Capacity
Low Capacity
Medium Capacity
Russia Germanium-68 Gallium-68 Generator Market by Indication Outlook (USD Million, 2019-2035)
Neuroendocrine Tumors
Prostate Cancer
Infection & Inflammation
Others
Russia Germanium-68 Gallium-68 Generator Market by End-User Outlook (USD Million, 2019-2035)
Hospitals
Independent Radiotherapy Centers
Pharmaceutical & Biotech Companies
Academic & Research Institutes
Russia Germanium-68 Gallium-68 Generator Market by Distribution Channel Outlook (USD Million, 2019-2035)
Direct Sales
Distributors
Italy Outlook (USD Million, 2019-2035)
ItalyGermanium-68 Gallium-68 Generator Market by Product type Outlook (USD Million, 2019-2035)
Column Generators
Automated Generator Systems
ItalyGermanium-68 Gallium-68 Generator Market by Production Method Outlook (USD Million, 2019-2035)
Cyclotron-Based Production
Nuclear Reactor-Based Production
ItalyGermanium-68 Gallium-68 Generator Market by Application Outlook (USD Million, 2019-2035)
Positron Emission Tomography
Radiopharmaceutical Manufacturing
Research Activities
ItalyGermanium-68 Gallium-68 Generator Market by Capacity Outlook (USD Million, 2019-2035)
High Capacity
Low Capacity
Medium Capacity
ItalyGermanium-68 Gallium-68 Generator Market by Indication Outlook (USD Million, 2019-2035)
Neuroendocrine Tumors
Prostate Cancer
Infection & Inflammation
Others
ItalyGermanium-68 Gallium-68 Generator Market by End-User Outlook (USD Million, 2019-2035)
Hospitals
Independent Radiotherapy Centers
Pharmaceutical & Biotech Companies
Academic & Research Institutes
ItalyGermanium-68 Gallium-68 Generator Market by Distribution Channel Outlook (USD Million, 2019-2035)
Direct Sales
Distributors
Spain Outlook (USD Million, 2019-2035)
SpainGermanium-68 Gallium-68 Generator Market by Product type Outlook (USD Million, 2019-2035)
Column Generators
Automated Generator Systems
SpainGermanium-68 Gallium-68 Generator Market by Production Method Outlook (USD Million, 2019-2035)
Cyclotron-Based Production
Nuclear Reactor-Based Production
SpainGermanium-68 Gallium-68 Generator Market by Application Outlook (USD Million, 2019-2035)
Positron Emission Tomography
Radiopharmaceutical Manufacturing
Research Activities
SpainGermanium-68 Gallium-68 Generator Market by Capacity Outlook (USD Million, 2019-2035)
High Capacity
Low Capacity
Medium Capacity
SpainGermanium-68 Gallium-68 Generator Market by Indication Outlook (USD Million, 2019-2035)
Neuroendocrine Tumors
Prostate Cancer
Infection & Inflammation
Others
SpainGermanium-68 Gallium-68 Generator Market by End-User Outlook (USD Million, 2019-2035)
Hospitals
Independent Radiotherapy Centers
Pharmaceutical & Biotech Companies
Academic & Research Institutes
SpainGermanium-68 Gallium-68 Generator Market by Distribution Channel Outlook (USD Million, 2019-2035)
Direct Sales
Distributors
Rest Of Europe Outlook (USD Million, 2019-2035)
Rest Of Europe Germanium-68 Gallium-68 Generator Market by Product type Outlook (USD Million, 2019-2035)
Column Generators
Automated Generator Systems
Rest Of Europe Germanium-68 Gallium-68 Generator Market by Production Method Outlook (USD Million, 2019-2035)
Cyclotron-Based Production
Nuclear Reactor-Based Production
Rest Of Europe Germanium-68 Gallium-68 Generator Market by Application Outlook (USD Million, 2019-2035)
Positron Emission Tomography
Radiopharmaceutical Manufacturing
Research Activities
Rest Of Europe Germanium-68 Gallium-68 Generator Market by Capacity Outlook (USD Million, 2019-2035)
High Capacity
Low Capacity
Medium Capacity
Rest Of Europe Germanium-68 Gallium-68 Generator Market by Indication Outlook (USD Million, 2019-2035)
Neuroendocrine Tumors
Prostate Cancer
Infection & Inflammation
Others
Rest Of Europe Germanium-68 Gallium-68 Generator Market by End-User Outlook (USD Million, 2019-2035)
Hospitals
Independent Radiotherapy Centers
Pharmaceutical & Biotech Companies
Academic & Research Institutes
Rest Of Europe Germanium-68 Gallium-68 Generator Market by Distribution Channel Outlook (USD Million, 2019-2035)
Direct Sales
Distributors
Others
Asia-Pacific Outlook (USD Million, 2019-2035)
Asia-Pacific Germanium-68 Gallium-68 Generator Market by Product type Outlook (USD Million, 2019-2035)
Column Generators
Automated Generator Systems
Asia-Pacific Germanium-68 Gallium-68 Generator Market by Production Method Outlook (USD Million, 2019-2035)
Cyclotron-Based Production
Nuclear Reactor-Based Production
Asia-Pacific Germanium-68 Gallium-68 Generator Market by Application Outlook (USD Million, 2019-2035)
Positron Emission Tomography
Radiopharmaceutical Manufacturing
Research Activities
Asia-Pacific Germanium-68 Gallium-68 Generator Market by Capacity Outlook (USD Million, 2019-2035)
High Capacity
Low Capacity
Medium Capacity
Asia-Pacific Germanium-68 Gallium-68 Generator Market by Indication Outlook (USD Million, 2019-2035)
Neuroendocrine Tumors
Prostate Cancer
Infection & Inflammation
Others
Asia-Pacific Germanium-68 Gallium-68 Generator Market by End-User Outlook (USD Million, 2019-2035)
Hospitals
Independent Radiotherapy Centers
Pharmaceutical & Biotech Companies
Academic & Research Institutes
Asia-Pacific Germanium-68 Gallium-68 Generator Market by Distribution Channel Outlook (USD Million, 2019-2035)
Direct Sales
Distributors
China Outlook (USD Million, 2019-2035)
ChinaGermanium-68 Gallium-68 Generator Market by Product type Outlook (USD Million, 2019-2035)
Column Generators
Automated Generator Systems
ChinaGermanium-68 Gallium-68 Generator Market by Production Method Outlook (USD Million, 2019-2035)
Cyclotron-Based Production
Nuclear Reactor-Based Production
ChinaGermanium-68 Gallium-68 Generator Market by Application Outlook (USD Million, 2019-2035)
Positron Emission Tomography
Radiopharmaceutical Manufacturing
Research Activities
ChinaGermanium-68 Gallium-68 Generator Market by Capacity Outlook (USD Million, 2019-2035)
High Capacity
Low Capacity
Medium Capacity
ChinaGermanium-68 Gallium-68 Generator Market by Indication Outlook (USD Million, 2019-2035)
Neuroendocrine Tumors
Prostate Cancer
Infection & Inflammation
Others
ChinaGermanium-68 Gallium-68 Generator Market by End-User Outlook (USD Million, 2019-2035)
Hospitals
Independent Radiotherapy Centers
Pharmaceutical & Biotech Companies
Academic & Research Institutes
ChinaGermanium-68 Gallium-68 Generator Market by Distribution Channel Outlook (USD Million, 2019-2035)
Direct Sales
Distributors
India Outlook (USD Million, 2019-2035)
India Germanium-68 Gallium-68 Generator Market by Product type Outlook (USD Million, 2019-2035)
Column Generators
Automated Generator Systems
India Germanium-68 Gallium-68 Generator Market by Production Method Outlook (USD Million, 2019-2035)
Cyclotron-Based Production
Nuclear Reactor-Based Production
India Germanium-68 Gallium-68 Generator Market by Application Outlook (USD Million, 2019-2035)
Positron Emission Tomography
Radiopharmaceutical Manufacturing
Research Activities
India Germanium-68 Gallium-68 Generator Market by Capacity Outlook (USD Million, 2019-2035)
High Capacity
Low Capacity
Medium Capacity
India Germanium-68 Gallium-68 Generator Market by Indication Outlook (USD Million, 2019-2035)
Neuroendocrine Tumors
Prostate Cancer
Infection & Inflammation
Others
India Germanium-68 Gallium-68 Generator Market by End-User Outlook (USD Million, 2019-2035)
Hospitals
Independent Radiotherapy Centers
Pharmaceutical & Biotech Companies
Academic & Research Institutes
India Germanium-68 Gallium-68 Generator Market by Distribution Channel Outlook (USD Million, 2019-2035)
Direct Sales
Distributors
Japan Outlook (USD Million, 2019-2035)
JapanGermanium-68 Gallium-68 Generator Market by Product type Outlook (USD Million, 2019-2035)
Column Generators
Automated Generator Systems
JapanGermanium-68 Gallium-68 Generator Market by Production Method Outlook (USD Million, 2019-2035)
Cyclotron-Based Production
Nuclear Reactor-Based Production
JapanGermanium-68 Gallium-68 Generator Market by Application Outlook (USD Million, 2019-2035)
Positron Emission Tomography
Radiopharmaceutical Manufacturing
Research Activities
JapanGermanium-68 Gallium-68 Generator Market by Capacity Outlook (USD Million, 2019-2035)
High Capacity
Low Capacity
Medium Capacity
JapanGermanium-68 Gallium-68 Generator Market by Indication Outlook (USD Million, 2019-2035)
Neuroendocrine Tumors
Prostate Cancer
Infection & Inflammation
Others
JapanGermanium-68 Gallium-68 Generator Market by End-User Outlook (USD Million, 2019-2035)
Hospitals
Independent Radiotherapy Centers
Pharmaceutical & Biotech Companies
Academic & Research Institutes
JapanGermanium-68 Gallium-68 Generator Market by Distribution Channel Outlook (USD Million, 2019-2035)
Direct Sales
Distributors
South Korea Outlook (USD Million, 2019-2035)
South Korea Germanium-68 Gallium-68 Generator Market by Product type Outlook (USD Million, 2019-2035)
Column Generators
Automated Generator Systems
South Korea Germanium-68 Gallium-68 Generator Market by Production Method Outlook (USD Million, 2019-2035)
Cyclotron-Based Production
Nuclear Reactor-Based Production
South Korea Germanium-68 Gallium-68 Generator Market by Application Outlook (USD Million, 2019-2035)
Positron Emission Tomography
Radiopharmaceutical Manufacturing
Research Activities
South Korea Germanium-68 Gallium-68 Generator Market by Capacity Outlook (USD Million, 2019-2035)
High Capacity
Low Capacity
Medium Capacity
South Korea Germanium-68 Gallium-68 Generator Market by Indication Outlook (USD Million, 2019-2035)
Neuroendocrine Tumors
Prostate Cancer
Infection & Inflammation
Others
South Korea Germanium-68 Gallium-68 Generator Market by End-User Outlook (USD Million, 2019-2035)
Hospitals
Independent Radiotherapy Centers
Pharmaceutical & Biotech Companies
Academic & Research Institutes
South Korea Germanium-68 Gallium-68 Generator Market by Distribution Channel Outlook (USD Million, 2019-2035)
Direct Sales
Distributors
Rest of Asia-Pacific Outlook (USD Million, 2019-2035)
Rest of Asia-Pacific Germanium-68 Gallium-68 Generator Market by Product type Outlook (USD Million, 2019-2035)
Column Generators
Automated Generator Systems
Rest of Asia-Pacific Germanium-68 Gallium-68 Generator Market by Production Method Outlook (USD Million, 2019-2035)
Cyclotron-Based Production
Nuclear Reactor-Based Production
Rest of Asia-Pacific Germanium-68 Gallium-68 Generator Market by Application Outlook (USD Million, 2019-2035)
Positron Emission Tomography
Radiopharmaceutical Manufacturing
Research Activities
Rest of Asia-Pacific Germanium-68 Gallium-68 Generator Market by Capacity Outlook (USD Million, 2019-2035)
High Capacity
Low Capacity
Medium Capacity
Rest of Asia-Pacific Germanium-68 Gallium-68 Generator Market by Indication Outlook (USD Million, 2019-2035)
Neuroendocrine Tumors
Prostate Cancer
Infection & Inflammation
Others
Rest of Asia-Pacific Germanium-68 Gallium-68 Generator Market by End-User Outlook (USD Million, 2019-2035)
Hospitals
Independent Radiotherapy Centers
Pharmaceutical & Biotech Companies
Academic & Research Institutes
Rest of Asia-Pacific Germanium-68 Gallium-68 Generator Market by Distribution Channel Outlook (USD Million, 2019-2035)
Direct Sales
Distributors
South America Outlook (USD Million, 2019-2035)
South America Germanium-68 Gallium-68 Generator Market by Product type Outlook (USD Million, 2019-2035)
Column Generators
Automated Generator Systems
South America Germanium-68 Gallium-68 Generator Market by Production Method Outlook (USD Million, 2019-2035)
Cyclotron-Based Production
Nuclear Reactor-Based Production
South America Germanium-68 Gallium-68 Generator Market by Application Outlook (USD Million, 2019-2035)
Positron Emission Tomography
Radiopharmaceutical Manufacturing
Research Activities
South America Germanium-68 Gallium-68 Generator Market by Capacity Outlook (USD Million, 2019-2035)
High Capacity
Low Capacity
Medium Capacity
South America Germanium-68 Gallium-68 Generator Market by Indication Outlook (USD Million, 2019-2035)
Neuroendocrine Tumors
Prostate Cancer
Infection & Inflammation
Others
South America Germanium-68 Gallium-68 Generator Market by End-User Outlook (USD Million, 2019-2035)
Hospitals
Independent Radiotherapy Centers
Pharmaceutical & Biotech Companies
Academic & Research Institutes
South America Germanium-68 Gallium-68 Generator Market by Distribution Channel Outlook (USD Million, 2019-2035)
Direct Sales
Distributors
Brazil Outlook (USD Million, 2019-2035)
Brazil Germanium-68 Gallium-68 Generator Market by Product type Outlook (USD Million, 2019-2035)
Column Generators
Automated Generator Systems
Brazil Germanium-68 Gallium-68 Generator Market by Production Method Outlook (USD Million, 2019-2035)
Cyclotron-Based Production
Nuclear Reactor-Based Production
Brazil Germanium-68 Gallium-68 Generator Market by Application Outlook (USD Million, 2019-2035)
Positron Emission Tomography
Radiopharmaceutical Manufacturing
Research Activities
Brazil Germanium-68 Gallium-68 Generator Market by Capacity Outlook (USD Million, 2019-2035)
High Capacity
Low Capacity
Medium Capacity
Brazil Germanium-68 Gallium-68 Generator Market by Indication Outlook (USD Million, 2019-2035)
Neuroendocrine Tumors
Prostate Cancer
Infection & Inflammation
Others
Brazil Germanium-68 Gallium-68 Generator Market by End-User Outlook (USD Million, 2019-2035)
Hospitals
Independent Radiotherapy Centers
Pharmaceutical & Biotech Companies
Academic & Research Institutes
Brazil Germanium-68 Gallium-68 Generator Market by Distribution Channel Outlook (USD Million, 2019-2035)
Direct Sales
Distributors
Mexico Outlook (USD Million, 2019-2035)
MexicoGermanium-68 Gallium-68 Generator Market by Product type Outlook (USD Million, 2019-2035)
Column Generators
Automated Generator Systems
MexicoGermanium-68 Gallium-68 Generator Market by Production Method Outlook (USD Million, 2019-2035)
Cyclotron-Based Production
Nuclear Reactor-Based Production
MexicoGermanium-68 Gallium-68 Generator Market by Application Outlook (USD Million, 2019-2035)
Positron Emission Tomography
Radiopharmaceutical Manufacturing
Research Activities
MexicoGermanium-68 Gallium-68 Generator Market by Capacity Outlook (USD Million, 2019-2035)
High Capacity
Low Capacity
Medium Capacity
MexicoGermanium-68 Gallium-68 Generator Market by Indication Outlook (USD Million, 2019-2035)
Neuroendocrine Tumors
Prostate Cancer
Infection & Inflammation
Others
MexicoGermanium-68 Gallium-68 Generator Market by End-User Outlook (USD Million, 2019-2035)
Hospitals
Independent Radiotherapy Centers
Pharmaceutical & Biotech Companies
Academic & Research Institutes
MexicoGermanium-68 Gallium-68 Generator Market by Distribution Channel Outlook (USD Million, 2019-2035)
Direct Sales
Distributors
Argentina Outlook (USD Million, 2019-2035)
ArgentinaGermanium-68 Gallium-68 Generator Market by Product type Outlook (USD Million, 2019-2035)
Column Generators
Automated Generator Systems
ArgentinaGermanium-68 Gallium-68 Generator Market by Production Method Outlook (USD Million, 2019-2035)
Cyclotron-Based Production
Nuclear Reactor-Based Production
ArgentinaGermanium-68 Gallium-68 Generator Market by Application Outlook (USD Million, 2019-2035)
Positron Emission Tomography
Radiopharmaceutical Manufacturing
Research Activities
ArgentinaGermanium-68 Gallium-68 Generator Market by Capacity Outlook (USD Million, 2019-2035)
High Capacity
Low Capacity
Medium Capacity
ArgentinaGermanium-68 Gallium-68 Generator Market by Indication Outlook (USD Million, 2019-2035)
Neuroendocrine Tumors
Prostate Cancer
Infection & Inflammation
Others
ArgentinaGermanium-68 Gallium-68 Generator Market by End-User Outlook (USD Million, 2019-2035)
Hospitals
Independent Radiotherapy Centers
Pharmaceutical & Biotech Companies
Academic & Research Institutes
ArgentinaGermanium-68 Gallium-68 Generator Market by Distribution Channel Outlook (USD Million, 2019-2035)
Direct Sales
Distributors
Rest of South America Outlook (USD Million, 2019-2035)
Rest of South America Germanium-68 Gallium-68 Generator Market by Product type Outlook (USD Million, 2019-2035)
Column Generators
Automated Generator Systems
Rest of South America Germanium-68 Gallium-68 Generator Market by Production Method Outlook (USD Million, 2019-2035)
Cyclotron-Based Production
Nuclear Reactor-Based Production
Rest of South America Germanium-68 Gallium-68 Generator Market by Application Outlook (USD Million, 2019-2035)
Positron Emission Tomography
Radiopharmaceutical Manufacturing
Research Activities
Rest of South America Germanium-68 Gallium-68 Generator Market by Capacity Outlook (USD Million, 2019-2035)
High Capacity
Low Capacity
Medium Capacity
North America Germanium-68 Gallium-68 Generator Market by Indication Outlook (USD Million, 2019-2035)
Neuroendocrine Tumors
Prostate Cancer
Infection & Inflammation
Others
Rest of South America Germanium-68 Gallium-68 Generator Market by End-User Outlook (USD Million, 2019-2035)
Hospitals
Independent Radiotherapy Centers
Pharmaceutical & Biotech Companies
Academic & Research Institutes
Rest of South America Germanium-68 Gallium-68 Generator Market by Distribution Channel Outlook (USD Million, 2019-2035)
Direct Sales
Distributors
Middle East & Africa Outlook (USD Million, 2019-2035)
Middle East & Africa Germanium-68 Gallium-68 Generator Market by Product type Outlook (USD Million, 2019-2035)
Column Generators
Automated Generator Systems
Middle East & Africa Germanium-68 Gallium-68 Generator Market by Production Method Outlook (USD Million, 2019-2035)
Cyclotron-Based Production
Nuclear Reactor-Based Production
Middle East & Africa Germanium-68 Gallium-68 Generator Market by Application Outlook (USD Million, 2019-2035)
Positron Emission Tomography
Radiopharmaceutical Manufacturing
Research Activities
Middle East & Africa Germanium-68 Gallium-68 Generator Market by Capacity Outlook (USD Million, 2019-2035)
High Capacity
Low Capacity
Medium Capacity
Middle East & Africa Germanium-68 Gallium-68 Generator Market by Indication Outlook (USD Million, 2019-2035)
Neuroendocrine Tumors
Prostate Cancer
Infection & Inflammation
Others
Middle East & Africa Germanium-68 Gallium-68 Generator Market by End-User Outlook (USD Million, 2019-2035)
Hospitals
Independent Radiotherapy Centers
Pharmaceutical & Biotech Companies
Academic & Research Institutes
Middle East & Africa Germanium-68 Gallium-68 Generator Market by Distribution Channel Outlook (USD Million, 2019-2035)
Direct Sales
Distributors
GCC Countries Outlook (USD Million, 2019-2035)
Global Cloud Computing Market by Service Model Outlook (USD Billion, 2019-2035)
Platform-as-a-Service (PaaS)
Software-as-a-Service (SaaS)
Infrastructure-as-a-Service (IAAS)
Global Cloud Computing Market by Deployment Model Outlook (USD Billion, 2019-2035)
Public
Private
Hybrid
Global Cloud Computing Market by Organization Size Outlook (USD Billion, 2019-2035)
Large Enterprises
Small And Medium-Sized Enterprises (SMEs)
Global Cloud Computing Market by Application Outlook (USD Billion, 2019-2035)
Data Backup and Recovery
Application Hosting
Disaster Recovery
Big Data Analytics
Global Cloud Computing Market by Industry Vertical Outlook (USD Billion, 2019-2035)
Banking, Financial Services, and Insurance (BFSI)
IT and Telecommunications
Government Public Sector
Healthcare
Retail and Consumer Goods
Manufacturing
Education
Others
South Africa Outlook (USD Million, 2019-2035)
Global Cloud Computing Market by Service Model Outlook (USD Billion, 2019-2035)
Platform-as-a-Service (PaaS)
Software-as-a-Service (SaaS)
Infrastructure-as-a-Service (IAAS)
Global Cloud Computing Market by Deployment Model Outlook (USD Billion, 2019-2035)
Public
Private
Hybrid
Global Cloud Computing Market by Organization Size Outlook (USD Billion, 2019-2035)
Large Enterprises
Small And Medium-Sized Enterprises (SMEs)
Global Cloud Computing Market by Application Outlook (USD Billion, 2019-2035)
Data Backup and Recovery
Application Hosting
Disaster Recovery
Big Data Analytics
Global Cloud Computing Market by Industry Vertical Outlook (USD Billion, 2019-2035)
Banking, Financial Services, and Insurance (BFSI)
IT and Telecommunications
Government Public Sector
Healthcare
Retail and Consumer Goods
Manufacturing
Education
Others
Rest of Middle East & Africa Outlook (USD Million, 2019-2035)
Rest of Middle East & Africa Cloud Computing Market by Service Model Outlook (USD Billion, 2019-2035)
Platform-as-a-Service (PaaS)
Software-as-a-Service (SaaS)
Infrastructure-as-a-Service (IAAS)
Rest of Middle East & Africa Cloud Computing Market by Deployment Model Outlook (USD Billion, 2019-2035)
Public
Private
Hybrid
Rest of Middle East & Africa Cloud Computing Market by Organization Size Outlook (USD Billion, 2019-2035)
Large Enterprises
Small And Medium-Sized Enterprises (SMEs)
Rest of Middle East & Africa Cloud Computing Market by Application Outlook (USD Billion, 2019-2035)
Data Backup and Recovery
Application Hosting
Disaster Recovery
Big Data Analytics
Rest of Middle East & Africa Cloud Computing Market by Industry Vertical Outlook (USD Billion, 2019-2035)
Banking, Financial Services, and Insurance (BFSI)
IT and Telecommunications
Government Public Sector
Healthcare
Retail and Consumer Goods
Manufacturing
Education
Others


