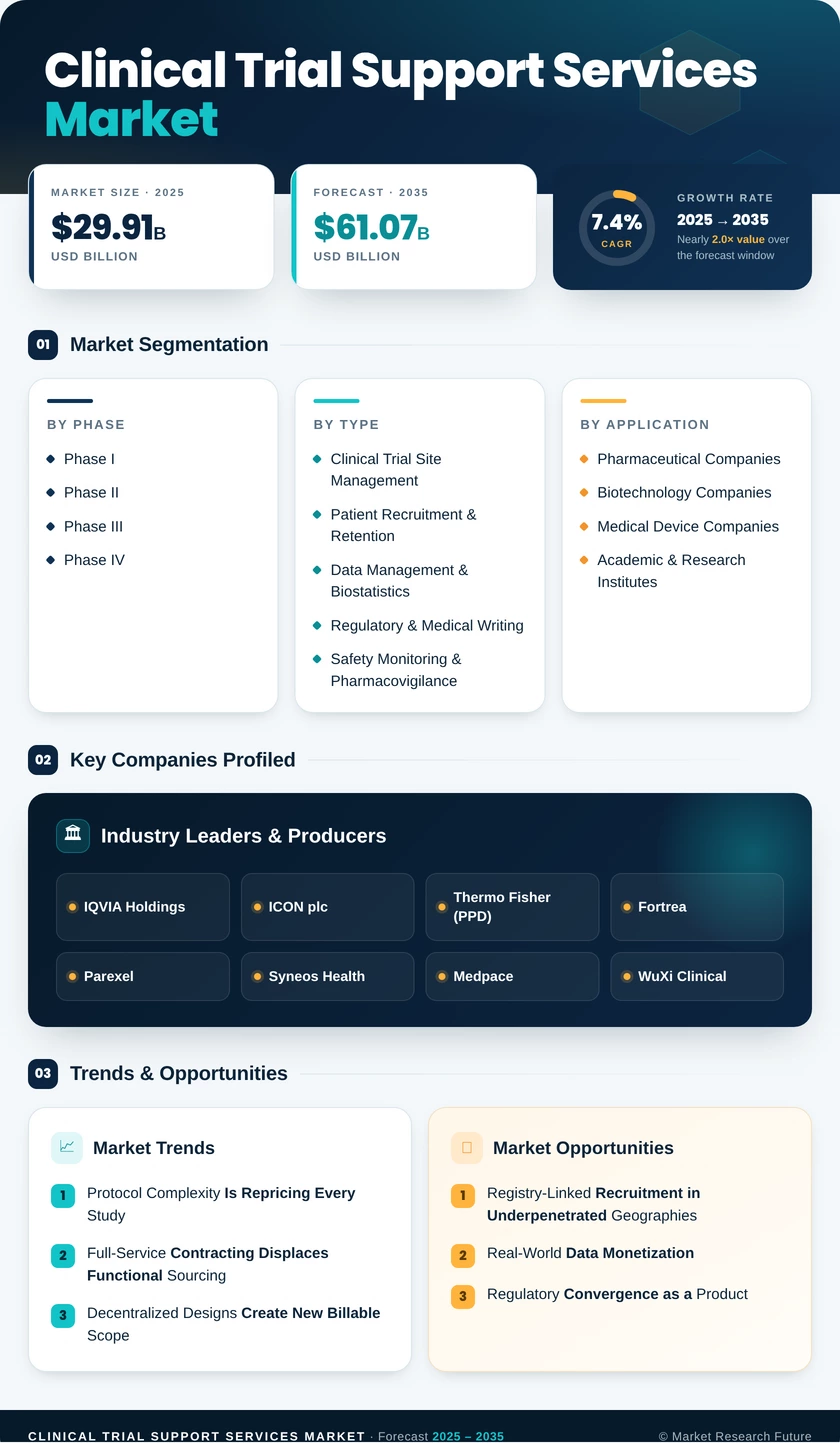
Clinical Trial Support Services Market (2026 - 2035)

Global Clinical Trial Support Services Market Research Report: Size, Share, Trend Analysis By Service (Clinical Trial Site Management, Patient Recruitment Management [Patient recruitment & registry services, Patient retention, Others], Data Management, Administrative staff, IRB, Others), By Phase (Phase I, Phase II, Phase III, Phase IV), By Sponsor (Pharmaceutical & Biopharmaceutical, Medical Devices, Others), And By Region (North America, Europe, Asia-Pacific, And Rest Of The World) - Growth Outlook & Industry Forecast 2025 To 2035

Forecast Period
2026-2035
CAGR
7.4%
2025 Market Size
USD 29.91 Billion
2035 Market Size
USD 61.07 Billion
Healthcare Services ● Updated August 2026 Report ID: MRFR/HS/20402-HCR | Pages: 128 | Author: Nidhi Mandole, Rahul Gotadki
  1. 1 Market Summary |
    1. 1.1 Study Assumptions & Market Definition |
    2. 1.2 Scope of the Study |
    3. 1.3 Research Methodology
  2. 2 Key Report Takeaways |
    1. 2.1 By Service Type |
    2. 2.2 By End User |
    3. 2.3 By Geography
  3. 3 Market Size & Forecast (2021–2035) |
    1. 3.1 Historical Market Size (2021–2024) |
    2. 3.2 Base Year Estimate (2025) |
    3. 3.3 Forecast Market Size (2026–2035) |
    4. 3.4 Year-over-Year Growth Analysis
  4. 4 Driver Impact Analysis |
    1. 4.1 Protocol Complexity and Amendment Rates |
    2. 4.2 Full-Service Contracting Displacement |
    3. 4.3 Decentralized and Hybrid Trial Adoption |
    4. 4.4 Emerging Biotech Pipeline Expansion
  5. 5 Restraints Impact Analysis |
    1. 5.1 Rate-Card Pressure and Margin Compression |
    2. 5.2 Site Staffing and Coordinator Turnover |
    3. 5.3 Data-Privacy Fragmentation
  6. 6 Opportunity Analysis |
    1. 6.1 Registry-Linked Recruitment in Underpenetrated Geographies |
    2. 6.2 Real-World Data Monetization |
    3. 6.3 Regulatory Convergence as a Product |
    4. 6.4 Device and Diagnostics Sponsors |
    5. 6.5 Oncology Master Protocols |
    6. 6.6 Industry Value Chain Analysis |
    7. 6.7 Porter's Five Forces Analysis
  7. 7 Regional Market Share & Country-Level Analysis |
    1. 7.1 North America | |
      1. 7.1.1 US | |
      2. 7.1.2 Canada | |
      3. 7.1.3 Mexico |
    2. 7.2 Europe | |
      1. 7.2.1 Germany | |
      2. 7.2.2 UK | |
      3. 7.2.3 France | |
      4. 7.2.4 Italy | |
      5. 7.2.5 Spain | |
      6. 7.2.6 Nordic Countries | |
      7. 7.2.7 Russia | |
      8. 7.2.8 Rest of Europe |
    3. 7.3 Asia-Pacific | |
      1. 7.3.1 China | |
      2. 7.3.2 India | |
      3. 7.3.3 Japan | |
      4. 7.3.4 South Korea | |
      5. 7.3.5 ASEAN | |
      6. 7.3.6 Rest of Asia-Pacific |
    4. 7.4 South America | |
      1. 7.4.1 Brazil | |
      2. 7.4.2 Argentina | |
      3. 7.4.3 Rest of South America |
    5. 7.5 Middle East & Africa | |
      1. 7.5.1 Saudi Arabia | |
      2. 7.5.2 UAE | |
      3. 7.5.3 South Africa | |
      4. 7.5.4 Egypt | |
      5. 7.5.5 Rest of Middle East & Africa
  8. 8 Future Outlook (2026–2035) |
    1. 8.1 Machine Learning in Production Delivery |
    2. 8.2 Platform Economics and Vendor Selection |
    3. 8.3 Trial Diversity as Contractual Obligation |
    4. 8.4 Sustainability in Procurement Scoring
  9. 9 Market Segmentation Analysis |
    1. 9.1 By Phase | |
      1. 9.1.1 Phase I | |
      2. 9.1.2 Phase II | |
      3. 9.1.3 Phase III | |
      4. 9.1.4 Phase IV |
    2. 9.2 By Service Type | |
      1. 9.2.1 Clinical Trial Site Management | |
      2. 9.2.2 Patient Recruitment & Retention | |
      3. 9.2.3 Data Management & Biostatistics | |
      4. 9.2.4 Regulatory & Medical Writing | |
      5. 9.2.5 Safety Monitoring & Pharmacovigilance | |
      6. 9.2.6 Logistics & Supply Chain Management | |
      7. 9.2.7 Other Services |
    3. 9.3 By End User | |
      1. 9.3.1 Pharmaceutical Companies | |
      2. 9.3.2 Biotechnology Companies | |
      3. 9.3.3 Medical Device Companies | |
      4. 9.3.4 Academic & Research Institutes |
    4. 9.4 By Therapeutic Area | |
      1. 9.4.1 Oncology | |
      2. 9.4.2 Cardiology | |
      3. 9.4.3 Neurology | |
      4. 9.4.4 Infectious Diseases | |
      5. 9.4.5 Metabolic & Endocrinology | |
      6. 9.4.6 Other Therapeutic Areas
  10. 10 Competitive Landscape |
    1. 10.1 Market Share Analysis (2026) |
    2. 10.2 Competitive Benchmarking Matrix |
    3. 10.3 Company Profiles | |
      1. 10.3.1 IQVIA Holdings | |
      2. 10.3.2 ICON plc | |
      3. 10.3.3 Thermo Fisher Scientific (PPD) | |
      4. 10.3.4 Fortrea | |
      5. 10.3.5 Parexel | |
      6. 10.3.6 Syneos Health | |
      7. 10.3.7 Medpace | |
      8. 10.3.8 WuXi Clinical | |
      9. 10.3.9 Charles River Laboratories | |
      10. 10.3.10 Labcorp Biopharma Services | |
      11. 10.3.11 Novotech
  11. 11 Recent News & Developments
  12. 12 Report Scope & Methodology |
    1. 12.1 Study Period & Base Year |
    2. 12.2 Data Sources & Citations |
    3. 12.3 Abbreviations
  13. 13 Detailed Sources & Citations
  14. 14 Frequently Asked Questions
  15. 15 LIST OF TABLES |
  16. TABLE 1 Global Clinical Trial Support Services Market Size & Forecast, by Revenue (USD Billion), 2021–2035 |
  17. TABLE 2 Global Market – Year-over-Year Growth Analysis, 2021–2035 |
  18. TABLE 3 Driver Impact Analysis Matrix, 2026–2035 |
  19. TABLE 4 Restraint Impact Analysis Matrix, 2026–2035 |
  20. TABLE 5 Global Market Size, by Region, 2021–2035 (USD Billion) |
  21. TABLE 6 North America Market Size, by Country, 2021–2035 (USD Billion) |
  22. TABLE 7 Europe Market Size, by Country, 2021–2035 (USD Billion) |
  23. TABLE 8 Asia-Pacific Market Size, by Country, 2021–2035 (USD Billion) |
  24. TABLE 9 South America Market Size, by Country, 2021–2035 (USD Billion) |
  25. TABLE 10 Middle East & Africa Market Size, by Country, 2021–2035 (USD Billion) |
  26. TABLE 11 Global Market Size, by Phase, 2021–2035 (USD Billion) |
  27. TABLE 12 Global Market Size, by Service Type, 2021–2035 (USD Billion) |
  28. TABLE 13 Global Market Size, by End User, 2021–2035 (USD Billion) |
  29. TABLE 14 Global Market Size, by Therapeutic Area, 2021–2035 (USD Billion) |
  30. TABLE 15 North America Market Size, by Service Type, 2021–2035 (USD Billion) |
  31. TABLE 16 Europe Market Size, by Service Type, 2021–2035 (USD Billion) |
  32. TABLE 17 Asia-Pacific Market Size, by Service Type, 2021–2035 (USD Billion) |
  33. TABLE 18 South America Market Size, by End User, 2021–2035 (USD Billion) |
  34. TABLE 19 Middle East & Africa Market Size, by End User, 2021–2035 (USD Billion) |
  35. TABLE 20 Competitive Benchmarking Matrix, 2026 |
  36. TABLE 21 Company Profiles – Key Players |
  37. TABLE 22 Recent Developments & Strategic Announcements, 2023–2025 |
  38. TABLE 23 Report Scope & Methodology Summary |
  39. TABLE 24 Detailed Sources & Citations Index
  40. 16 LIST OF FIGURES |
  41. FIGURE 1 Market Dynamics – Drivers, Restraints, Opportunities and Challenges |
  42. FIGURE 2 Industry Value Chain Analysis |
  43. FIGURE 3 Porter's Five Forces Analysis |
  44. FIGURE 4 Global Market Size Trend, 2021–2035 (USD Billion) |
  45. FIGURE 5 Year-over-Year Growth Trajectory, 2022–2035 (%) |
  46. FIGURE 6 Market Share by Phase, 2025 vs 2035 (%) |
  47. FIGURE 7 Market Share by Service Type, 2025 (%) |
  48. FIGURE 8 Market Share by End User, 2025 (%) |
  49. FIGURE 9 Market Share by Therapeutic Area, 2025 (%) |
  50. FIGURE 10 Regional Revenue Share, 2025 (%) |
  51. FIGURE 11 Regional CAGR Comparison, 2026–2035 (%) |
  52. FIGURE 12 North America Country-Level Share, 2025 (%) |
  53. FIGURE 13 Asia-Pacific Country-Level Share, 2025 (%) |
  54. FIGURE 14 Competitive Landscape – Estimated Revenue Share Bands, 2026 |
  55. FIGURE 15 Strategic Positioning Matrix – Scale vs Therapeutic Specialization
Share::
Request Free Sample

Segmentation Quick Reference

DimensionSub-SegmentsDominant SegmentFastest Growing Segment
By PhasePhase I, Phase II, Phase III, Phase IVPhase IIIPhase IV
By Service TypeClinical Trial Site Management, Patient Recruitment & Retention, Data Management & Biostatistics, Regulatory & Medical Writing, Safety Monitoring & Pharmacovigilance, Logistics & Supply Chain Management, Other ServicesClinical Trial Site ManagementPatient Recruitment & Retention
By End UserPharmaceutical Companies, Biotechnology Companies, Medical Device Companies, Academic & Research InstitutesPharmaceutical CompaniesBiotechnology Companies
By Therapeutic AreaOncology, Cardiology, Neurology, Infectious Diseases, Metabolic & Endocrinology, Other Therapeutic AreasOncologyMetabolic & Endocrinology
By GeographyNorth America, Europe, Asia-Pacific, South America, Middle East & AfricaNorth AmericaAsia-Pacific


Market Segmentation Overview

By Phase

Sub-SegmentKey Trend
Phase IDedicated early-phase units expanding in Australia and Asia-Pacific
Phase IIAdaptive designs shortening decision cycles
Phase IIIMulti-country registrational scale sustaining the largest spend pool
Phase IVConfirmatory evidence obligations following conditional approvals


Phase III retains the deepest budget because registrational studies span dozens of countries and thousands of patients. Phase IV expands quickest as accelerated approvals attach binding post-marketing commitments.

By Service Type

Sub-SegmentKey Trend
Clinical Trial Site ManagementSite activation bottlenecks keeping demand structurally tight
Patient Recruitment & RetentionDigital prescreening and community networks lifting enrollment yield
Data Management & BiostatisticsEndpoint proliferation driving statistical programming hours
Regulatory & Medical WritingMulti-agency submission convergence under ICH E6(R3)
Safety Monitoring & PharmacovigilanceAutomated signal detection replacing manual case triage
Logistics & Supply Chain ManagementCold-chain biologics and direct-to-patient shipment growth
Other ServicesCentral imaging and specialty laboratory demand


Service demand has shifted toward the front end of the study lifecycle. Recruitment and site management now absorb close to two-fifths of contracted spend because delay, not delivery quality, is the dominant sponsor risk.

By End User

Sub-SegmentKey Trend
Pharmaceutical CompaniesPortfolio-level strategic partnerships replacing study-by-study awards
Biotechnology CompaniesVirtual operating models outsourcing near-total trial execution
Medical Device CompaniesEU MDR post-market clinical follow-up creating new demand
Academic & Research InstitutesFederally funded network trials seeking commercial-grade operations


Large pharmaceutical sponsors still supply the majority of revenue, but growth is migrating toward emerging biotechs that operate with fewer than fifty employees and outsource nearly every clinical function.

By Therapeutic Area

Sub-SegmentKey Trend
OncologyMaster and basket protocols requiring continuous statistical support
CardiologyLarge cardiovascular outcome trials with extended follow-up
NeurologyAlzheimer's and neurodegenerative pipeline revival
Infectious DiseasesPlatform readiness and pandemic preparedness funding
Metabolic & EndocrinologyGLP-1 outcome studies driving very large enrollment
Other Therapeutic AreasRare disease programs with dispersed patient populations


Oncology remains the anchor therapeutic area, supported by protocol designs that add cohorts mid-study. Metabolic studies grow fastest as obesity and cardiometabolic outcome trials enroll tens of thousands of participants each.

By Geography

Sub-SegmentKey Trend
North AmericaDiversity Action Plan compliance reshaping site selection
EuropeCTIS-driven submission standardization improving timelines
Asia-PacificRegulatory reform and patient-pool economics attracting global protocols
South AmericaBrazil's 2024 research law removing ethics-review delays
Middle East & AfricaNational genomics and Vision 2030 health investment


Geographic allocation increasingly follows approval speed rather than legacy relationships. Regions that compress ethics and regulatory review below fifty days are capturing a disproportionate share of new protocol placement.




Share::
Request Free Sample
Download PDF ×

We do not share your information with anyone. However, we may send you emails based on your report interest from time to time. You may contact us at any time to opt-out.