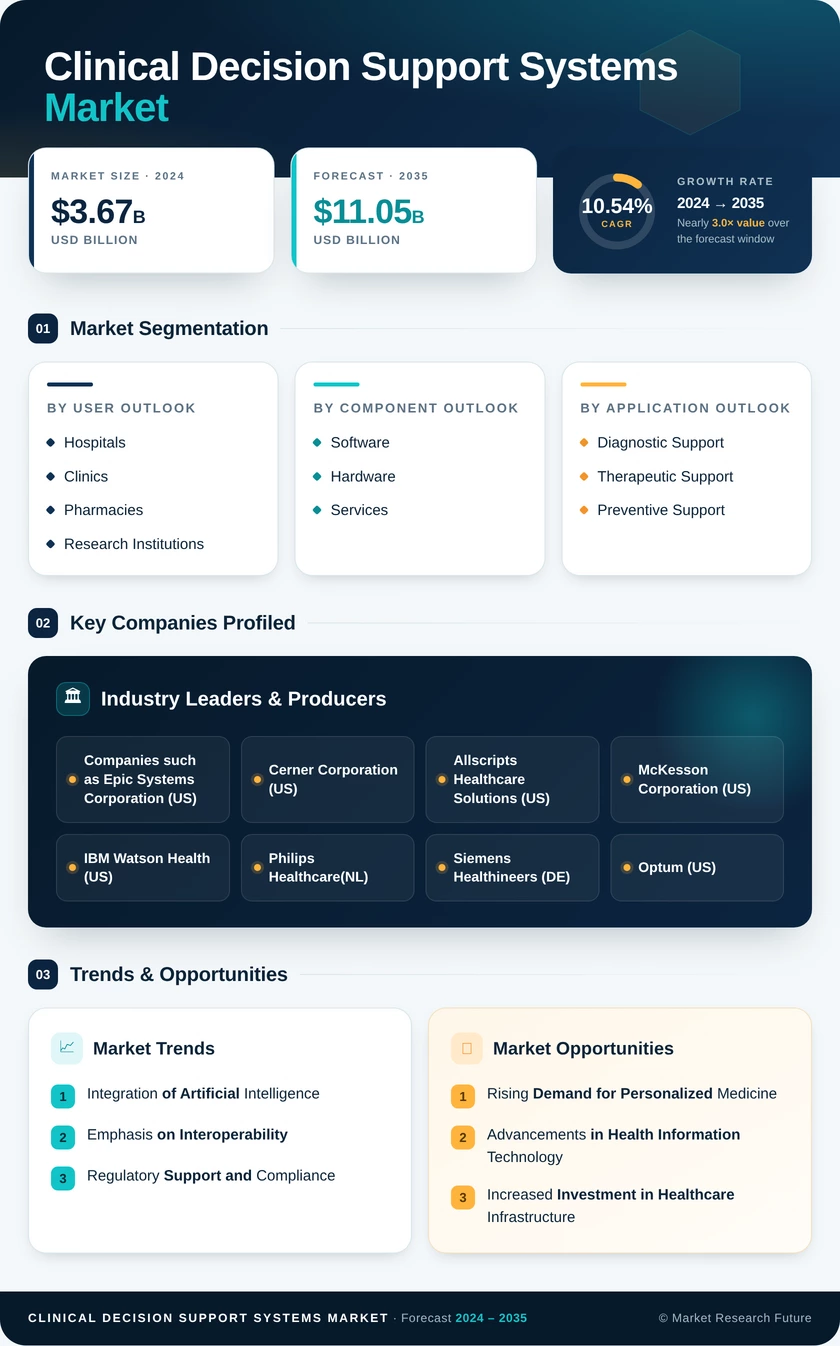
Clinical Decision Support Systems Market (2026 - 2035)

ID: MRFR/HC/4580-CR 200 Pages Rahul Gotadki Last Updated: September 15, 2026
Clinical Decision Support Systems Market Research Report: Size, Share, Trend Analysis By Component (Software, Hardware, Services), By Deployment Mode (On-Premise, Cloud-Based, Web-Based), By End Users (Hospitals, Clinics, Pharmacies, Research Institutions), By Applications (Diagnostic Support, Therapeutic Support, Preventive Support) and By Regional (North America, Europe, South America, Asia Pacific, Middle East and Africa) - Growth Outlook & Industry Forecast 2025 To 2035
Clinical Decision Support Systems Market
Market Size
Forecast Period2026-2035
CAGR (2026-2035)11.1%
2025 Market SizeUSD 2.86 Billion
2035 Market SizeUSD 8.20 Billion
Key Players
Epic Systems
Oracle Health
Wolters Kluwer Health
Elsevier
Merative
Veradigm
Opportunities
  • Specialty-Depth Modules Beyond General Medicine
  • Emerging-Market National Tenders
  • De-identified Outcome Data as a Commercial Asset
  1. 1 Market Summary |
    1. 1.1 Study Assumptions & Market Definition |
    2. 1.2 Scope of the Study |
    3. 1.3 Research Methodology
  2. 2 Key Report Takeaways |
    1. 2.1 By Technology |
    2. 2.2 By Sector |
    3. 2.3 By Geography
  3. 3 Market Size & Forecast (2021–2035) |
    1. 3.1 Historical Market Size (2021–2024) |
    2. 3.2 Base Year Assessment (2025) |
    3. 3.3 Forecast Market Size (2026–2035) |
    4. 3.4 Year-over-Year Growth Analysis
  4. 4 Driver Impact Analysis |
    1. 4.1 Regulatory Enforcement and Interoperability Mandates |
    2. 4.2 Machine Learning in Production Clinical Workflow |
    3. 4.3 Patient-Safety and Medication-Error Economics |
    4. 4.4 Reimbursement Recognition for Algorithm-Assisted Services
  5. 5 Restraints Impact Analysis |
    1. 5.1 Alert Fatigue and Override Rates |
    2. 5.2 Integration Cost and Legacy Fragmentation |
    3. 5.3 Regulatory Ambiguity for Adaptive Algorithms
  6. 6 Opportunities |
    1. 6.1 Specialty-Depth Content Modules |
    2. 6.2 Emerging-Market National Tenders |
    3. 6.3 De-identified Outcome Data Monetization |
    4. 6.4 Payer-Side Deployment |
    5. 6.5 Ambient Capture Convergence
  7. 7 Regional Market Share & Country-Level Analysis |
    1. 7.1 North America | |
      1. 7.1.1 United States | |
      2. 7.1.2 Canada | |
      3. 7.1.3 Mexico |
    2. 7.2 Europe | |
      1. 7.2.1 Germany | |
      2. 7.2.2 United Kingdom | |
      3. 7.2.3 France | |
      4. 7.2.4 Italy | |
      5. 7.2.5 Spain | |
      6. 7.2.6 Nordic Countries | |
      7. 7.2.7 Russia | |
      8. 7.2.8 Rest of Europe |
    3. 7.3 Asia-Pacific | |
      1. 7.3.1 China | |
      2. 7.3.2 India | |
      3. 7.3.3 Japan | |
      4. 7.3.4 South Korea | |
      5. 7.3.5 ASEAN | |
      6. 7.3.6 Rest of Asia-Pacific |
    4. 7.4 South America | |
      1. 7.4.1 Brazil | |
      2. 7.4.2 Argentina | |
      3. 7.4.3 Rest of South America |
    5. 7.5 Middle East & Africa | |
      1. 7.5.1 Saudi Arabia | |
      2. 7.5.2 UAE | |
      3. 7.5.3 South Africa | |
      4. 7.5.4 Egypt | |
      5. 7.5.5 Rest of Middle East & Africa
  8. 8 Future Outlook (2026–2035) |
    1. 8.1 Autonomous Advisory Loops |
    2. 8.2 Platform Economics and Consolidation |
    3. 8.3 Evidence Generation as Infrastructure |
    4. 8.4 Governance, Equity and Model Accountability
  9. 9 Market Segmentation Analysis |
    1. 9.1 By Model | |
      1. 9.1.1 Knowledge-Based CDSS | |
      2. 9.1.2 Non-Knowledge CDSS |
    2. 9.2 By Mode of Delivery | |
      1. 9.2.1 Cloud-Based | |
      2. 9.2.2 On-Premise |
    3. 9.3 By Component | |
      1. 9.3.1 Hardware | |
      2. 9.3.2 Software | |
      3. 9.3.3 Services |
    4. 9.4 By Product | |
      1. 9.4.1 Integrated CDSS | |
      2. 9.4.2 Standalone CDSS |
    5. 9.5 By Application | |
      1. 9.5.1 Medical Diagnosis | |
      2. 9.5.2 Alerts and Reminders | |
      3. 9.5.3 Drug Allergy Alerts | |
      4. 9.5.4 Clinical Reminders | |
      5. 9.5.5 Drug-Drug Interactions | |
      6. 9.5.6 Drug Dosing Support | |
      7. 9.5.7 Other Applications
  10. 10 Competitive Landscape |
    1. 10.1 Market Concentration Analysis |
    2. 10.2 Competitive Benchmarking Matrix |
    3. 10.3 Company Profiles | |
      1. 10.3.1 Epic Systems | |
      2. 10.3.2 Oracle Health (Cerner) | |
      3. 10.3.3 Wolters Kluwer Health | |
      4. 10.3.4 Elsevier | |
      5. 10.3.5 Merative | |
      6. 10.3.6 Veradigm | |
      7. 10.3.7 MEDITECH | |
      8. 10.3.8 Philips Healthcare | |
      9. 10.3.9 GE HealthCare | |
      10. 10.3.10 Siemens Healthineers | |
      11. 10.3.11 NextGen Healthcare | |
      12. 10.3.12 Zynx Health
  11. 11 Recent News & Developments
  12. 12 Report Scope & Methodology
  13. 13 Detailed Sources & Citations
  14. 14 Frequently Asked Questions
  15. 15 LIST OF TABLES |
  16. TABLE 1 Global Clinical Decision Support Systems Market Size & Forecast, by Revenue (USD Billion), 2021–2035 |
  17. TABLE 2 Global Clinical Decision Support Systems Market – Year-over-Year Growth Analysis, 2021–2035 |
  18. TABLE 3 Driver Impact Analysis Matrix, 2026–2035 |
  19. TABLE 4 Restraint Impact Analysis Matrix, 2026–2035 |
  20. TABLE 5 Global Market Size, by Region, 2021–2035 (USD Billion) |
  21. TABLE 6 North America Market Size, by Country, 2021–2035 (USD Billion) |
  22. TABLE 7 Europe Market Size, by Country, 2021–2035 (USD Billion) |
  23. TABLE 8 Asia-Pacific Market Size, by Country, 2021–2035 (USD Billion) |
  24. TABLE 9 South America Market Size, by Country, 2021–2035 (USD Billion) |
  25. TABLE 10 Middle East & Africa Market Size, by Country, 2021–2035 (USD Billion) |
  26. TABLE 11 Global Market Size, by Model, 2021–2035 (USD Billion) |
  27. TABLE 12 Global Market Size, by Mode of Delivery, 2021–2035 (USD Billion) |
  28. TABLE 13 Global Market Size, by Component, 2021–2035 (USD Billion) |
  29. TABLE 14 Global Market Size, by Product, 2021–2035 (USD Billion) |
  30. TABLE 15 Global Market Size, by Application, 2021–2035 (USD Billion) |
  31. TABLE 16 North America Market Size, by Model, 2021–2035 (USD Billion) |
  32. TABLE 17 North America Market Size, by Component, 2021–2035 (USD Billion) |
  33. TABLE 18 Europe Market Size, by Mode of Delivery, 2021–2035 (USD Billion) |
  34. TABLE 19 Europe Market Size, by Application, 2021–2035 (USD Billion) |
  35. TABLE 20 Asia-Pacific Market Size, by Component, 2021–2035 (USD Billion) |
  36. TABLE 21 Asia-Pacific Market Size, by Product, 2021–2035 (USD Billion) |
  37. TABLE 22 South America Market Size, by Application, 2021–2035 (USD Billion) |
  38. TABLE 23 Middle East & Africa Market Size, by Mode of Delivery, 2021–2035 (USD Billion) |
  39. TABLE 24 Competitive Benchmarking Matrix, 2026 |
  40. TABLE 25 Company Profiles – Key Players |
  41. TABLE 26 Recent Developments & Strategic Announcements, 2023–2025 |
  42. TABLE 27 Report Scope & Methodology Summary |
  43. TABLE 28 Detailed Sources & Citations Index
  44. 16 LIST OF FIGURES |
  45. FIGURE 1 Market Dynamics Overview – Drivers, Restraints and Opportunities |
  46. FIGURE 2 Industry Value Chain Analysis |
  47. FIGURE 3 Porter's Five Forces Analysis |
  48. FIGURE 4 Global Market Size Trend, 2021–2035 (USD Billion) |
  49. FIGURE 5 Year-over-Year Growth Trajectory, 2022–2035 |
  50. FIGURE 6 Market Share by Model, 2025 vs 2035 |
  51. FIGURE 7 Market Share by Mode of Delivery, 2025 vs 2035 |
  52. FIGURE 8 Market Share by Component, 2025 |
  53. FIGURE 9 Market Share by Product, 2025 |
  54. FIGURE 10 Market Share by Application, 2025 |
  55. FIGURE 11 Regional Market Share Distribution, 2025 |
  56. FIGURE 12 Regional CAGR Comparison, 2026–2035 |
  57. FIGURE 13 Country-Level Contribution within North America, 2025 |
  58. FIGURE 14 Country-Level Contribution within Asia-Pacific, 2025 |
  59. FIGURE 15 Competitive Landscape Positioning Map, 2026 |
  60. FIGURE 16 Vendor Revenue Share Distribution, 2026 |
  61. FIGURE 17 Technology Adoption Curve by Region, 2026–2035

Segmentation Quick Reference

DimensionSub-SegmentsDominant SegmentFastest Growing Segment
By ModelKnowledge-Based CDSS; Non-Knowledge CDSSKnowledge-Based CDSSNon-Knowledge CDSS
By Mode of DeliveryCloud-Based; On-PremiseOn-PremiseCloud-Based
By ComponentHardware; Software; ServicesSoftwareServices
By ProductIntegrated CDSS; Standalone CDSSIntegrated CDSSStandalone CDSS
By ApplicationMedical Diagnosis; Alerts and Reminders; Drug Allergy Alerts; Clinical Reminders; Drug-Drug Interactions; Drug Dosing Support; Other ApplicationsMedical DiagnosisDrug-Drug Interactions
By GeographyNorth America; Europe; Asia-Pacific; South America; Middle East & AfricaNorth AmericaAsia-Pacific


Market Segmentation Overview

By Model

Sub-SegmentKey Trend
Knowledge-Based CDSSCurated rule libraries retain preference where audit trails and guideline traceability are contractually required
Non-Knowledge CDSSStatistical inference expands into deterioration prediction, imaging triage and free-text signal extraction


Buyers rarely choose between the two. The prevailing architecture pairs statistical candidate generation with a deterministic safety layer, giving clinicians both sensitivity and a defensible explanation when a recommendation is questioned.

By Mode of Delivery

Sub-SegmentKey Trend
Cloud-BasedSubscription licensing shifts spend from capital to operating budgets and shortens content refresh cycles
On-PremiseData residency statutes and latency-sensitive acute-care use cases sustain local deployment


Hybrid configurations are winning tenders in jurisdictions with strict residency rules — inference stays local while evidence content streams from cloud repositories, satisfying compliance without sacrificing currency.

By Component

Sub-SegmentKey Trend
HardwareEdge inference appliances and bedside display infrastructure remain a modest but stable line item
SoftwareCore advisory engines and licensed evidence libraries carry the majority of contract value
ServicesImplementation, alert tuning and ongoing model governance emerge as durable recurring revenue


Services deserve more analyst attention than they receive. Vendors increasingly discount software to secure the account, then recover margin through multi-year governance retainers that health systems find operationally impossible to cancel.

By Product

Sub-SegmentKey Trend
Integrated CDSSBundling inside the record platform reduces interface count and total cost of ownership
Standalone CDSSSpecialty depth in oncology, transplant and rare disease sustains independent demand


Integration wins on procurement economics; standalone wins on clinical depth. The equilibrium holds because record vendors cannot economically curate every specialty guideline set.

By Application

Sub-SegmentKey Trend
Medical DiagnosisImaging triage and differential narrowing attract the largest share of new deployment budget
Alerts and RemindersPreventive care gap closure ties directly to quality-linked payment scores
Drug Allergy AlertsSeverity tiering reduces override rates and restores clinician trust
Clinical RemindersChronic disease protocol adherence drives ambulatory adoption
Drug-Drug InteractionsAging populations and polypharmacy expand the interaction surface combinatorially
Drug Dosing SupportRenal, hepatic and pediatric adjustment logic becomes a pharmacy department requirement
Other ApplicationsDocumentation assistance and coding support ride ambient capture adoption


Application-level demand concentrates where error is most costly and most measurable. Diagnosis and medication safety together account for the majority of new contract value, while documentation-adjacent uses grow from a smaller base as ambient tooling matures.

By Geography

Sub-SegmentKey Trend
North AmericaQuality-linked payment and enforcement penalties sustain the largest regional base
EuropeHealth data space compliance and national digitization funds drive coordinated procurement
Asia-PacificNational digital health missions and cloud-first builds deliver the fastest growth
South AmericaPrivate supplementary health operators lead adoption ahead of public systems
Middle East & AfricaSovereign transformation programs specify fully digital greenfield hospitals


Regional divergence is less about willingness to adopt than about whether payment policy rewards documented decision quality. Where it does, adoption compounds; where it does not, deployment stalls at pilot scale regardless of clinical enthusiasm.

Opus 5 High

Download PDF ×

We do not share your information with anyone. However, we may send you emails based on your report interest from time to time. You may contact us at any time to opt-out.