Segmentation Quick Reference
| Dimension | Sub-Segments | Dominant Segment | Fastest Growing Segment |
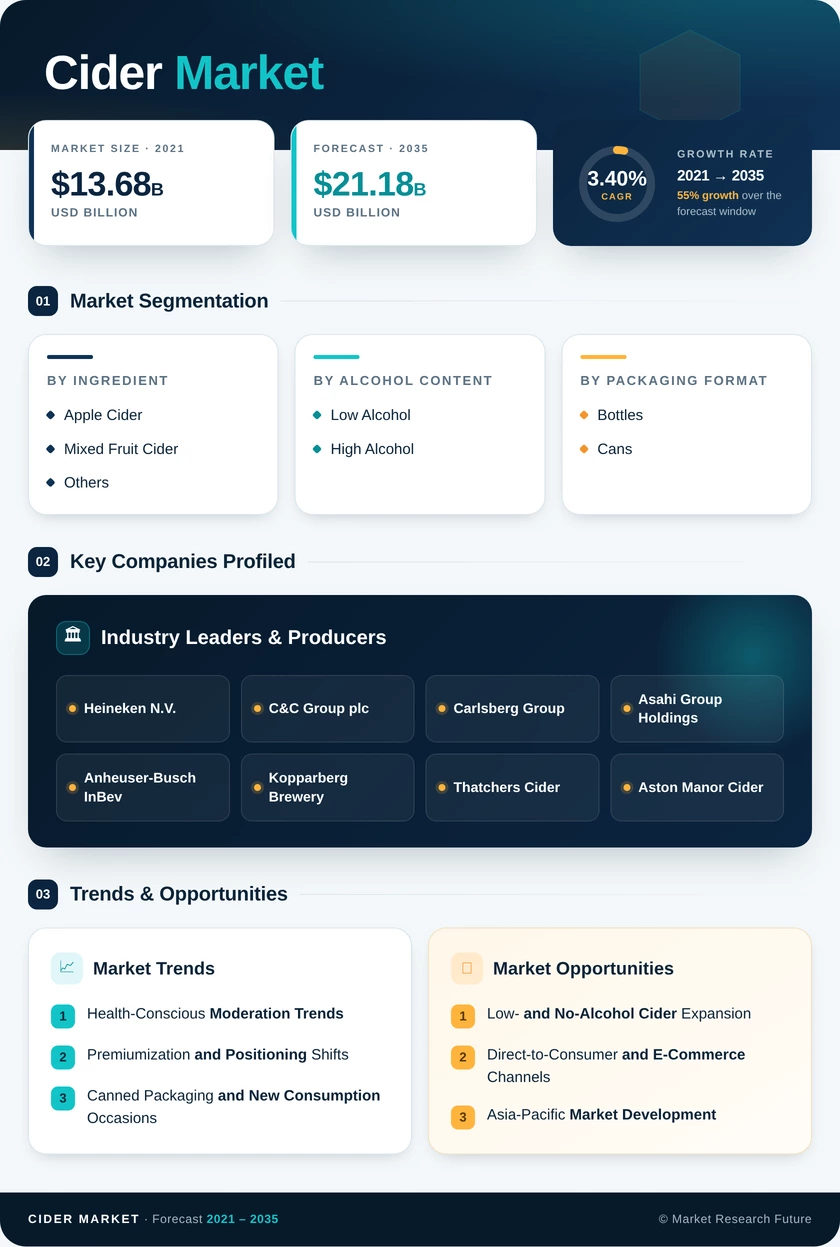
| Ingredient | Apple Cider, Mixed Fruit Cider, Others | Apple Cider (56.4% share, 2025) | Mixed Fruit Cider (3.66% CAGR) |
| Alcohol Content | Low Alcohol, High Alcohol | Low Alcohol (72.6% share, 2025) | High Alcohol (3.91% CAGR) |
| Packaging Format | Bottles, Cans | Bottles (55.8% share, 2025) | Cans (4.14% CAGR) |
| Category | Mass, Premium | Mass (66.9% share, 2025) | Premium (4.37% CAGR) |
| Distribution Channel | Off-Trade, On-Trade | Off-Trade (60.5% share, 2025) | On-Trade (3.45% CAGR) |
| Geography | North America, Europe, Asia-Pacific, South America, Middle East & Africa | Europe (46.1% share, 2025) | Asia-Pacific (4.80% CAGR) |
Market Segmentation Overview
By Ingredient
| Sub-Segment | Key Trend |
| Apple Cider | Stable majority segment; single-varietal and heritage-orchard positioning gaining premium traction |
| Mixed Fruit Cider | Fastest-growing ingredient segment driven by tropical and berry flavor innovation targeting younger consumers |
| Others (Pear, Berry) | Niche premium category expanding through seasonal and limited-edition releases |
Apple-based formulations underpin the global cider category, backed by established agricultural supply chains and broad consumer recognition. Mixed fruit variants are experiencing outsized growth as producers introduce tropical, citrus, and berry-forward blends that resonate with flavor-curious demographics in Asia-Pacific and North America.
By Alcohol Content
| Sub-Segment | Key Trend |
| Low Alcohol (≤6% ABV) | Dominant segment benefiting from global moderation campaigns and session-drinking culture |
| High Alcohol (>6% ABV) | Expanding through artisanal ice cider, barrel-aged releases, and premium small-batch expressions |
Low-alcohol cider benefits from structural alignment with health-conscious consumption trends and regulatory moderation incentives. High-alcohol variants occupy a specialized niche valued for complexity and premium positioning.
By Packaging Format
| Sub-Segment | Key Trend |
| Bottles | Retains majority revenue share anchored in on-trade draught and premium glass formats |
| Cans | Fastest-growing format driven by portability, sustainability credentials, and single-serve convenience |
Bottles maintain their leadership through association with on-premise draught service and premium glass presentation. Cans are gaining share rapidly as sustainability mandates and outdoor consumption occasions favor lightweight, recyclable aluminum.
By Category
| Sub-Segment | Key Trend |
| Mass | Largest segment with broad supermarket and off-trade distribution reach |
| Premium | Fastest-growing category as consumers trade up toward provenance-led, limited-release offerings |
Mass-market products deliver volume through wide availability and competitive pricing. Premium cider is the growth engine of the category as consumers increasingly prioritize quality, brand narrative, and ingredient transparency.
By Distribution Channel
| Sub-Segment | Key Trend |
| Off-Trade | Dominant channel encompassing supermarkets, liquor stores, and growing e-commerce platforms |
| On-Trade | Recovering and growing post-pandemic through experiential consumption in pubs, bars, and restaurants |
Off-trade channels drive the majority of sales volume through established retail infrastructure. On-trade is the faster-growing channel as post-pandemic hospitality recovery and experiential dining trends boost draught and premium cider programs.