China Smart Watch Market

ID: MRFR/SEM/45192-HCR
200 Pages
Ankit Gupta
Last Updated: April 06, 2026
China Smart Watch Market Size, Share and Research Report By Gender (Men, Women, Unisex), By Display (Analogue, Digital, Analogue-Digital), By Display Type (LCD, LED, AMOLED, OLED), By Operating System (iOS, Android, Tizen, FreeRTOS, Others) and By Application (Personal Assistance, Wellness, Healthcare, Sports, Others) - Industry Forecast Till 2035
Download PDF ×

We do not share your information with anyone. However, we may send you emails based on your report interest from time to time. You may contact us at any time to opt-out.

China Smart Watch Market

Market Size

Forecast Period2025 - 2035
CAGR (2025 - 2035)7.95%
2024 Market Size$ 6,408.99 Billion
2025 Market Size$ 6,918.5 Billion
2035 Market Size$ 14,866.84 Billion

Key Players

Apple
Samsung
Garmin
Fitbit
Fossil
Huawei
Opportunities
  • Integration with Smart Home Ecosystems
  • Youth Demographic Driving Market Growth
  • Rising Health Consciousness Among Consumers
  1. 1 SECTION I: EXECUTIVE SUMMARY AND KEY HIGHLIGHTS
    1. 1.1 EXECUTIVE SUMMARY
      1. 1.1.1 Market Overview
      2. 1.1.2 Key Findings
      3. 1.1.3 Market Segmentation
      4. 1.1.4 Competitive Landscape
      5. 1.1.5 Challenges and Opportunities
      6. 1.1.6 Future Outlook
  2. 2 SECTION II: SCOPING, METHODOLOGY AND MARKET STRUCTURE
    1. 2.1 MARKET INTRODUCTION
      1. 2.1.1 Definition
      2. 2.1.2 Scope of the study
        1. 2.1.2.1 Research Objective
        2. 2.1.2.2 Assumption
        3. 2.1.2.3 Limitations
    2. 2.2 RESEARCH METHODOLOGY
      1. 2.2.1 Overview
      2. 2.2.2 Data Mining
      3. 2.2.3 Secondary Research
      4. 2.2.4 Primary Research
        1. 2.2.4.1 Primary Interviews and Information Gathering Process
        2. 2.2.4.2 Breakdown of Primary Respondents
      5. 2.2.5 Forecasting Model
      6. 2.2.6 Market Size Estimation
        1. 2.2.6.1 Bottom-Up Approach
        2. 2.2.6.2 Top-Down Approach
      7. 2.2.7 Data Triangulation
      8. 2.2.8 Validation
  3. 3 SECTION III: QUALITATIVE ANALYSIS
    1. 3.1 MARKET DYNAMICS
      1. 3.1.1 Overview
      2. 3.1.2 Drivers
      3. 3.1.3 Restraints
      4. 3.1.4 Opportunities
    2. 3.2 MARKET FACTOR ANALYSIS
      1. 3.2.1 Value chain Analysis
      2. 3.2.2 Porter's Five Forces Analysis
        1. 3.2.2.1 Bargaining Power of Suppliers
        2. 3.2.2.2 Bargaining Power of Buyers
        3. 3.2.2.3 Threat of New Entrants
        4. 3.2.2.4 Threat of Substitutes
        5. 3.2.2.5 Intensity of Rivalry
      3. 3.2.3 COVID-19 Impact Analysis
        1. 3.2.3.1 Market Impact Analysis
        2. 3.2.3.2 Regional Impact
        3. 3.2.3.3 Opportunity and Threat Analysis
  4. 4 SECTION IV: QUANTITATIVE ANALYSIS
    1. 4.1 Semiconductor & Electronics, BY Gender (USD Billion)
      1. 4.1.1 Men
      2. 4.1.2 Women
      3. 4.1.3 Unisex
    2. 4.2 Semiconductor & Electronics, BY Display (USD Billion)
      1. 4.2.1 Analogue
      2. 4.2.2 Digital
      3. 4.2.3 Analogue-Digital
    3. 4.3 Semiconductor & Electronics, BY Display Type (USD Billion)
      1. 4.3.1 LCD
      2. 4.3.2 LED
      3. 4.3.3 AMOLED
      4. 4.3.4 OLED
    4. 4.4 Semiconductor & Electronics, BY Operating System (USD Billion)
      1. 4.4.1 iOS
      2. 4.4.2 Android
      3. 4.4.3 Tizen
      4. 4.4.4 FreeRTOS
      5. 4.4.5 Others
    5. 4.5 Semiconductor & Electronics, BY Application (USD Billion)
      1. 4.5.1 Personal Assistance
      2. 4.5.2 Wellness
      3. 4.5.3 Healthcare
      4. 4.5.4 Sports
      5. 4.5.5 Others
  5. 5 SECTION V: COMPETITIVE ANALYSIS
    1. 5.1 Competitive Landscape
      1. 5.1.1 Overview
      2. 5.1.2 Competitive Analysis
      3. 5.1.3 Market share Analysis
      4. 5.1.4 Major Growth Strategy in the Semiconductor & Electronics
      5. 5.1.5 Competitive Benchmarking
      6. 5.1.6 Leading Players in Terms of Number of Developments in the Semiconductor & Electronics
      7. 5.1.7 Key developments and growth strategies
        1. 5.1.7.1 New Product Launch/Service Deployment
        2. 5.1.7.2 Merger & Acquisitions
        3. 5.1.7.3 Joint Ventures
      8. 5.1.8 Major Players Financial Matrix
        1. 5.1.8.1 Sales and Operating Income
        2. 5.1.8.2 Major Players R&D Expenditure. 2023
    2. 5.2 Company Profiles
      1. 5.2.1 Apple (US)
        1. 5.2.1.1 Financial Overview
        2. 5.2.1.2 Products Offered
        3. 5.2.1.3 Key Developments
        4. 5.2.1.4 SWOT Analysis
        5. 5.2.1.5 Key Strategies
      2. 5.2.2 Samsung (KR)
        1. 5.2.2.1 Financial Overview
        2. 5.2.2.2 Products Offered
        3. 5.2.2.3 Key Developments
        4. 5.2.2.4 SWOT Analysis
        5. 5.2.2.5 Key Strategies
      3. 5.2.3 Garmin (US)
        1. 5.2.3.1 Financial Overview
        2. 5.2.3.2 Products Offered
        3. 5.2.3.3 Key Developments
        4. 5.2.3.4 SWOT Analysis
        5. 5.2.3.5 Key Strategies
      4. 5.2.4 Fitbit (US)
        1. 5.2.4.1 Financial Overview
        2. 5.2.4.2 Products Offered
        3. 5.2.4.3 Key Developments
        4. 5.2.4.4 SWOT Analysis
        5. 5.2.4.5 Key Strategies
      5. 5.2.5 Fossil (US)
        1. 5.2.5.1 Financial Overview
        2. 5.2.5.2 Products Offered
        3. 5.2.5.3 Key Developments
        4. 5.2.5.4 SWOT Analysis
        5. 5.2.5.5 Key Strategies
      6. 5.2.6 Huawei (CN)
        1. 5.2.6.1 Financial Overview
        2. 5.2.6.2 Products Offered
        3. 5.2.6.3 Key Developments
        4. 5.2.6.4 SWOT Analysis
        5. 5.2.6.5 Key Strategies
      7. 5.2.7 Xiaomi (CN)
        1. 5.2.7.1 Financial Overview
        2. 5.2.7.2 Products Offered
        3. 5.2.7.3 Key Developments
        4. 5.2.7.4 SWOT Analysis
        5. 5.2.7.5 Key Strategies
      8. 5.2.8 Suunto (FI)
        1. 5.2.8.1 Financial Overview
        2. 5.2.8.2 Products Offered
        3. 5.2.8.3 Key Developments
        4. 5.2.8.4 SWOT Analysis
        5. 5.2.8.5 Key Strategies
      9. 5.2.9 Withings (FR)
        1. 5.2.9.1 Financial Overview
        2. 5.2.9.2 Products Offered
        3. 5.2.9.3 Key Developments
        4. 5.2.9.4 SWOT Analysis
        5. 5.2.9.5 Key Strategies
    3. 5.3 Appendix
      1. 5.3.1 References
      2. 5.3.2 Related Reports
  6. 6 LIST OF FIGURES
    1. 6.1 MARKET SYNOPSIS
    2. 6.2 CHINA MARKET ANALYSIS BY GENDER
    3. 6.3 CHINA MARKET ANALYSIS BY DISPLAY
    4. 6.4 CHINA MARKET ANALYSIS BY DISPLAY TYPE
    5. 6.5 CHINA MARKET ANALYSIS BY OPERATING SYSTEM
    6. 6.6 CHINA MARKET ANALYSIS BY APPLICATION
    7. 6.7 KEY BUYING CRITERIA OF SEMICONDUCTOR & ELECTRONICS
    8. 6.8 RESEARCH PROCESS OF MRFR
    9. 6.9 DRO ANALYSIS OF SEMICONDUCTOR & ELECTRONICS
    10. 6.10 DRIVERS IMPACT ANALYSIS: SEMICONDUCTOR & ELECTRONICS
    11. 6.11 RESTRAINTS IMPACT ANALYSIS: SEMICONDUCTOR & ELECTRONICS
    12. 6.12 SUPPLY / VALUE CHAIN: SEMICONDUCTOR & ELECTRONICS
    13. 6.13 SEMICONDUCTOR & ELECTRONICS, BY GENDER, 2024 (% SHARE)
    14. 6.14 SEMICONDUCTOR & ELECTRONICS, BY GENDER, 2024 TO 2035 (USD Billion)
    15. 6.15 SEMICONDUCTOR & ELECTRONICS, BY DISPLAY, 2024 (% SHARE)
    16. 6.16 SEMICONDUCTOR & ELECTRONICS, BY DISPLAY, 2024 TO 2035 (USD Billion)
    17. 6.17 SEMICONDUCTOR & ELECTRONICS, BY DISPLAY TYPE, 2024 (% SHARE)
    18. 6.18 SEMICONDUCTOR & ELECTRONICS, BY DISPLAY TYPE, 2024 TO 2035 (USD Billion)
    19. 6.19 SEMICONDUCTOR & ELECTRONICS, BY OPERATING SYSTEM, 2024 (% SHARE)
    20. 6.20 SEMICONDUCTOR & ELECTRONICS, BY OPERATING SYSTEM, 2024 TO 2035 (USD Billion)
    21. 6.21 SEMICONDUCTOR & ELECTRONICS, BY APPLICATION, 2024 (% SHARE)
    22. 6.22 SEMICONDUCTOR & ELECTRONICS, BY APPLICATION, 2024 TO 2035 (USD Billion)
    23. 6.23 BENCHMARKING OF MAJOR COMPETITORS
  7. 7 LIST OF TABLES
    1. 7.1 LIST OF ASSUMPTIONS
  8. 7.1.1
    1. 7.2 China MARKET SIZE ESTIMATES; FORECAST
      1. 7.2.1 BY GENDER, 2025-2035 (USD Billion)
      2. 7.2.2 BY DISPLAY, 2025-2035 (USD Billion)
      3. 7.2.3 BY DISPLAY TYPE, 2025-2035 (USD Billion)
      4. 7.2.4 BY OPERATING SYSTEM, 2025-2035 (USD Billion)
      5. 7.2.5 BY APPLICATION, 2025-2035 (USD Billion)
    2. 7.3 PRODUCT LAUNCH/PRODUCT DEVELOPMENT/APPROVAL
  9. 7.3.1
    1. 7.4 ACQUISITION/PARTNERSHIP
  10. 7.4.1

China China Smart Watch Market Segmentation

China Smart Watch Market By Gender (USD Billion, 2025-2035)
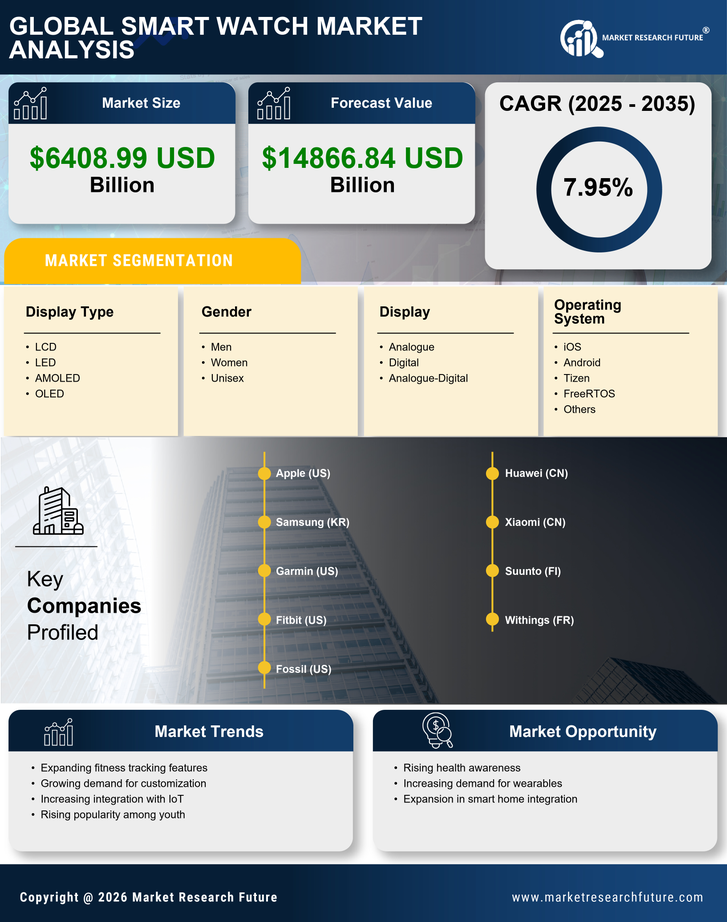
  • Men
  • Women
  • Unisex

China Smart Watch Market By Display (USD Billion, 2025-2035)

  • Analogue
  • Digital
  • Analogue-Digital

China Smart Watch Market By Display Type (USD Billion, 2025-2035)

  • LCD
  • LED
  • AMOLED
  • OLED

China Smart Watch Market By Operating System (USD Billion, 2025-2035)

  • iOS
  • Android
  • Tizen
  • FreeRTOS
  • Others

China Smart Watch Market By Application (USD Billion, 2025-2035)

  • Personal Assistance
  • Wellness
  • Healthcare
  • Sports
  • Others