Request Free Sample ×

Kindly complete the form below to receive a free sample of this Report

* Please use a valid business email

Leading companies partner with us for data-driven Insights

clients tt-cursor
Hero Background

China Sensor Market

ID: MRFR/SEM/53334-HCR
200 Pages
Aarti Dhapte
Last Updated: February 06, 2026

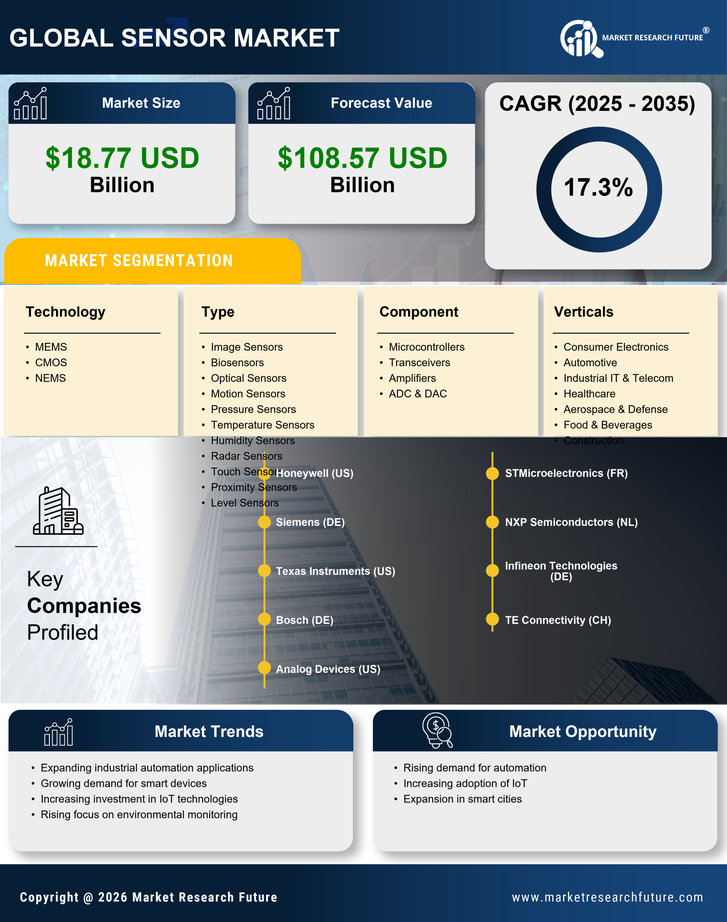
China Sensor Market Size, Share and Research Report By Type (Image Sensors, Biosensors, Optical Sensors, Motion Sensors, Pressure Sensors, Temperature Sensors, Humidity Sensors, Radar Sensors, Touch Sensors, Others), By Component (Microcontrollers, Transceivers, Amplifiers, ADC & DAC), By Technology (MEMS, CMOS, NEMS) and By Verticals (Consumer Electronics, Automotive, Industrial IT & Telecom, Healthcare, Aerospace & Defense, Others)-Forecast to 2035

Share:
Download PDF ×

We do not share your information with anyone. However, we may send you emails based on your report interest from time to time. You may contact us at any time to opt-out.

China Sensor Market Infographic
Purchase Options
  1. 1 SECTION I: EXECUTIVE SUMMARY AND KEY HIGHLIGHTS
  2.   1.1 EXECUTIVE SUMMARY
  3.     1.1.1 Market Overview
  4.     1.1.2 Key Findings
  5.     1.1.3 Market Segmentation
  6.     1.1.4 Competitive Landscape
  7.     1.1.5 Challenges and Opportunities
  8.     1.1.6 Future Outlook
  9. 2 SECTION II: SCOPING, METHODOLOGY AND MARKET STRUCTURE
  10.   2.1 MARKET INTRODUCTION
  11.     2.1.1 Definition
  12.     2.1.2 Scope of the study
  13.       2.1.2.1 Research Objective
  14.       2.1.2.2 Assumption
  15.       2.1.2.3 Limitations
  16.   2.2 RESEARCH METHODOLOGY
  17.     2.2.1 Overview
  18.     2.2.2 Data Mining
  19.     2.2.3 Secondary Research
  20.     2.2.4 Primary Research
  21.       2.2.4.1 Primary Interviews and Information Gathering Process
  22.       2.2.4.2 Breakdown of Primary Respondents
  23.     2.2.5 Forecasting Model
  24.     2.2.6 Market Size Estimation
  25.       2.2.6.1 Bottom-Up Approach
  26.       2.2.6.2 Top-Down Approach
  27.     2.2.7 Data Triangulation
  28.     2.2.8 Validation
  29. 3 SECTION III: QUALITATIVE ANALYSIS
  30.   3.1 MARKET DYNAMICS
  31.     3.1.1 Overview
  32.     3.1.2 Drivers
  33.     3.1.3 Restraints
  34.     3.1.4 Opportunities
  35.   3.2 MARKET FACTOR ANALYSIS
  36.     3.2.1 Value chain Analysis
  37.     3.2.2 Porter's Five Forces Analysis
  38.       3.2.2.1 Bargaining Power of Suppliers
  39.       3.2.2.2 Bargaining Power of Buyers
  40.       3.2.2.3 Threat of New Entrants
  41.       3.2.2.4 Threat of Substitutes
  42.       3.2.2.5 Intensity of Rivalry
  43.     3.2.3 COVID-19 Impact Analysis
  44.       3.2.3.1 Market Impact Analysis
  45.       3.2.3.2 Regional Impact
  46.       3.2.3.3 Opportunity and Threat Analysis
  47. 4 SECTION IV: QUANTITATIVE ANALYSIS
  48.   4.1 Semiconductor & Electronics, BY Type (USD Billion)
  49.     4.1.1 Image Sensors
  50.     4.1.2 Biosensors
  51.     4.1.3 Optical Sensors
  52.     4.1.4 Motion Sensors
  53.     4.1.5 Pressure Sensors
  54.     4.1.6 Temperature Sensors
  55.     4.1.7 Humidity Sensors
  56.     4.1.8 Radar Sensors
  57.     4.1.9 Touch Sensors
  58.     4.1.10 Proximity Sensors
  59.     4.1.11 Level Sensors
  60.   4.2 Semiconductor & Electronics, BY Component (USD Billion)
  61.     4.2.1 Microcontrollers
  62.     4.2.2 Transceivers
  63.     4.2.3 Amplifiers
  64.     4.2.4 ADC & DAC
  65.   4.3 Semiconductor & Electronics, BY Technology (USD Billion)
  66.     4.3.1 MEMS
  67.     4.3.2 CMOS
  68.     4.3.3 NEMS
  69.   4.4 Semiconductor & Electronics, BY Verticals (USD Billion)
  70.     4.4.1 Consumer Electronics
  71.     4.4.2 Automotive
  72.     4.4.3 Industrial IT & Telecom
  73.     4.4.4 Healthcare
  74.     4.4.5 Aerospace & Defense
  75.     4.4.6 Food & Beverages
  76.     4.4.7 Construction
  77. 5 SECTION V: COMPETITIVE ANALYSIS
  78.   5.1 Competitive Landscape
  79.     5.1.1 Overview
  80.     5.1.2 Competitive Analysis
  81.     5.1.3 Market share Analysis
  82.     5.1.4 Major Growth Strategy in the Semiconductor & Electronics
  83.     5.1.5 Competitive Benchmarking
  84.     5.1.6 Leading Players in Terms of Number of Developments in the Semiconductor & Electronics
  85.     5.1.7 Key developments and growth strategies
  86.       5.1.7.1 New Product Launch/Service Deployment
  87.       5.1.7.2 Merger & Acquisitions
  88.       5.1.7.3 Joint Ventures
  89.     5.1.8 Major Players Financial Matrix
  90.       5.1.8.1 Sales and Operating Income
  91.       5.1.8.2 Major Players R&D Expenditure. 2023
  92.   5.2 Company Profiles
  93.     5.2.1 Honeywell (US)
  94.       5.2.1.1 Financial Overview
  95.       5.2.1.2 Products Offered
  96.       5.2.1.3 Key Developments
  97.       5.2.1.4 SWOT Analysis
  98.       5.2.1.5 Key Strategies
  99.     5.2.2 Siemens (DE)
  100.       5.2.2.1 Financial Overview
  101.       5.2.2.2 Products Offered
  102.       5.2.2.3 Key Developments
  103.       5.2.2.4 SWOT Analysis
  104.       5.2.2.5 Key Strategies
  105.     5.2.3 Texas Instruments (US)
  106.       5.2.3.1 Financial Overview
  107.       5.2.3.2 Products Offered
  108.       5.2.3.3 Key Developments
  109.       5.2.3.4 SWOT Analysis
  110.       5.2.3.5 Key Strategies
  111.     5.2.4 Bosch (DE)
  112.       5.2.4.1 Financial Overview
  113.       5.2.4.2 Products Offered
  114.       5.2.4.3 Key Developments
  115.       5.2.4.4 SWOT Analysis
  116.       5.2.4.5 Key Strategies
  117.     5.2.5 Analog Devices (US)
  118.       5.2.5.1 Financial Overview
  119.       5.2.5.2 Products Offered
  120.       5.2.5.3 Key Developments
  121.       5.2.5.4 SWOT Analysis
  122.       5.2.5.5 Key Strategies
  123.     5.2.6 STMicroelectronics (FR)
  124.       5.2.6.1 Financial Overview
  125.       5.2.6.2 Products Offered
  126.       5.2.6.3 Key Developments
  127.       5.2.6.4 SWOT Analysis
  128.       5.2.6.5 Key Strategies
  129.     5.2.7 NXP Semiconductors (NL)
  130.       5.2.7.1 Financial Overview
  131.       5.2.7.2 Products Offered
  132.       5.2.7.3 Key Developments
  133.       5.2.7.4 SWOT Analysis
  134.       5.2.7.5 Key Strategies
  135.     5.2.8 Infineon Technologies (DE)
  136.       5.2.8.1 Financial Overview
  137.       5.2.8.2 Products Offered
  138.       5.2.8.3 Key Developments
  139.       5.2.8.4 SWOT Analysis
  140.       5.2.8.5 Key Strategies
  141.     5.2.9 TE Connectivity (CH)
  142.       5.2.9.1 Financial Overview
  143.       5.2.9.2 Products Offered
  144.       5.2.9.3 Key Developments
  145.       5.2.9.4 SWOT Analysis
  146.       5.2.9.5 Key Strategies
  147.   5.3 Appendix
  148.     5.3.1 References
  149.     5.3.2 Related Reports
  150. 6 LIST OF FIGURES
  151.   6.1 MARKET SYNOPSIS
  152.   6.2 CHINA MARKET ANALYSIS BY TYPE
  153.   6.3 CHINA MARKET ANALYSIS BY COMPONENT
  154.   6.4 CHINA MARKET ANALYSIS BY TECHNOLOGY
  155.   6.5 CHINA MARKET ANALYSIS BY VERTICALS
  156.   6.6 KEY BUYING CRITERIA OF SEMICONDUCTOR & ELECTRONICS
  157.   6.7 RESEARCH PROCESS OF MRFR
  158.   6.8 DRO ANALYSIS OF SEMICONDUCTOR & ELECTRONICS
  159.   6.9 DRIVERS IMPACT ANALYSIS: SEMICONDUCTOR & ELECTRONICS
  160.   6.10 RESTRAINTS IMPACT ANALYSIS: SEMICONDUCTOR & ELECTRONICS
  161.   6.11 SUPPLY / VALUE CHAIN: SEMICONDUCTOR & ELECTRONICS
  162.   6.12 SEMICONDUCTOR & ELECTRONICS, BY TYPE, 2024 (% SHARE)
  163.   6.13 SEMICONDUCTOR & ELECTRONICS, BY TYPE, 2024 TO 2035 (USD Billion)
  164.   6.14 SEMICONDUCTOR & ELECTRONICS, BY COMPONENT, 2024 (% SHARE)
  165.   6.15 SEMICONDUCTOR & ELECTRONICS, BY COMPONENT, 2024 TO 2035 (USD Billion)
  166.   6.16 SEMICONDUCTOR & ELECTRONICS, BY TECHNOLOGY, 2024 (% SHARE)
  167.   6.17 SEMICONDUCTOR & ELECTRONICS, BY TECHNOLOGY, 2024 TO 2035 (USD Billion)
  168.   6.18 SEMICONDUCTOR & ELECTRONICS, BY VERTICALS, 2024 (% SHARE)
  169.   6.19 SEMICONDUCTOR & ELECTRONICS, BY VERTICALS, 2024 TO 2035 (USD Billion)
  170.   6.20 BENCHMARKING OF MAJOR COMPETITORS
  171. 7 LIST OF TABLES
  172.   7.1 LIST OF ASSUMPTIONS
  173.     7.1.1
  174.   7.2 China MARKET SIZE ESTIMATES; FORECAST
  175.     7.2.1 BY TYPE, 2025-2035 (USD Billion)
  176.     7.2.2 BY COMPONENT, 2025-2035 (USD Billion)
  177.     7.2.3 BY TECHNOLOGY, 2025-2035 (USD Billion)
  178.     7.2.4 BY VERTICALS, 2025-2035 (USD Billion)
  179.   7.3 PRODUCT LAUNCH/PRODUCT DEVELOPMENT/APPROVAL
  180.     7.3.1
  181.   7.4 ACQUISITION/PARTNERSHIP
  182.     7.4.1

China Semiconductor & Electronics Market Segmentation

Semiconductor & Electronics By Type (USD Billion, 2025-2035)

  • Image Sensors
  • Biosensors
  • Optical Sensors
  • Motion Sensors
  • Pressure Sensors
  • Temperature Sensors
  • Humidity Sensors
  • Radar Sensors
  • Touch Sensors
  • Proximity Sensors
  • Level Sensors

Semiconductor & Electronics By Component (USD Billion, 2025-2035)

  • Microcontrollers
  • Transceivers
  • Amplifiers
  • ADC & DAC

Semiconductor & Electronics By Technology (USD Billion, 2025-2035)

  • MEMS
  • CMOS
  • NEMS

Semiconductor & Electronics By Verticals (USD Billion, 2025-2035)

  • Consumer Electronics
  • Automotive
  • Industrial IT & Telecom
  • Healthcare
  • Aerospace & Defense
  • Food & Beverages
  • Construction

Compare Licence

×
Features License Type
Single User Multiuser License Enterprise User
Price $4,950 $5,950 $7,250
Maximum User Access Limit 1 User Upto 10 Users Unrestricted Access Throughout the Organization
Free Customization
Direct Access to Analyst
Deliverable Format
Platform Access
Discount on Next Purchase 10% 15% 15%
Printable Versions