ID: MRFR/Pharma/4024-HCR | February 2021 | Region: Global | 90 pages
Market Scenario:
Cheilectomy is a surgical procedure aimed to remove the bony lump present on the top of the metatarsophalangeal joint (big toe). Hallux rigidus, a type of big toe arthritis is a major cause of the same. According to a study published in the World Journal of Orthopedics in 2017, hallux rigidus is a degenerative disease of the first MTP joint. Moreover, it is estimated that the disease affects 1 in every 40 people, aged 50 or more. Females are greatly affected by the disease as compared to males, .i.e., by a ratio of 2:1. Therefore, increasing prevalence of hallux rigidus and growing female population are the major drivers for the market growth during the forecast period. Additionally, increasing demands for minimally invasive procedures and rising healthcare expenditure is estimated to fuel the market. According to the World Health Organization, the geriatric population is projected to grow from an estimated 524 million in 2010 to approximately 1.5 billion by 2050. However, high procedural cost followed by complications like deep vein thrombosis, need for repeated surgery, stiffness in the joints of the toes and low per capita healthcare expenditure in the middle and low-income countries is estimated to restrain the market growth during the projected period. According to the Fairfield Independent Hospital, the procedural cost for the same in 2016 was estimated to be around USD 3,545.
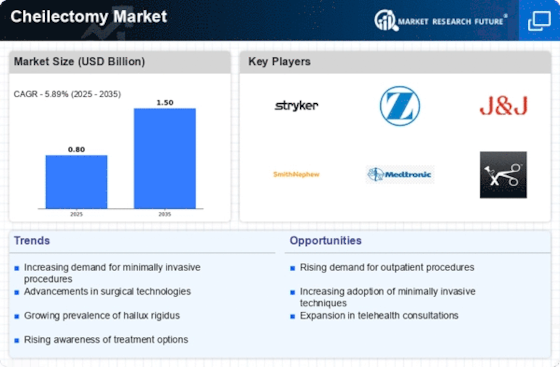
The global cheilectomy market is expected to grow at a CAGR of 7.8% during the forecast period.
Intended Audience
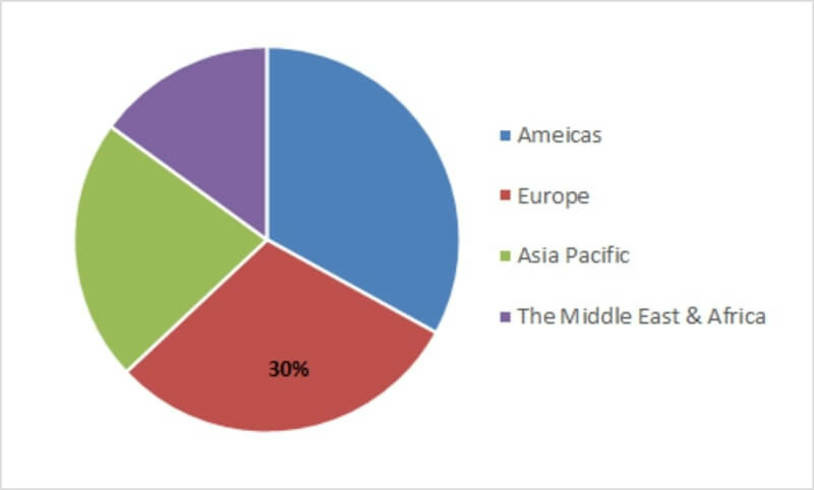
Figure 1:- Global Cheilectomy Market Share, by Region
Sources: WHO, annual reports, press release, white paper, and company presentation
Segmentation:
The global cheilectomy market is segmented by the method, anesthesia, medication, and end-user.
By the method, the market is segmented into open, arthroscopic, and percutaneous method.
By the anesthesia, the market is categorized into general anesthesia, local anesthesia, and regional anesthesia. By the medication, the market is segmented into prescription pain relievers, OCT, and others. By prescription the pain relievers the market is segmented into corticosteroids, opioids, nonsteroidal anti-inflammatory drugs (NSAIDs), and others. By the OCT drugs, the market is segmented into ibuprofen, naproxen, and others. By end users, the market is segmented into hospitals & clinics, academic institutes, retail pharmacies, and others.
Regional Analysis:
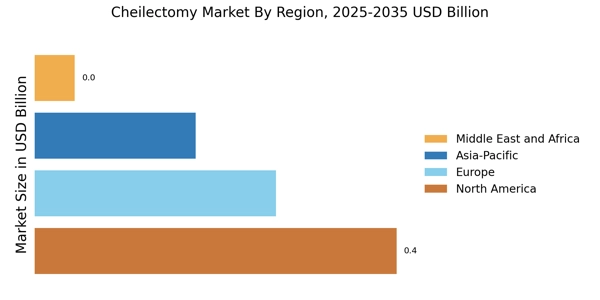
The Americas dominate the global cheilectomy market owing to a well-developed healthcare sector and increasing the prevalence of hallux rigidus. Moreover, increasing healthcare expenditure and presence of the key players within the regions boosts the growth of the market in the Americas. Additionally, increasing geriatric population and growing female population fuels the regional market growth.
Europe is the second largest cheilectomy market, which is followed by Asia Pacific. Osteoarthritis is a common condition that may lead to hallux rigidus. Thus, increasing prevalence of the disease within the region drives the market growth. According to the Arthritis Research U.K in 2013, osteoarthritis was estimated to be the most common musculoskeletal condition in the geriatric population. Additionally, it was estimated that approximately, 8.75 million people within the region had sought some treatment for osteoarthritis.
Asia Pacific is the fastest growing region for the market due to the presence of a huge patient population, continuously developing economies like India & China, and presence of huge opportunity in the market.
On the other hand, the Middle East & Africa has the least share in the global cheilectomy market due to the presence of poor economy, especially in the Africa region. Majority of the market of this region is held by the Middle East due to a well-developed healthcare sector and huge healthcare expenditure.
Research Methodology
Sources: WHO, annual reports, press release, white paper, and company presentation
Key players in global cheilectomy market
The key players for the global cheilectomy market are Henry Schein, Inc. (U.S.), STEROID S.p.A. (Italy), Pfizer Inc. (U.S.), Novartis AG (Switzerland), Merck & Co., Inc. (U.S.), Sanofi (France), Janssen Pharmaceuticals, Inc. (Belgium), PurduePharma (U.S.), ALLERGAN (Republic of Ireland), Boehringer Ingelheim International GmbH (Germany), and others.
Frequently Asked Questions (FAQ) :
Cheilectomy market is projected to grow at approximately 7.8 % CAGR during the assessment period (2020-2027).
Increasing prevalence of hallux rigidus among female population and rising demands for minimally invasive procedures are the major tailwinds pushing the growth of the global cheilectomy market.
High procedural cost and complications such as deep vein thrombosis, need for repeated surgery, and stiffness in the joints of the toes are major growth impeders for the global cheilectomy market.
North America holds the largest share in the global cheilectomy market, followed by Europe and the Asia Pacific, respectively.
STEROID S.p.A. (Italy), Henry Schein, Inc. (U.S.), Pfizer Inc. (U.S.), Merck & Co., Inc. (U.S.), Novartis AG (Switzerland), Sanofi (France), PurduePharma (U.S.), Janssen Pharmaceuticals, Inc. (Belgium), ALLERGAN (Republic of Ireland), and Boehringer Ingelheim International GmbH (Germany), are some of the top players operating in the global cheilectomy market.
TABLE OF CONTENT
Chapter 1. Report Prologue
Chapter 2. Market Introduction
2.1 Definition
2.2 Scope of the Study
2.2.1 Research Objective
2.2.2 Assumptions
2.2.3 Limitations
Chapter 3. Research Methodology
3.1 Introduction
3.2 Primary Research
3.3 Secondary research
3.4 Market Size Estimation
Chapter 4. Market Dynamics
4.1 Drivers
4.2 Restrains
4.3 Opportunities
4.4 Challenges
4.5 Macroeconomic Indicators
4.6 Technology Trends & Assessment
Chapter 5. Market Factor Analysis
5.1 Porters Five Forces Analysis
5.1.1 Bargaining Power of Suppliers
5.1.2 Bargaining Power of Buyers
5.1.3 Threat of New Entrants
5.1.4 Threat of Substitutes
5.1.5 Intensity of Rivalry
5.2 Value Chain Analysis
5.3 Investment Feasibility Analysis
5.4 Pricing Analysis
Chapter 6. Global Cheilectomy Market, by Method
6.1 Introduction
6.2 Open
Market Estimates & Forecast, 2020 – 2027
6.3 Arthroscopic
Market Estimates & Forecast, 2020 – 2027
6.4 Percutaneous
Market Estimates & Forecast, 2020 – 2027
Chapter 7. Global Cheilectomy Market, by Anesthesia
7.1 Introduction
7.2 General Anesthesia
Market Estimates & Forecast, 2020 – 2027
7.3 Local Anesthesia
Market Estimates & Forecast, 2020 – 2027
7.4 Regional Anesthesia
Market Estimates & Forecast, 2020 – 2027
7.5 Others
Chapter 8. Global Cheilectomy Market, by Medication
8.1 Introduction
8.2 Prescription Pain Relievers
Market Estimates & Forecast, 2020 – 2027
8.2.1 Corticosteroids
8.2.2 Opioids
8.2.3 Nonsteroidal Anti-Inflammatory Drugs (NSAIDs)
8.2.4 Others
8.3 OTC Drugs
Market Estimates & Forecast, 2020 – 2027
8.3.1 Ibuprofen
8.3.2 Naproxen
8.3.3 Others
Chapter 9 Global Cheilectomy Market, by End User
9.1 Introduction
9.2 Hospitals & Clinics
Market Estimates & Forecast, 2020 – 2027
9.3 Academic Institutes
Market Estimates & Forecast, 2020 – 2027
9.4 Retail Pharmacies
Market Estimates & Forecast, 2020 – 2027
9.5 Others
Chapter 10. Global Cheilectomy Market, by Region
10.1 Introduction
10.2 America
10.2.1 North America
10.2.1.1 U.S.
10.2.1.2 Canada
10.2.2 South America
10.3 Europe
10.3.1 Western Europe
10.3.1.1 Germany
10.3.1.2 France
10.3.1.3 Italy
10.3.1.4 Spain
10.3.1.5 U.K
10.3.1.6 Rest of Western Europe
10.3.2 Eastern Europe
10.4 Asia Pacific
10.4.1 Japan
10.4.2 China
10.4.3 India
10.4.4 Australia
10.4.5 Republic of Korea
10.4.6 Rest of Asia Pacific
10.5 The Middle East & Africa
10.5.1 United Arab Emirates
10.5.2 Saudi Arabia
10.5.3 Oman
10.5.4 Kuwait
10.5.5 Qatar
10.5.6 Rest of the Middle East & Africa
Chapter 11 Company Landscape
11.1 Introduction
11.2 Market Share Analysis
11.3 Key Development & Strategies
11.3.1 Key Developments
Chapter 12 Company Profiles
12.1 Henry Schein, Inc.
12.1.1 Company Overview
12.1.2 Product Overview
12.1.3 Financials
12.1.4 Key Developments
12.1.5 SWOT Analysis
12.2 STEROID S.p.A.
12.2.1 Company Overview
12.2.2 Product Overview
12.2.3 Financial Overview
12.2.4 Key Developments
12.2.5 SWOT Analysis
12.3 Pfizer Inc.
12.3.1 Company Overview
12.3.2 Product Overview
12.3.3 Financial Overview
12.3.4 Key Development
12.3.5 SWOT Analysis
12.4 Novartis AG
12.4.1 Company Overview
12.4.2 Product/Business Segment Overview
12.4.3 Financial Overview
12.4.4 Key Development
12.4.5 SWOT Analysis
12.5 Abbott
12.5.1 Company Overview
12.5.2 Product Overview
12.5.3 Financial overview
12.5.4 Key Developments
12.5.5 SWOT Analysis
12.6 Merck & Co., Inc.
12.6.1 Company Overview
12.6.2 Product Overview
12.6.3 Financial Overview
12.6.4 Key Developments
12.6.5 SWOT Analysis
12.7 Janssen Pharmaceuticals, Inc.
12.7.1 Overview
12.7.2 Product Overview
12.7.3 Financials
12.7.4 Key Developments
12.7.5 SWOT Analysis
12.8 PurduePharma
12.8.1 Overview
12.8.2 Product Overview
12.8.3 Financials
12.8.4 Key Developments
12.8.5 SWOT Analysis
12.9 ALLERGAN
12.9.1 Overview
12.9.2 Product Overview
12.9.3 Financials
12.9.4 Key Developments
12.9.5 SWOT Analysis
12.10 Boehringer Ingelheim International GmbH
12.10.1 Overview
12.10.2 Product Overview
12.10.3 Financials
12.10.4 Key Developments
12.10.5 SWOT Analysis
12.11 Others
Chapter 13 MRFR Conclusion
13.1 Key Findings
13.1.1 From CEO’s View Point
13.1.2 Unmet Needs of the Market
13.2 Key Companies to Watch
13.3 Prediction of Cheilectomy Industry
Chapter 14 Appendix
LIST OF TABLES
Table 1 Cheilectomy Industry Synopsis, 2020 – 2027
Table 2 Global Cheilectomy Market Estimates and Forecast, 2020 – 2027, (USD Million)
Table 3 Global Cheilectomy Market by Region, 2020 – 2027, (USD Million)
Table 4 Global Cheilectomy Market by Methods, 2020 – 2027, (USD Million)
Table 5 Global Cheilectomy Market by Anaesthesia, 2020 – 2027, (USD Million)
Table 6 Global Cheilectomy Market by Medication, 2020 – 2027, (USD Million)
Table 7 Global Cheilectomy Market by End Users, 2020 – 2027, (USD Million)
Table 8 North America Cheilectomy Market by Methods, 2020 – 2027, (USD Million)
Table 9 North America Cheilectomy Market by Anaesthesia, 2020 – 2027, (USD Million)
Table 10 North America Cheilectomy Market by Medication, 2020 – 2027, (USD Million)
Table 11 North America Cheilectomy Market by End Users, 2020 – 2027, (USD Million)
Table 12 U.S. Cheilectomy Market by Methods, 2020 – 2027, (USD Million)
Table 13 U.S. Cheilectomy Market by Anaesthesia, 2020 – 2027, (USD Million)
Table 14 U.S. Cheilectomy Market by Medication, 2020 – 2027, (USD Million)
Table 15 U.S. Cheilectomy Market by End Users, 2020 – 2027, (USD Million)
Table 16 Canada Cheilectomy Market by Methods, 2020 – 2027, (USD Million)
Table 17 Canada Cheilectomy Market by, Anaesthesia, 2020 – 2027, (USD Million)
Table 18 Canada Cheilectomy Market by Medication, 2020 – 2027, (USD Million)
Table 19 Canada Cheilectomy Market by End Users, 2020 – 2027, (USD Million)
Table 20 South America Cheilectomy Market by Methods, 2020 – 2027, (USD Million)
Table 21 South America Cheilectomy Market by, Anaesthesia, 2020 – 2027, (USD Million)
Table 22 South America Cheilectomy Market by Medication, 2020 – 2027, (USD Million)
Table 23 South America Cheilectomy Market by End Users, 2020 – 2027, (USD Million)
Table 24 Europe Cheilectomy Market by Methods, 2020 – 2027, (USD Million)
Table 25 Europe Cheilectomy Market by, Anaesthesia, 2020 – 2027, (USD Million)
Table 26 Europe Cheilectomy Market by, Medication, 2020 – 2027, (USD Million)
Table 27 Europe Cheilectomy Market by, End Users, 2020 – 2027, (USD Million)
Table 28 Western Europe Cheilectomy Market by, Methods, 2020 – 2027, (USD Million)
Table 29 Western Europe Cheilectomy Market by, Anaesthesia, 2020 – 2027, (USD Million)
Table 30 Western Europe Cheilectomy Market by, Medication, 2020 – 2027, (USD Million)
Table 31 Western Europe Cheilectomy Market by, End Users, 2020 – 2027, (USD Million)
Table 32 Eastern Europe Cheilectomy Market by, Methods, 2020 – 2027, (USD Million)
Table 33 Eastern Europe Cheilectomy Market by, Anaesthesia, 2020 – 2027, (USD Million)
Table 34 Eastern Europe Cheilectomy Market by Medication, 2020 – 2027, (USD Million)
Table 35 Eastern Europe Cheilectomy Market by End Users, 2020 – 2027, (USD Million)
Table 36 Asia Pacific Cheilectomy Market by, Methods, 2020 – 2027, (USD Million)
Table 37 Asia Pacific Cheilectomy Market by, Anaesthesia, 2020 – 2027, (USD Million)
Table 38 Asia Pacific Cheilectomy Market by Medication, 2020 – 2027, (USD Million)
Table 39 Asia Pacific Cheilectomy Market by End Users, 2020 – 2027, (USD Million)
Table 40 Middle East & Africa Cheilectomy Market by Methods, 2020 – 2027, (USD Million)
Table 41 Middle East & Africa Cheilectomy Market by, Anaesthesia, 2020 – 2027, (USD Million)
Table 42 Middle East & Africa Cheilectomy Market by Medication, 2020 – 2027, (USD Million)
Table 43 Middle East & Africa Cheilectomy Market by End Users, 2020 – 2027, (USD Million)
LIST OF FIGURES
Figure 1 Research Process
Figure 2 Segmentation for Global Cheilectomy Market
Figure 3 Segmentation Market Dynamics for Global Cheilectomy Market
Figure 4 Global Cheilectomy Market Share, by Methods, 2020
Figure 5 Global Cheilectomy Market Share, by Anesthesia, 2020
Figure 6 Global Cheilectomy Market Share, by Medication 2020
Figure 7 Global Cheilectomy Market Share, by End Users, 2020
Figure 8 Global Cheilectomy Market Share, by Region, 2020
Figure 9 North America Cheilectomy Market Share, by Country, 2020
Figure 10 Europe Cheilectomy Market Share, by Country, 2020
Figure 11 Asia Pacific Cheilectomy Market Share, by Country, 2020
Figure 12 Middle East & Africa Cheilectomy Market Share, by Country, 2020
Figure 13 Global Cheilectomy Market: Company Share Analysis, 2020 (%)
Figure 14 Henry Schein, Inc.: Key Financials
Figure 15 Henry Schein, Inc.: Segmental Revenue
Figure 16 Henry Schein, Inc.: Geographical Revenue
Figure 17 STEROID S.p.A.: Key Financials
Figure 18 STEROID S.p.A.: Segmental Revenue
Figure 19 STEROID S.p.A.: Geographical Revenue
Figure 20 Pfizer Inc. : Key Financials
Figure 21 Pfizer Inc.: Segmental Revenue
Figure 22 Pfizer Inc.: Geographical Revenue
Figure 23 Abbott: Key Financials
Figure 24 Abbott: Segmental Revenue
Figure 25 Abbot: Geographical Revenue
Figure 26 Merck & Co., Inc.: Key Financials
Figure 27 Merck & Co., Inc.: Segmental Revenue
Figure 28 Merck & Co., Inc.: Geographical Revenue
Figure 29 Janssen Pharmaceuticals, Inc.: Key Financials
Figure 30 Janssen Pharmaceuticals, Inc.: Segmental Revenue
Figure 31 Janssen Pharmaceuticals, Inc.: Geographical Revenue
Figure 32 Novartis AG: Key Financials
Figure 33 Novartis AG: Segmental Revenue
Figure 34 Novartis AG: Geographical Revenue
Figure 35 PurduePharma: Key Financials
Figure 36 PurduePharma: Segmental Revenue
Figure 37 PurduePharma: Geographical Revenue
Figure 38 ALLERGAN: Key Financials
Figure 39 ALLERGAN: Segmental Revenue
Figure 40 ALLERGAN: Geographical Revenue
Figure 41 Boehringer Ingelheim International GmbH: Key Financials
Figure 42 Boehringer Ingelheim International GmbH: Segmental Revenue
Figure 43 Boehringer Ingelheim International GmbH: Geographical Revenue