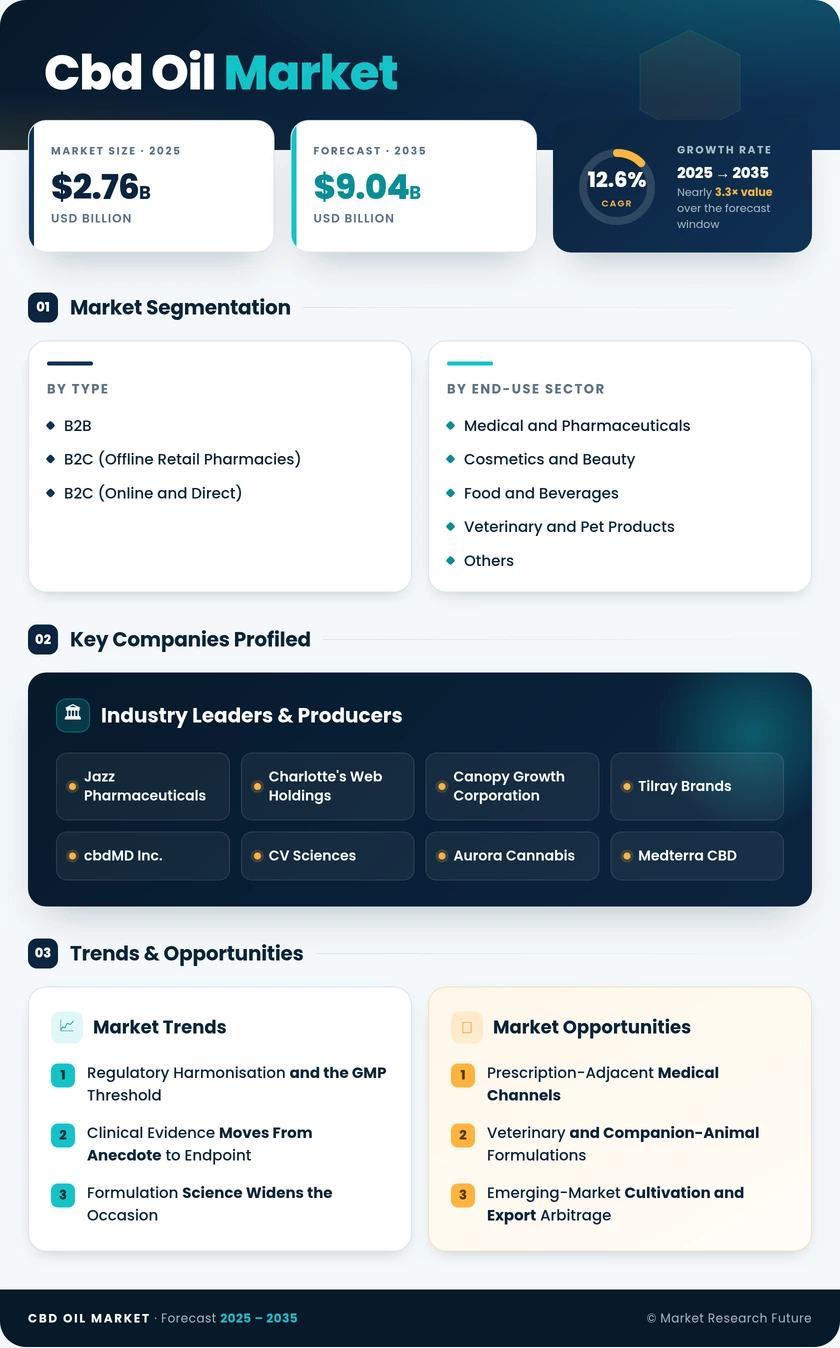
CBD Oil Market (2026 - 2035)

ID: MRFR/HC/5886-CR 117 Pages Vikita Thakur Last Updated: September 15, 2026
CBD Oil (Cannabidiol Oil) Market Research Report By Application (Therapeutic, Cosmetics, Food and Beverages, Vaping, Nutraceuticals), By Source (Hemp-Derived, Marijuana-Derived), By Formulation (Oil, Tinctures, Capsules, Edibles, Topicals), By End Use (Pharmaceuticals, Personal Care Products, Food Industry, Wellness Centers) and By Regional (North America, Europe, South America, Asia Pacific, Middle East and Africa) - Growth & Industry Forecast 2025 To 2035
CBD Oil Market
Market Size
Forecast Period2026-2035
CAGR (2026-2035)12.6%
2025 Market SizeUSD 2.76 Billion
2035 Market SizeUSD 9.04 Billion
Key Players
Jazz Pharmaceuticals
Charlotte's Web Holdings
Canopy Growth Corporation
Tilray Brands
cbdMD Inc.
CV Sciences
Opportunities
  • Prescription-Adjacent Medical Channels
  • Veterinary and Companion-Animal Formulations
  • Emerging-Market Cultivation and Export Arbitrage
  1. 1 Market Overview |
    1. 1.1 Study Assumptions & Market Definition |
    2. 1.2 Scope of the Study |
    3. 1.3 Research Methodology
  2. 2 Market Summary & Key Report Takeaways |
    1. 2.1 By Source Type |
    2. 2.2 By Product Form and Sales Type |
    3. 2.3 By Geography
  3. 3 Global Market Size & Forecast (2021–2035) |
    1. 3.1 Historical Market Size (2021–2025) |
    2. 3.2 Current & Forecast Market Size (2026–2035) |
    3. 3.3 Market Size by Revenue (USD Billion) |
    4. 3.4 Year-over-Year Growth Analysis
  4. 4 Market Drivers Analysis |
    1. 4.1 Regulatory Harmonisation and the GMP Threshold |
    2. 4.2 Clinical Evidence Moves From Anecdote to Endpoint |
    3. 4.3 Formulation Science Widens the Occasion |
    4. 4.4 Cost Deflation Reinvested Into Category Building
  5. 5 Market Restraints Analysis |
    1. 5.1 The Regulatory Vacuum in the United States |
    2. 5.2 Europe's Authorisation Bottleneck |
    3. 5.3 Consistency and Consumer Trust
  6. 6 Market Opportunity Analysis |
    1. 6.1 Prescription-Adjacent Medical Channels |
    2. 6.2 Veterinary and Companion-Animal Formulations |
    3. 6.3 Emerging-Market Cultivation and Export Arbitrage |
    4. 6.4 Data Monetisation Through Outcomes Registries |
    5. 6.5 Cosmetic Actives and Dermatology Crossover |
    6. 6.6 Industry Value Chain Analysis |
    7. 6.7 Porter's Five Forces Analysis
  7. 7 Regional Analysis |
    1. 7.1 North America | |
      1. 7.1.1 US | |
      2. 7.1.2 Canada | |
      3. 7.1.3 Mexico |
    2. 7.2 Europe | |
      1. 7.2.1 Germany | |
      2. 7.2.2 UK | |
      3. 7.2.3 France | |
      4. 7.2.4 Italy | |
      5. 7.2.5 Spain | |
      6. 7.2.6 Nordic Countries | |
      7. 7.2.7 Russia | |
      8. 7.2.8 Rest of Europe |
    3. 7.3 Asia-Pacific | |
      1. 7.3.1 China | |
      2. 7.3.2 India | |
      3. 7.3.3 Japan | |
      4. 7.3.4 South Korea | |
      5. 7.3.5 ASEAN | |
      6. 7.3.6 Rest of Asia-Pacific |
    4. 7.4 South America | |
      1. 7.4.1 Brazil | |
      2. 7.4.2 Argentina | |
      3. 7.4.3 Rest of South America |
    5. 7.5 Middle East & Africa | |
      1. 7.5.1 Saudi Arabia | |
      2. 7.5.2 UAE | |
      3. 7.5.3 South Africa | |
      4. 7.5.4 Egypt | |
      5. 7.5.5 Rest of Middle East & Africa
  8. 8 Future Outlook (2026–2035) |
    1. 8.1 Precision Dosing and Digital Adherence |
    2. 8.2 Consolidation and the Return of Pricing Power |
    3. 8.3 Cannabinoid Portfolio Diversification |
    4. 8.4 Sustainability and Supply-Chain Traceability
  9. 9 Segmentation Analysis |
    1. 9.1 By Source Type | |
      1. 9.1.1 Hemp-Derived | |
      2. 9.1.2 Marijuana-Derived |
    2. 9.2 By Product Form | |
      1. 9.2.1 Oils and Tinctures | |
      2. 9.2.2 Capsules and Softgels | |
      3. 9.2.3 Edibles and Gummies | |
      4. 9.2.4 Topicals and Cosmetics | |
      5. 9.2.5 Beverages | |
      6. 9.2.6 Others |
    3. 9.3 By Sales Type | |
      1. 9.3.1 B2B | |
      2. 9.3.2 B2C — Offline Retail Pharmacies | |
      3. 9.3.3 B2C — Online and Direct |
    4. 9.4 By End-Use Sector | |
      1. 9.4.1 Medical and Pharmaceuticals | |
      2. 9.4.2 Cosmetics and Beauty | |
      3. 9.4.3 Food and Beverages | |
      4. 9.4.4 Veterinary and Pet Products | |
      5. 9.4.5 Others
  10. 10 Competitive Landscape |
    1. 10.1 Market Share Analysis (2026) |
    2. 10.2 Competitive Benchmarking Matrix |
    3. 10.3 Company Profiles | |
      1. 10.3.1 Jazz Pharmaceuticals | |
      2. 10.3.2 Charlotte's Web Holdings | |
      3. 10.3.3 Canopy Growth Corporation | |
      4. 10.3.4 Tilray Brands | |
      5. 10.3.5 cbdMD Inc. | |
      6. 10.3.6 CV Sciences | |
      7. 10.3.7 Aurora Cannabis | |
      8. 10.3.8 Medterra CBD | |
      9. 10.3.9 Endoca | |
      10. 10.3.10 Elixinol Wellness | |
      11. 10.3.11 NuLeaf Naturals
  11. 11 Recent Developments & News
  12. 12 Report Scope & Methodology |
    1. 12.1 Study Period & Base Year |
    2. 12.2 Valuation Currency & Conversion Assumptions |
    3. 12.3 Abbreviations
  13. 13 Detailed Sources & Citations
  14. 14 Frequently Asked Questions
  15. 15 LIST OF TABLES |
  16. TABLE 1 Global CBD Oil Market Size & Forecast, by Revenue (USD Billion), 2021–2035 |
  17. TABLE 2 Global CBD Oil Market – Year-over-Year Growth Analysis, 2021–2035 |
  18. TABLE 3 Market Driver Impact Analysis – Impact Weighting, Geography and Timeline |
  19. TABLE 4 Market Restraint Impact Analysis – Impact Weighting, Geography and Timeline |
  20. TABLE 5 Global CBD Oil Market Size, by Region, 2021–2035 (USD Billion) |
  21. TABLE 6 North America CBD Oil Market Size, by Country, 2021–2035 (USD Billion) |
  22. TABLE 7 Europe CBD Oil Market Size, by Country, 2021–2035 (USD Billion) |
  23. TABLE 8 Asia-Pacific CBD Oil Market Size, by Country, 2021–2035 (USD Billion) |
  24. TABLE 9 South America CBD Oil Market Size, by Country, 2021–2035 (USD Billion) |
  25. TABLE 10 Middle East & Africa CBD Oil Market Size, by Country, 2021–2035 (USD Billion) |
  26. TABLE 11 Global CBD Oil Market Size, by Source Type, 2021–2035 (USD Billion) |
  27. TABLE 12 Global CBD Oil Market Size, by Product Form, 2021–2035 (USD Billion) |
  28. TABLE 13 Global CBD Oil Market Size, by Sales Type, 2021–2035 (USD Billion) |
  29. TABLE 14 Global CBD Oil Market Size, by End-Use Sector, 2021–2035 (USD Billion) |
  30. TABLE 15 North America CBD Oil Market Size, by Source Type and Product Form, 2021–2035 (USD Billion) |
  31. TABLE 16 Europe CBD Oil Market Size, by Sales Type and End-Use Sector, 2021–2035 (USD Billion) |
  32. TABLE 17 Asia-Pacific CBD Oil Market Size, by Product Form and End-Use Sector, 2021–2035 (USD Billion) |
  33. TABLE 18 South America CBD Oil Market Size, by Source Type and Sales Type, 2021–2035 (USD Billion) |
  34. TABLE 19 Middle East & Africa CBD Oil Market Size, by Product Form and End-Use Sector, 2021–2035 (USD Billion) |
  35. TABLE 20 Competitive Benchmarking Matrix – Global CBD Oil Market, 2026 |
  36. TABLE 21 Company Profiles – Key Players, Global CBD Oil Market |
  37. TABLE 22 Recent Developments & Strategic Announcements, 2023–2025 |
  38. TABLE 23 Report Scope & Methodology Summary |
  39. TABLE 24 Detailed Sources and Citations Index
  40. 16 LIST OF FIGURES |
  41. FIGURE 1 Global CBD Oil Market Dynamics – Drivers, Restraints and Opportunities Map |
  42. FIGURE 2 Industry Value Chain Analysis – Cultivation to Finished Formulation |
  43. FIGURE 3 Porter's Five Forces Analysis – Global CBD Oil Market |
  44. FIGURE 4 Global Market Size Trend and Forecast Curve, 2021–2035 (USD Billion) |
  45. FIGURE 5 Year-over-Year Growth Trajectory, 2022–2035 (%) |
  46. FIGURE 6 Market Share by Source Type, 2025 vs 2035 (%) |
  47. FIGURE 7 Market Share by Product Form, 2025 (%) |
  48. FIGURE 8 Market Share by Sales Type, 2025 (%) |
  49. FIGURE 9 Market Share by End-Use Sector, 2025 vs 2035 (%) |
  50. FIGURE 10 Regional Revenue Share Distribution, 2025 (%) |
  51. FIGURE 11 Regional CAGR Comparison, 2026–2035 (%) |
  52. FIGURE 12 North America Country-Level Revenue Split, 2025 (%) |
  53. FIGURE 13 Europe Country-Level Revenue Split, 2025 (%) |
  54. FIGURE 14 Asia-Pacific Country-Level Revenue Split, 2025 (%) |
  55. FIGURE 15 Competitive Landscape – Estimated Revenue Share Bands, 2026 |
  56. FIGURE 16 Strategic Positioning Matrix – Scale vs Regulatory Certification Depth |
  57. FIGURE 17 Cannabinoid Input Price Index Trend, 2021–2025 |
  58. FIGURE 18 Fastest-Growing Segment Comparison, 2026–2035 CAGR (%)

Segmentation Quick Reference

DimensionSub-SegmentsDominant SegmentFastest Growing Segment
By Source TypeHemp-Derived; Marijuana-DerivedHemp-DerivedMarijuana-Derived
By Product FormOils and Tinctures; Capsules and Softgels; Edibles and Gummies; Topicals and Cosmetics; Beverages; OthersOils and TincturesEdibles and Gummies
By Sales TypeB2B; B2C (Offline Retail Pharmacies); B2C (Online and Direct)B2BB2C (Offline Retail Pharmacies)
By End-Use SectorMedical and Pharmaceuticals; Cosmetics and Beauty; Food and Beverages; Veterinary and Pet Products; OthersMedical and PharmaceuticalsVeterinary and Pet Products
By GeographyNorth America; Europe; Asia-Pacific; South America; Middle East & AfricaNorth AmericaAsia-Pacific


Market Segmentation Overview

By Source Type

Sub-SegmentKey Trend
Hemp-DerivedCross-border tradability under sub-0.3% THC thresholds keeps hemp the default input for multi-region contract manufacturers
Marijuana-DerivedDispensary channels support premium full-plant formulations as medical and adult-use programmes widen


Source classification determines almost everything downstream — customs treatment, permissible claims, retail channel access, and testing burden. Operators increasingly maintain parallel supply chains rather than choosing one, allowing a single brand to serve pharmacy, mass retail, and dispensary channels without reformulating.

By Product Form

Sub-SegmentKey Trend
Oils and TincturesSublingual dosing precision retains loyal experienced users despite convenience trade-offs
Capsules and SoftgelsFamiliar supplement format easing pharmacy and mass-retail listing decisions
Edibles and GummiesTaste masking removes the primary barrier to first-time trial
Topicals and CosmeticsPremium skincare positioning where ingredient cost is a small fraction of shelf price
BeveragesNano-emulsion stability improvements finally enabling ambient-shelf distribution
OthersVapes, transdermal patches and specialty delivery devices


Format economics diverge sharply. Tinctures carry the highest gross margin per millilitre but the slowest new-user acquisition; gummies invert both. Beverage launches remain the highest-risk category because shelf-life failure destroys distributor relationships that take years to build.

By Sales Type

Sub-SegmentKey Trend
B2BConcentrated GMP-certified processors supply hundreds of downstream labels
B2C — Offline Retail PharmaciesPharmacist-mediated recommendation drives conversion and repeat purchase
B2C — Online and DirectSubscription models capture full margin but face advertising restrictions


Channel structure hides where power actually sits. Consumer-facing brands compete visibly on price and packaging while a small tier of certified processors sets input cost for the entire category, an arrangement that consolidation is likely to formalise through vertical integration.

By End-Use Sector

Sub-SegmentKey Trend
Medical and PharmaceuticalsPrescription indications set the evidentiary benchmark other sectors borrow from
Cosmetics and BeautyDermatological research into receptor modulation supports premium claims
Food and BeveragesFunctional wellness occasions expanding as bioavailability improves
Veterinary and Pet ProductsSpecies-specific pharmacokinetic dossiers becoming a competitive differentiator
OthersIndustrial, research and institutional applications


End-use concentration in medical applications reflects where reimbursement exists rather than where consumer interest is greatest. Veterinary demand grows fastest precisely because it sits outside human-health regulatory scrutiny while benefiting from the same underlying clinical literature.

By Region

Sub-SegmentKey Trend
North AmericaFederal-state regulatory divergence constrains national retail assortment
EuropeNovel-food dossier position functions as a tradeable competitive asset
Asia-PacificJapanese statutory revision triggering a broader regional liberalisation cycle
South AmericaLow-cost cultivation origins scaling export volumes to Europe and Asia
Middle East & AfricaScheduling exemptions and contract farming creating narrow but growing access


Regional divergence is regulatory, not cultural. Consumer willingness to try cannabinoid wellness products is remarkably consistent across surveyed markets; what varies is whether a lawful, quality-assured product is available to buy when that interest surfaces.




Download PDF ×

We do not share your information with anyone. However, we may send you emails based on your report interest from time to time. You may contact us at any time to opt-out.