Certified Global Research Member
Isomar fd.webp Wcrc 57.webp
Key Questions Answered
  • Global Market Outlook
  • In-depth analysis of global and regional trends
  • Analyze and identify the major players in the market, their market share, key developments, etc.
  • To understand the capability of the major players based on products offered, financials, and strategies.
  • Identify disrupting products, companies, and trends.
  • To identify opportunities in the market.
  • Analyze the key challenges in the market.
  • Analyze the regional penetration of players, products, and services in the market.
  • Comparison of major players’ financial performance.
  • Evaluate strategies adopted by major players.
  • Recommendations
Why Choose Market Research Future?
  • Vigorous research methodologies for specific market.
  • Knowledge partners across the globe
  • Large network of partner consultants.
  • Ever-increasing/ Escalating data base with quarterly monitoring of various markets
  • Trusted by fortune 500 companies/startups/ universities/organizations
  • Large database of 5000+ markets reports.
  • Effective and prompt pre- and post-sales support.

Casino Market Research Report Information By Type (Land-Based Casino Gaming and Online Casino Gaming), By End User (Gambling Enthusiasts, Dabblers, Lottery Loyalists, and Unengaged Audience), And By Region (North America, Europe, Asia-Pacific, And Rest Of The World) –Market Forecast Till 2032.


ID: MRFR/ICT/8628-CR | 80 Pages | Author: Shubham Munde| July 2020

Casino Market Segmentation


Casino Type Outlook (USD Billion, 2018-2032)


  • Land-Based Casino Gaming


  • Online Casino Gaming


Casino End User Outlook (USD Billion, 2018-2032)


  • Gambling Enthusiasts


  • Dabblers


  • Lottery Loyalists


  • Unengaged Audience


Casino Regional Outlook (USD Billion, 2018-2032)


  • North America Outlook (USD Billion, 2018-2032)


    • North America Casino by Type


      • Land-Based Casino Gaming


      • Online Casino Gaming


    • North America Casino by End User


      • Gambling Enthusiasts


      • Dabblers


      • Lottery Loyalists


      • Unengaged Audience


    • US Outlook (USD Billion, 2018-2032)


    • US Casino by Type


      • Land-Based Casino Gaming


      • Online Casino Gaming


    • US Casino by End User


      • Gambling Enthusiasts


      • Dabblers


      • Lottery Loyalists


      • Unengaged Audience


    • CANADA Outlook (USD Billion, 2018-2032)


    • CANADA Casino by Type


      • Land-Based Casino Gaming


      • Online Casino Gaming


    • CANADA Casino by End User


      • Gambling Enthusiasts


      • Dabblers


      • Lottery Loyalists


      • Unengaged Audience


  • Europe Outlook (USD Billion, 2018-2032)


    • Europe Casino by Type


      • Land-Based Casino Gaming


      • Online Casino Gaming


    • Europe Casino by End User


      • Gambling Enthusiasts


      • Dabblers


      • Lottery Loyalists


      • Unengaged Audience


    • Germany Outlook (USD Billion, 2018-2032)


    • Germany Casino by Type


      • Land-Based Casino Gaming


      • Online Casino Gaming


    • Germany Casino by End User


      • Gambling Enthusiasts


      • Dabblers


      • Lottery Loyalists


      • Unengaged Audience


    • France Outlook (USD Billion, 2018-2032)


    • France Casino by Type


      • Land-Based Casino Gaming


      • Online Casino Gaming


    • France Casino by End User


      • Gambling Enthusiasts


      • Dabblers


      • Lottery Loyalists


      • Unengaged Audience


    • UK Outlook (USD Billion, 2018-2032)


    • UK Casino by Type


      • Land-Based Casino Gaming


      • Online Casino Gaming


    • UK Casino by End User


      • Gambling Enthusiasts


      • Dabblers


      • Lottery Loyalists


      • Unengaged Audience


    • ITALY Outlook (USD Billion, 2018-2032)


    • ITALY Casino by Type


      • Land-Based Casino Gaming


      • Online Casino Gaming


    • ITALY Casino by End User


      • Gambling Enthusiasts


      • Dabblers


      • Lottery Loyalists


      • Unengaged Audience


    • SPAIN Outlook (USD Billion, 2018-2032)


    • Spain Casino by Type


      • Land-Based Casino Gaming


      • Online Casino Gaming


    • Spain Casino by End User


      • Gambling Enthusiasts


      • Dabblers


      • Lottery Loyalists


      • Unengaged Audience


    • Rest Of Europe Outlook (USD Billion, 2018-2032)


    • Rest Of Europe Casino by Type


      • Land-Based Casino Gaming


      • Online Casino Gaming


    • REST OF EUROPE Casino by End User


      • Gambling Enthusiasts


      • Dabblers


      • Lottery Loyalists


      • Unengaged Audience


  • Asia-Pacific Outlook (USD Billion, 2018-2032)


    • Asia-Pacific Casino by Type


      • Land-Based Casino Gaming


      • Online Casino Gaming


    • Asia-Pacific Casino by End User


      • Gambling Enthusiasts


      • Dabblers


      • Lottery Loyalists


      • Unengaged Audience


    • China Outlook (USD Billion, 2018-2032)


    • China Casino by Type


      • Land-Based Casino Gaming


      • Online Casino Gaming


    • China Casino by End User


      • Gambling Enthusiasts


      • Dabblers


      • Lottery Loyalists


      • Unengaged Audience


    • Japan Outlook (USD Billion, 2018-2032)


    • Japan Casino by Type


      • Land-Based Casino Gaming


      • Online Casino Gaming


    • Japan Casino by End User


      • Gambling Enthusiasts


      • Dabblers


      • Lottery Loyalists


      • Unengaged Audience


    • India Outlook (USD Billion, 2018-2032)


    • India Casino by Type


      • Land-Based Casino Gaming


      • Online Casino Gaming


    • India Casino by End User


      • Gambling Enthusiasts


      • Dabblers


      • Lottery Loyalists


      • Unengaged Audience


    • Australia Outlook (USD Billion, 2018-2032)


    • Australia Casino by Type


      • Land-Based Casino Gaming


      • Online Casino Gaming


    • Australia Casino by End User


      • Gambling Enthusiasts


      • Dabblers


      • Lottery Loyalists


      • Unengaged Audience


    • Rest of Asia-Pacific Outlook (USD Billion, 2018-2032)


    • Rest of Asia-Pacific Casino by Type


      • Land-Based Casino Gaming


      • Online Casino Gaming


    • Rest of Asia-Pacific Casino by End User


      • Gambling Enthusiasts


      • Dabblers


      • Lottery Loyalists


      • Unengaged Audience


  • Rest of the World Outlook (USD Billion, 2018-2032)


    • Rest of the World Casino by Type


      • Land-Based Casino Gaming


      • Online Casino Gaming


    • Rest of the World Casino by End User


      • Gambling Enthusiasts


      • Dabblers


      • Lottery Loyalists


      • Unengaged Audience


    • Middle East Outlook (USD Billion, 2018-2032)


    • Middle East Casino by Type


      • Land-Based Casino Gaming


      • Online Casino Gaming


    • Middle East Casino by End User


      • Gambling Enthusiasts


      • Dabblers


      • Lottery Loyalists


      • Unengaged Audience


    • Africa Outlook (USD Billion, 2018-2032)


    • Africa Casino by Type


      • Land-Based Casino Gaming


      • Online Casino Gaming


    • Africa Casino by End User


      • Gambling Enthusiasts


      • Dabblers


      • Lottery Loyalists


      • Unengaged Audience


    • Latin America Outlook (USD Billion, 2018-2032)


    • Latin America Casino by Type


      • Land-Based Casino Gaming


      • Online Casino Gaming


    • Latin America Casino by End User


      • Gambling Enthusiasts


      • Dabblers


      • Lottery Loyalists


      • Unengaged Audience


Research Methodology – Global CASINO Market
Purchased Database:


  • Includes company data base ssuch as Hoover’s:This helps us identify financial information, industry competitive landscape, structure of the market Also, it serves as an important step in market sizing, especially in case of commodity-flow techniques.


  • Industry databases, e.g., Factiva. helps us gain access to industry statistics, and KoL opinions & formulate conclusions.


  • Other sources include SME journals, and pertinent databases from third-party vendors to gain insights into:


  • Procedure statistics


  • Potential market related statistics


  • Information on unmet needs


  • Regional expenditure pattern


  • Investment information or opportunity-based statistics


Following databases were used but are not limited to,


  • Euromonitor


  • Factiva


  • Bloomberg


  • Statista


  • Hoovers


  • Dun & Bradstreet


  • Crunch Base


  • Zoom Info


  • Pitch book


  • Tofler


  • Tracxn


MRFR’s Internal Database


  • Includes our internal data base of datapoints,collected because of previous research & studies and information made available via our database management team.


  • Also includes internal audit reports & archives.


Secondary Sources:


  • A list of secondary sources along with the information extracted from them will be available in the final deliverable.


Notable examples include white papers, government statistics published by organizations like IRU, NGOs etc., KoL publications, company filings, investor documents etc.


Some of the sources used in the report include,


  • IEEE


  • Research Gate


  • Science Direct


  • Forbes


  • McKinsey


  • Association of Gaming Equipment Manufacturers (AGEM)


  • American Gaming Association (AGA)


  • European Gaming and Amusement Council (GEGAC)


  • International Association of Gaming Regulators (IAGR)


  • World Lottery Association (WLA)


Third Party Perspective:


  • Primary Research


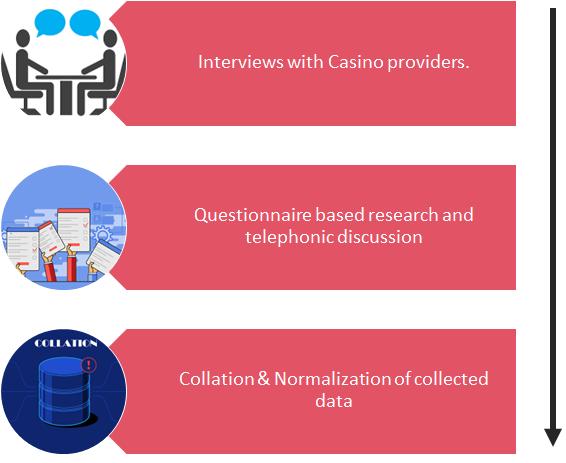
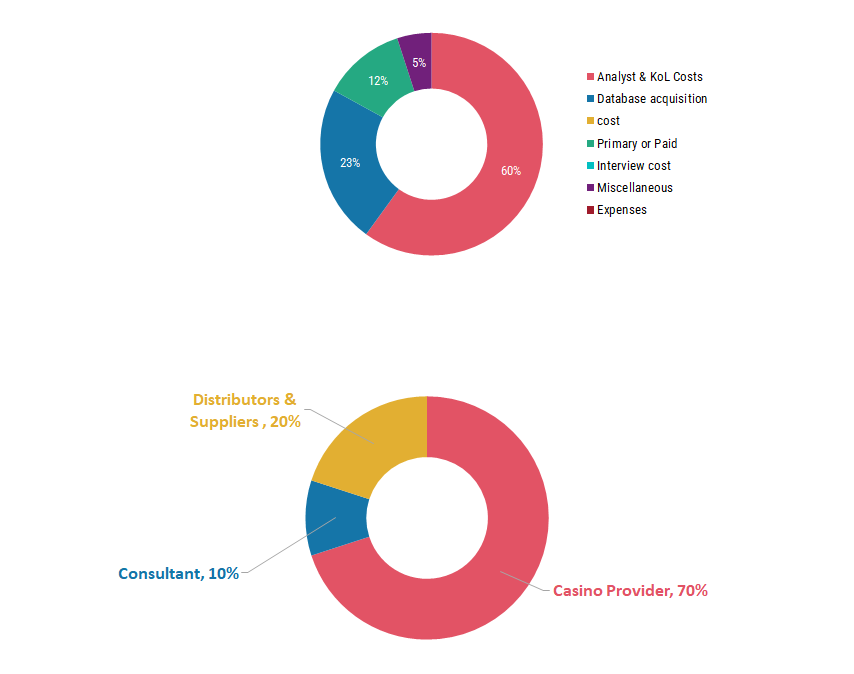
    Figure 1 - PRIMARY RESEARCH PATTERN

    The primary interviews and surveys derive directions from extensive secondary research. Secondary research is a continuous process and is conducted at each level along the value chain.


    PRIMARY RESEARCH PATTERN


    Interview Scope:


    • Research tools: Questionnaire-based research and telephonic discussions


    • Database:Paid vendors, LinkedIn, Hoover’s, Factiva, Sources extracted from previous pertinent studies


    • Market scope: All segments with inthe scope of the Interviews of KoLs from non- English-speaking countries are conducted via our vendors and questionnaires.


    Sample size for the study:


    MARKET


    CHAIN SIDE


    NO. OF PRIMARY INTERVIEWS


    TOTAL (A+B)


    North America


    Supply (A)


    14


    24


    End User (B)


    10


    Europe


    Supply (A)


    12


    20


    End User (B)


    8


    Asia-Pacific


    Supply (A)


    18


    33


    End User (B)


    15


    Middle East & Africa


    Supply (A)


    3


    4


    End User (B)


    1


    South America


    Supply (A)


    3


    4


    End User (B)


    1


    Total


    -


    -


    85


    Data Analysis


    • Information procured from secondary and primary initiatives is then, analyzed by using the following tools/models:(a partial list)


    • Identifying variables and establishing the market impact


    • Establishing market trends


    • Analyzing future opportunities and market penetration rates by understanding product commercialization, regional expansion


    • Analyzing reimbursement trends and changes in market dynamics to establish future


    • Analyzing sustainability strategies adhered to by market participants in anattempt to determinethe future course of the market.


    • Analyzing historical market trends and super-imposing the monthe current and future variables to determine year-on-year trend.


    • Understanding procedure trends framework


    • Keeping atrack of technological advancements in individual segments


    • Base numbers are established by analyzing the following:


    • Company revenues and market share (this list generally includes the analysis of revenue published by publicly listed manufacturers)


    • Derivation of market estimates via analysing parent and ancillary markets


    • Model selection:demand-based bottom-up approach,rates-based approach,and mixed approach (top down and bottomup)


    Data Analysis: Market Formulation:


    • This step involves the finalization of market This step on an internal level is designed to manage out puts from the Data Analys is step.


    • Data normalization


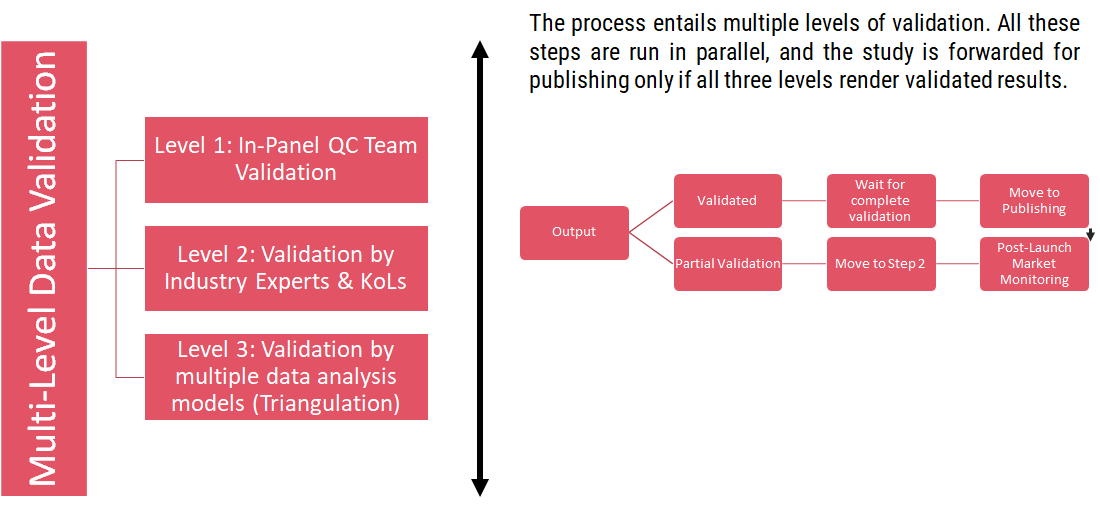
    • The final market estimates & forecasts are then aligned and sent to industry experts in-panel quality control managers for validation.


    • This step also entails the finalization of the report scope and data representation


    The process entails multiple levels of validation. All these steps are run in parallel, and the study is forwarded for publishing only if all three levels research


    process entails multiple levels


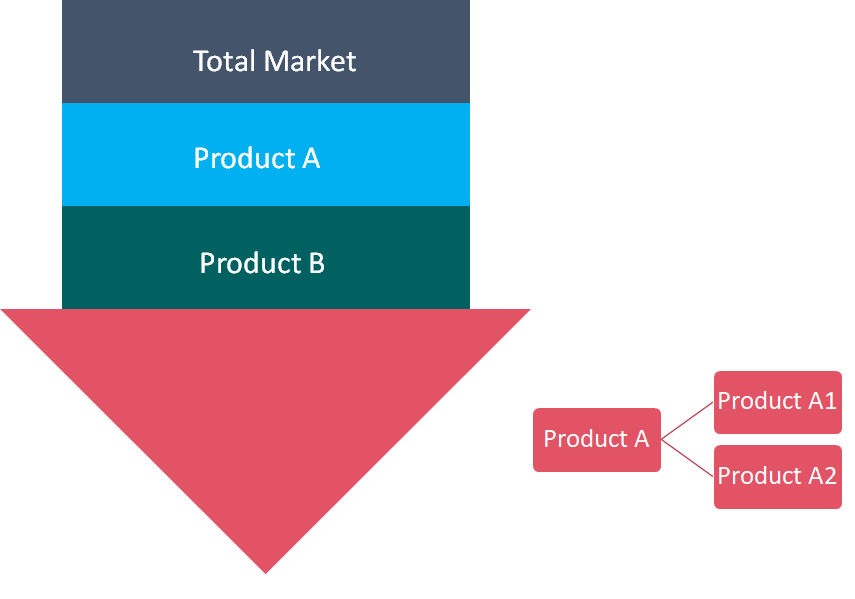
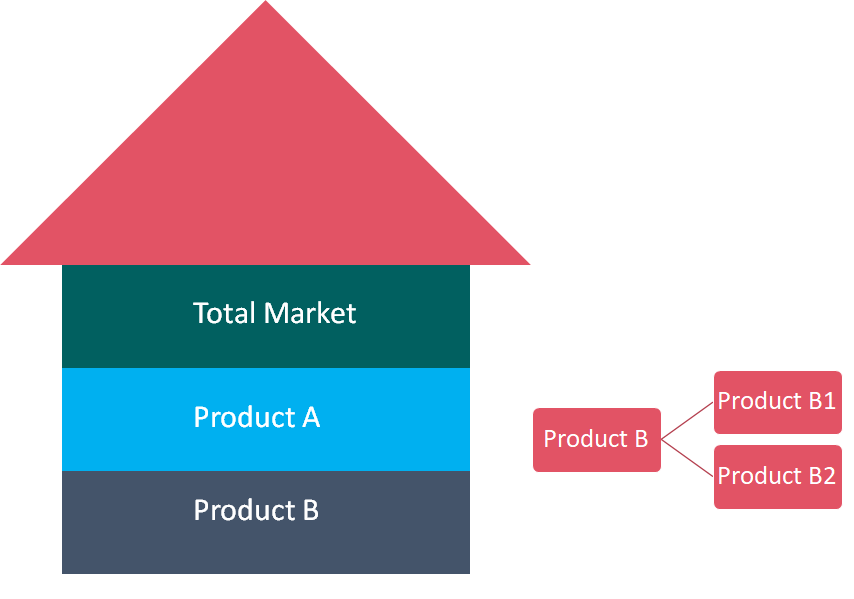
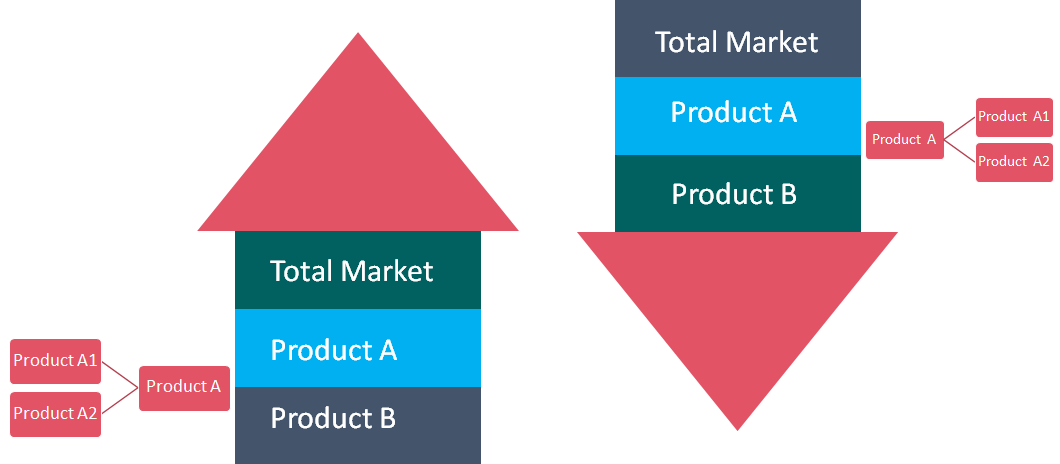
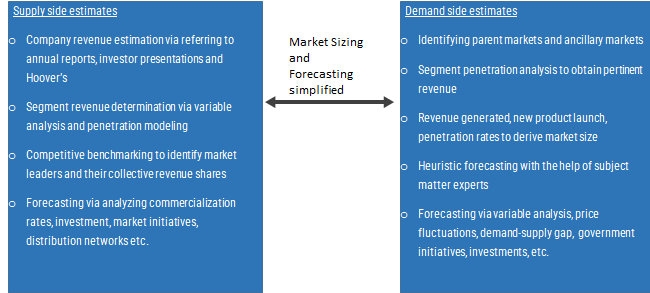
    Figure 2: MARKET RESEARCH APPROACHES

    Bottom-up Demand Approach


    • Demand estimation of each product across countries/regions summed to form the total market


    • Variable analysis for demand forecasting


    • Demand estimation via analyzing paid databases, and company financials either via annual reports or paid databases


    • Primary interviews for data revalidation and insight collection


    MARKET RESEARCH APPROACHES


    Top-Down Approach


    • Used extensively for new product forecasting or analyzing penetration levels

    • Use of regression and multi-variate analyses for forecasting involves extensive use of paid and public databases

    • Primary interviews and vendor based primary research for user preferences


    Combined Approach


    Combined Approach


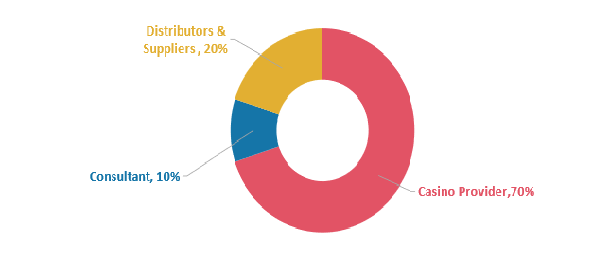
    Figure 3 - VALUE CHAIN BASED SIZING & FORECASTING


    Penetration modeling for products


    • Determining and forecasting penetration via analysing product features, availability of internal and external substitutes


    • Heuristic estimation of year-on-year sales by conducting primary interviews with:


    Casino providers


Industry experts & KoLs


COST STRUCTURE

COST STRUCTURE 1

Leading companies partner with us for data-driven Insights
client_1 client_2 client_3 client_4 client_5 client_6 client_7 client_8 client_9 client_10
Please fill in Business Email for Quick Response

1 EXECUTIVE SUMMARY

1.1 MARKET ATTRACTIVENESS ANALYSIS 14

2 MARKET INTRODUCTION

2.1 DEFINITION 15

2.2 SCOPE OF THE STUDY 15

2.3 RESEARCH OBJECTIVE 15

2.4 MARKET STRUCTURE 15

3 RESEARCH METHODOLOGY

4 MARKET INSIGHTS

5 MARKET DYNAMICS

5.1 INTRODUCTION 25

5.2 DRIVERS 26

5.2.1 Increased Popularity Of Mobile Gaming Among The Younger Population 26

5.2.2 Legalization Of Mobile Gambling 26

5.2.3 Increasing Disposable Income Across Developing Nations 26

5.3 OPPORTUNITIES 27

5.3.1 Advent Of Blockchain-Based Mobile Casino Platforms 27

5.3.2 Development Of AR And VR Based Casino Games 28

5.4 CHALLENGE 28

5.4.1 Securing Online Payments 28

6 MARKET FACTOR ANALYSIS

6.1 VALUE CHAIN ANALYSIS 29

6.1.1 Developers And Technology Providers 29

6.1.2 Casino Games Providers (Online And Offline) 29

6.1.3 End Users 29

6.2 PORTER’S FIVE FORCES MODEL 30

6.2.1 Bargaining Power Of Suppliers 31

6.2.2 Bargaining Power Of Buyers 31

6.2.3 Threat Of New Entrants 31

6.2.4 Threat Of Substitutes 31

6.2.5 Intensity Of Rivalry 31

7 GLOBAL CASINO MARKET, BY TYPE

7.1 INTRODUCTION 32

7.2 POKER 33

7.3 BLACKJACK 33

7.4 SLOT MACHINES 33

7.5 ROULETTE 33

7.6 CRAPS 33

7.7 LOTTERY 34

8 GLOBAL CASINO MARKET, BY REGION

8.1 OVERVIEW 35

8.2 NORTH AMERICA 37

8.2.1 US 38

8.2.2 Canada 38

8.2.3 Mexico 39

8.3 ASIA-PACIFIC 39

8.3.1 China 40

8.3.2 Australia 41

8.3.3 Japan 41

8.3.4 Rest Of Asia-Pacific 42

8.4 EUROPE 42

8.4.1 France 43

8.4.2 UK 44

8.4.3 Germany 45

8.4.4 Rest Of Europe 46

8.5 MIDDLE EAST & AFRICA 47

8.6 SOUTH AMERICA 48

9 COMPETITIVE LANDSCAPE

9.1 COMPETITIVE BENCHMARKING 50

9.1.1 Vendor Analysis 51

9.1.1.1 Research Methodology 51

9.2 PRODUCT LAUNCHES 53

9.3 MERGERS AND ACQUISITIONS 53

9.4 PARTNERSHIPS/AGREEMENTS/COLLABORATIONS 53

9.5 BUSINESS EXPANSION 54

10 COMPANY PROFILES

10.1 MICROGAMING 55

10.1.1 Company Overview 55

10.1.2 Products/Solutions/Services Offered 55

10.1.3 Key Developments 55

10.1.4 Key Strategies 55

10.2 EVOLUTION GAMING 56

10.2.1 Company Overview 56

10.2.2 Financial Overview 56

10.2.3 Products/Solutions/Services Offered 57

10.2.4 Key Developments 57

10.2.5 Swot Analysis 58

10.2.6 Key Strategies 58

10.3 CHETU, INC 59

10.3.1 Company Overview 59

10.3.2 Products/Solutions/Services Offered 59

10.3.3 Key Developments 59

10.3.4 Key Strategies 59

10.4 CREATIOSOFT 60

10.4.1 Company Overview 60

10.4.2 Products/Solutions/Services Offered 60

10.4.3 Key Developments 60

10.4.4 Key Strategies 60

10.5 ELAUNCH SOLUTION PVT. LTD 61

10.5.1 Company Overview 61

10.5.2 Products/Solutions/Services Offered 61

10.5.3 Key Developments 61

10.5.4 Key Strategies 61

10.6 PLAYSON 62

10.6.1 Company Overview 62

10.6.2 Products/Solutions/Services Offered 62

10.6.3 Key Developments 62

10.6.4 Key Strategies 62

10.7 BETSOFT 63

10.7.1 Company Overview 63

10.7.2 Products/Solutions/Services Offered 63

10.7.3 Key Developments 63

10.7.4 Key Strategies 63

10.8 BETSSON AB 64

10.8.1 Company Overview 64

10.8.2 Financial Overview 64

10.8.3 Products/Solutions/Services Offered 65

10.8.4 Key Developments 65

10.8.5 Swot Analysis 65

10.8.6 Key Strategies 65

10.9 KINDRED GROUP PLC 66

10.9.1 Company Overview 66

10.9.2 Financial Overview 66

10.9.3 Products/Solutions/Services Offered 67

10.9.4 Key Developments 67

10.9.5 Swot Analysis 67

10.9.6 Key Strategies 67

10.10 NETENT AB 68

10.10.1 Company Overview 68

10.10.2 Financial Overview 68

10.10.3 Products/Solutions/Services Offered 69

10.10.4 Key Developments 69

10.10.5 Swot Analysis 69

10.10.6 Key Strategies 69

10.11 PADDY POWER BETFAIR PLC 70

10.11.1 Company Overview 70

10.11.2 Financial Overview 70

10.11.3 Products/Solutions/Services Offered 71

10.11.4 Key Developments 71

10.11.5 Swot Analysis 71

10.11.6 Key Strategies 72

10.12 THE 888 GROUP 73

10.12.1 Company Overview 73

10.12.2 Financial Overview 73

10.12.3 Products/Solutions/Services Offered 74

10.12.4 Key Developments 74

10.12.5 Swot Analysis 75

10.12.6 Key Strategies 75

10.13 SCIENTIFIC GAMES 76

10.13.1 Company Overview 76

10.13.2 Financial Overview 76

10.13.3 Products/Solutions/Services Offered 77

10.13.4 Key Developments 77

10.13.5 Swot Analysis 77

10.13.6 Key Strategies 77

10.14 LADBROKES 78

10.14.1 Company Overview 78

10.14.2 Financial Overview 78

10.14.3 Products/Solutions/Services Offered 79

10.14.4 Key Developments 79

10.14.5 Key Strategies 79

10.15 ADDISON GLOBAL LIMITED 80

10.15.1 Company Overview 80

10.15.2 Financial Overview 80

10.15.3 Products/ Solutions/ Services Offered 80

10.15.4 Key Strategies 80

11 LIST OF TABLES

TABLE 1 MARKET SYNOPSIS 13

TABLE 2 GLOBAL CASINO MARKET, BY TYPE, 2020-2027 (USD MILLION) 33

TABLE 3 GLOBAL CASINO MARKET, BY REGION, 2020-2027 (USD MILLION) 36

TABLE 1 NORTH AMERICA CASINO MARKET, BY COUNTRY, 2020-2027 (USD MILLION) 37

TABLE 2 NORTH AMERICA CASINO MARKET, BY TYPE, 2020-2027 (USD MILLION) 37

TABLE 3 US CASINO MARKET, BY TYPE, 2020-2027 (USD MILLION) 38

TABLE 4 CANADA CASINO MARKET, BY TYPE, 2020-2027 (USD MILLION) 38

TABLE 5 MEXICO CASINO MARKET, BY TYPE, 2020-2027 (USD MILLION) 39

TABLE 6 ASIA-PACIFIC CASINO MARKET, BY COUNTRY, 2020-2027 (USD MILLION) 39

TABLE 7 ASIA-PACIFIC CASINO MARKET, BY TYPE, 2020-2027 (USD MILLION) 40

TABLE 8 CHINA CASINO MARKET, BY TYPE, 2020-2027 (USD MILLION) 40

TABLE 9 AUSTRALIA CASINO MARKET, BY TYPE, 2020-2027 (USD MILLION) 41

TABLE 10 JAPAN CASINO MARKET, BY TYPE, 2020-2027 (USD MILLION) 41

TABLE 11 REST OF ASIA-PACIFIC CASINO MARKET, BY TYPE, 2020-2027 (USD MILLION) 42

TABLE 12 EUROPE CASINO MARKET, BY COUNTRY, 2020-2027 (USD MILLION) 42

TABLE 13 EUROPE CASINO MARKET, BY TYPE, 2020-2027 (USD MILLION) 43

TABLE 14 FRANCE CASINO MARKET, BY TYPE, 2020-2027 (USD MILLION) 43

TABLE 15 UK CASINO MARKET, BY TYPE, 2020-2027 (USD MILLION) 44

TABLE 16 GERMANY CASINO MARKET, BY TYPE, 2020-2027 (USD MILLION) 45

TABLE 17 REST OF EUROPE CASINO MARKET, BY TYPE, 2020-2027 (USD MILLION) 46

TABLE 18 MIDDLE EAST & AFRICA CASINO MARKET, BY TYPE, 2020-2027 (USD MILLION) 47

TABLE 19 SOUTH AMERICA CASINO MARKET, BY TYPE, 2020-2027 (USD MILLION) 48

TABLE 20 OFFLINE (GAME TYPE) CASINO MARKET, BY CATEGORY 51

TABLE 21 MOBILE BASED CASINO MARKET, BY CATEGORY 52

TABLE 22 ONLINE CASINO MARKET, BY CATEGORY 52

TABLE 23 MICROGAMING: PRODUCTS/SOLUTIONS/SERVICES OFFERED 55

TABLE 24 MICROGAMING: KEY DEVELOPMENTS 55

TABLE 25 THE 888 GROUP: PRODUCTS/SOLUTIONS/SERVICES OFFERED 57

TABLE 26 EVOLUTION GAMING: KEY DEVELOPMENTS 57

TABLE 27 CHETU, INC: PRODUCTS/SOLUTIONS/SERVICES OFFERED 59

TABLE 28 CREATIOSOFT: PRODUCTS/SOLUTIONS/SERVICES OFFERED 60

TABLE 29 ELAUNCH SOLUTION PVT LTD: PRODUCTS/SOLUTIONS/SERVICES OFFERED 61

TABLE 30 PLAYSON: PRODUCTS/SOLUTIONS/SERVICES OFFERED 62

TABLE 31 LADBROKES: PRODUCTS/SOLUTIONS/SERVICES OFFERED 63

TABLE 32 BETSSON AB: PRODUCTS/SOLUTIONS/SERVICES OFFERED 65

TABLE 33 KINDRED GROUP PLC: PRODUCTS/SOLUTIONS/SERVICES OFFERED 67

TABLE 34 NETENT AB: PRODUCTS/SOLUTIONS/SERVICES OFFERED 69

TABLE 35 NETENT AB: KEY DEVELOPMENTS 69

TABLE 36 PADDY POWER BETFAIR PLC: PRODUCTS/SOLUTIONS/SERVICES OFFERED 71

TABLE 37 PADDY POWER BETFAIR PLC: KEY DEVELOPMENTS 71

TABLE 38 THE 888 GROUP: PRODUCTS/SOLUTIONS/SERVICES OFFERED 74

TABLE 39 THE 888 GROUP: KEY DEVELOPMENTS 74

TABLE 40 SCIENTIFIC GAMES: PRODUCTS/SOLUTIONS/SERVICES OFFERED 77

TABLE 41 LADBROKES: PRODUCTS/SOLUTIONS/SERVICES OFFERED 79

TABLE 42 ADDISON GLOBAL LIMITED: PRODUCTS/ SOLUTIONS/ SERVICES OFFERED 80

12 LIST OF FIGURES

FIGURE 1 MARKET ATTRACTIVENESS ANALYSIS: GLOBAL CASINO MARKET, 2020 14

FIGURE 2 GLOBAL CASINO MARKET: STRUCTURE 15

FIGURE 3 BOTTOM-UP AND TOP-DOWN APPROACHES 20

FIGURE 4 NORTH AMERICA: CASINO MARKET SIZE & MARKET SHARE, BY COUNTRY (2020-2027) 23

FIGURE 5 EUROPE: CASINO MARKET SIZE & MARKET SHARE, BY COUNTRY (2020-2027) 23

FIGURE 6 ASIA-PACIFIC: CASINO MARKET SIZE & MARKET SHARE, BY COUNTRY (2020-2027) 24

FIGURE 7 MARKET DYNAMIC ANALYSIS OF THE GLOBAL MOBILE GAMBLING MARKET 25

FIGURE 8 DRIVER IMPACT ANALYSIS 27

FIGURE 9 VALUE CHAIN: GLOBAL CASINO MARKET 29

FIGURE 10 PORTER’S FIVE FORCES MODEL: GLOBAL CASINO MARKET 30

FIGURE 11 GLOBAL CASINO MARKET, BY TYPE, 2020 (% SHARE) 32

FIGURE 12 GLOBAL CASINO MARKET, BY TYPE, 2020-2027 (USD MILLION) 32

FIGURE 13 GLOBAL CASINO MARKET, BY REGION, 2020 (% SHARE) 35

FIGURE 14 GLOBAL CASINO MARKET, BY REGION, 2020-2027 (USD MILLION) 36

FIGURE 15 COMPETITIVE BENCHMARKING ANALYSIS IN 2020 50

Purchase Option
Single User $ 4,950
Multiuser License $ 5,950
Enterprise User $ 7,250
Compare Licenses
Tailored for You
  • Dedicated Research on any specifics segment or region.
  • Focused Research on specific players in the market.
  • Custom Report based only on your requirements.
  • Flexibility to add or subtract any chapter in the study.
  • Historic data from 2014 and forecasts outlook till 2040.
  • Flexibility of providing data/insights in formats (PDF, PPT, Excel).
  • Provide cross segmentation in applicable scenario/markets.