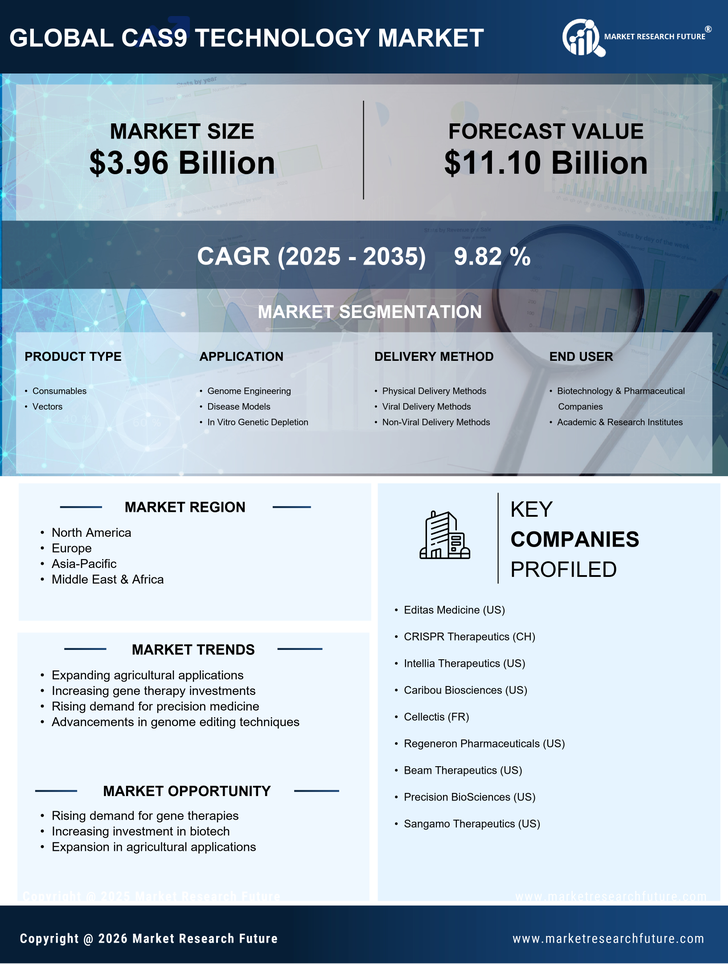
Certified Global Research Member
Isomar fd.webp Wcrc 57.webp
Key Questions Answered
  • Global Market Outlook
  • In-depth analysis of global and regional trends
  • Analyze and identify the major players in the market, their market share, key developments, etc.
  • To understand the capability of the major players based on products offered, financials, and strategies.
  • Identify disrupting products, companies, and trends.
  • To identify opportunities in the market.
  • Analyze the key challenges in the market.
  • Analyze the regional penetration of players, products, and services in the market.
  • Comparison of major players’ financial performance.
  • Evaluate strategies adopted by major players.
  • Recommendations
Why Choose Market Research Future?
  • Vigorous research methodologies for specific market.
  • Knowledge partners across the globe
  • Large network of partner consultants.
  • Ever-increasing/ Escalating data base with quarterly monitoring of various markets
  • Trusted by fortune 500 companies/startups/ universities/organizations
  • Large database of 5000+ markets reports.
  • Effective and prompt pre- and post-sales support.

CAS9 Technology Market Research Report: Information By Product Type (Consumables and Vectors), By Application (Genome Engineering, Disease Models, and In Vitro Genetic Depletion), By Delivery Method (Physical Delivery Methods, Viral Delivery Methods, and Non-Viral Delivery Methods), By End User (Biotechnology & Pharmaceutical Companies and Academic & Research Institutes) And By Region (North America, Europe, Asia-Pacific, And Rest Of The World) –Market Forecast Till 2032.


ID: MRFR/ICT/1532-CR | 153 Pages | Author: Ankit Gupta| February 2019


CAS9 Technology Market Segmentation


CAS9 Technology Product Type Outlook (USD Billion, 2018-2032)


  • Consumables


  • Vectors


CAS9 Technology Application Outlook (USD Billion, 2018-2032)


  • Genome Engineering


  • Disease Models


  • In Vitro Genetic Depletion


CAS9 Technology Delivery Method Outlook (USD Billion, 2018-2032)


  • Physical Delivery Methods


  • Viral Delivery Methods


  • Non-Viral Delivery Methods


CAS9 Technology End User Outlook (USD Billion, 2018-2032)


  • Biotechnology & Pharmaceutical Companies


  • Academic & Research Institutes


CAS9 Technology Regional Outlook (USD Billion, 2018-2032)


  • North AmericaOutlook (USD Billion, 2018-2032)


    • North America CAS9 Technology by Product Type


      • Consumables


      • Vectors


    • North America CAS9 Technology by Application


      • Genome Engineering


      • Disease Models


      • In Vitro Genetic Depletion


    • North America CAS9 Technology by Delivery Method


  • Physical Delivery Methods


  • Viral Delivery Methods


  • Non-Viral Delivery Methods


    • North America CAS9 Technology by End User


  • Biotechnology & Pharmaceutical Companies


  • Academic & Research Institutes


    • US Outlook (USD Billion, 2018-2032)


    • US CAS9 Technology by Product Type


      • Consumables


      • Vectors


    • US CAS9 Technology by Application


      • Genome Engineering


      • Disease Models


      • In Vitro Genetic Depletion


    • US CAS9 Technology by Delivery Method


  • Physical Delivery Methods


  • Viral Delivery Methods


  • Non-Viral Delivery Methods


  • US CAS9 Technology by End User


  • Biotechnology & Pharmaceutical Companies


  • Academic & Research Institutes


  • CANADA Outlook (USD Billion, 2018-2032)


    • CANADA CAS9 Technology by Product Type


      • Consumables


      • Vectors


    • CANADA CAS9 Technology by Application


      • Genome Engineering


      • Disease Models


      • In Vitro Genetic Depletion


    • CANADA CAS9 Technology by Delivery Method


  • Physical Delivery Methods


  • Viral Delivery Methods


  • Non-Viral Delivery Methods


    • CANADA CAS9 Technology by End User


  • Biotechnology & Pharmaceutical Companies


  • Academic & Research Institutes


  • Europe Outlook (USD Billion, 2018-2032)


    • Europe CAS9 Technology by Product Type


      • Consumables


      • Vectors


    • Europe CAS9 Technology by Application


      • Genome Engineering


      • Disease Models


      • In Vitro Genetic Depletion


    • Europe CAS9 Technology by Delivery Method


  • Physical Delivery Methods


  • Viral Delivery Methods


  • Non-Viral Delivery Methods


    • Europe CAS9 Technology by End User


  • Biotechnology & Pharmaceutical Companies


  • Academic & Research Institutes


  • Germany Outlook (USD Billion, 2018-2032)


    • Germany CAS9 Technology by Product Type


      • Consumables


      • Vectors


    • Germany CAS9 Technology by Application


      • Genome Engineering


      • Disease Models


      • In Vitro Genetic Depletion


    • Germany CAS9 Technology by Delivery Method


  • Physical Delivery Methods


  • Viral Delivery Methods


  • Non-Viral Delivery Methods


    • Germany CAS9 Technology by End User


  • Biotechnology & Pharmaceutical Companies


  • Academic & Research Institutes


  • France Outlook (USD Billion, 2018-2032)


    • France CAS9 Technology by Product Type


      • Consumables


      • Vectors


    • France CAS9 Technology by Application


      • Genome Engineering


      • Disease Models


      • In Vitro Genetic Depletion


    • France CAS9 Technology by Delivery Method


  • Physical Delivery Methods


  • Viral Delivery Methods


  • Non-Viral Delivery Methods


    • France CAS9 Technology by End User


  • Biotechnology & Pharmaceutical Companies


  • Academic & Research Institutes


  • UK Outlook (USD Billion, 2018-2032)


    • UK CAS9 Technology by Product Type


      • Consumables


      • Vectors


    • UK CAS9 Technology by Application


      • Genome Engineering


      • Disease Models


      • In Vitro Genetic Depletion


    • UK CAS9 Technology by Delivery Method


  • Physical Delivery Methods


  • Viral Delivery Methods


  • Non-Viral Delivery Methods


    • UK CAS9 Technology by End User


  • Biotechnology & Pharmaceutical Companies


  • Academic & Research Institutes


  • ITALY Outlook (USD Billion, 2018-2032)


    • ITALY CAS9 Technology by Product Type


      • Consumables


      • Vectors


    • ITALY CAS9 Technology by Application


      • Genome Engineering


      • Disease Models


      • In Vitro Genetic Depletion


    • ITALY CAS9 Technology by Delivery Method


  • Physical Delivery Methods


  • Viral Delivery Methods


  • Non-Viral Delivery Methods


    • ITALY CAS9 Technology by End User


  • Biotechnology & Pharmaceutical Companies


  • Academic & Research Institutes


  • SPAIN Outlook (USD Billion, 2018-2032)


    • Spain CAS9 Technology by Product Type


      • Consumables


      • Vectors


    • Spain CAS9 Technology by Application


      • Genome Engineering


      • Disease Models


      • In Vitro Genetic Depletion


    • Spain CAS9 Technology by Delivery Method


  • Physical Delivery Methods


  • Viral Delivery Methods


  • Non-Viral Delivery Methods


    • Spain CAS9 Technology by End User


  • Biotechnology & Pharmaceutical Companies


  • Academic & Research Institutes


  • Rest Of Europe Outlook (USD Billion, 2018-2032)


    • Rest Of Europe CAS9 Technology by Product Type


      • Consumables


      • Vectors


    • REST OF EUROPE CAS9 Technology by Application


      • Genome Engineering


      • Disease Models


      • In Vitro Genetic Depletion


    • REST OF EUROPE CAS9 Technology by Delivery Method


  • Physical Delivery Methods


  • Viral Delivery Methods


  • Non-Viral Delivery Methods


    • REST OF EUROPE CAS9 Technology by End User


  • Biotechnology & Pharmaceutical Companies


  • Academic & Research Institutes


  • Asia-Pacific Outlook (USD Billion, 2018-2032)


    • Asia-Pacific CAS9 Technology by Product Type


      • Consumables


      • Vectors


    • Asia-Pacific CAS9 Technology by Application


      • Genome Engineering


      • Disease Models


      • In Vitro Genetic Depletion


    • Asia-Pacific CAS9 Technology by Delivery Method


  • Physical Delivery Methods


  • Viral Delivery Methods


  • Non-Viral Delivery Methods


    • Asia-Pacific CAS9 Technology by End User


  • Biotechnology & Pharmaceutical Companies


  • Academic & Research Institutes


  • China Outlook (USD Billion, 2018-2032)


    • China CAS9 Technology by Product Type


      • Consumables


      • Vectors


    • China CAS9 Technology by Application


      • Genome Engineering


      • Disease Models


      • In Vitro Genetic Depletion


    • China CAS9 Technology by Delivery Method


  • Physical Delivery Methods


  • Viral Delivery Methods


  • Non-Viral Delivery Methods


    • China CAS9 Technology by End User


  • Biotechnology & Pharmaceutical Companies


  • Academic & Research Institutes


  • Japan Outlook (USD Billion, 2018-2032)


    • Japan CAS9 Technology by Product Type


      • Consumables


      • Vectors


    • Japan CAS9 Technology by Application


      • Genome Engineering


      • Disease Models


      • In Vitro Genetic Depletion


    • Japan CAS9 Technology by Delivery Method


  • Physical Delivery Methods


  • Viral Delivery Methods


  • Non-Viral Delivery Methods


    • Japan CAS9 Technology by End User


  • Biotechnology & Pharmaceutical Companies


  • Academic & Research Institutes


  • India Outlook (USD Billion, 2018-2032)


    • India CAS9 Technology by Product Type


      • Consumables


      • Vectors


    • India CAS9 Technology by Application


      • Genome Engineering


      • Disease Models


      • In Vitro Genetic Depletion


    • India CAS9 Technology by Delivery Method


  • Physical Delivery Methods


  • Viral Delivery Methods


  • Non-Viral Delivery Methods


    • India CAS9 Technology by End User


  • Biotechnology & Pharmaceutical Companies


  • Academic & Research Institutes


  • Australia Outlook (USD Billion, 2018-2032)


    • Australia CAS9 Technology by Product Type


      • Consumables


      • Vectors


    • Australia CAS9 Technology by Application


      • Genome Engineering


      • Disease Models


      • In Vitro Genetic Depletion


    • Australia CAS9 Technology by Delivery Method


  • Physical Delivery Methods


  • Viral Delivery Methods


  • Non-Viral Delivery Methods


    • Australia CAS9 Technology by End User


  • Biotechnology & Pharmaceutical Companies


  • Academic & Research Institutes


  • Rest of Asia-Pacific Outlook (USD Billion, 2018-2032)


    • Rest of Asia-Pacific CAS9 Technology by Product Type


      • Consumables


      • Vectors


    • Rest of Asia-Pacific CAS9 Technology by Application


      • Genome Engineering


      • Disease Models


      • In Vitro Genetic Depletion


    • Rest of Asia-Pacific CAS9 Technology by Delivery Method


  • Physical Delivery Methods


  • Viral Delivery Methods


  • Non-Viral Delivery Methods


    • Rest of Asia-Pacific CAS9 Technology by End User


  • Biotechnology & Pharmaceutical Companies


  • Academic & Research Institutes


  • Rest of the World Outlook (USD Billion, 2018-2032)


    • Rest of the World CAS9 Technology by Product Type


      • Consumables


      • Vectors


    • Rest of the World CAS9 Technology by Application


      • Genome Engineering


      • Disease Models


      • In Vitro Genetic Depletion


    • Rest of the World CAS9 Technology by Delivery Method


  • Physical Delivery Methods


  • Viral Delivery Methods


  • Non-Viral Delivery Methods


    • Rest of the World CAS9 Technology by End User


  • Biotechnology & Pharmaceutical Companies


  • Academic & Research Institutes


  • Middle East Outlook (USD Billion, 2018-2032)


    • Middle East CAS9 Technology by Product Type


      • Consumables


      • Vectors


    • Middle East CAS9 Technology by Application


      • Genome Engineering


      • Disease Models


      • In Vitro Genetic Depletion


    • Middle East CAS9 Technology by Delivery Method


  • Physical Delivery Methods


  • Viral Delivery Methods


  • Non-Viral Delivery Methods


    • Middle East CAS9 Technology by End User


  • Biotechnology & Pharmaceutical Companies


  • Academic & Research Institutes


  • Africa Outlook (USD Billion, 2018-2032)


    • Africa CAS9 Technology by Product Type


      • Consumables


      • Vectors


    • Africa CAS9 Technology by Application


      • Genome Engineering


      • Disease Models


      • In Vitro Genetic Depletion


    • Africa CAS9 Technology by Delivery Method


  • Physical Delivery Methods


  • Viral Delivery Methods


  • Non-Viral Delivery Methods


    • Africa CAS9 Technology by End User


  • Biotechnology & Pharmaceutical Companies


  • Academic & Research Institutes


  • Latin America Outlook (USD Billion, 2018-2032)


    • Latin America CAS9 Technology by Product Type


      • Consumables


      • Vectors


    • Latin America CAS9 Technology by Application


      • Genome Engineering


      • Disease Models


      • In Vitro Genetic Depletion


    • Latin America CAS9 Technology by Delivery Method


  • Physical Delivery Methods


  • Viral Delivery Methods


  • Non-Viral Delivery Methods


    • Latin America CAS9 Technology by End User


  • Biotechnology & Pharmaceutical Companies


  • Academic & Research Institutes


Leading companies partner with us for data-driven Insights
client_1 client_2 client_3 client_4 client_5 client_6 client_7 client_8 client_9 client_10
Please fill in Business Email for Quick Response

1 Report Prologue

2 Market Introduction

2.1 Scope of Study 18

2.2 Research Objective 18

2.3 List of Assumptions 18

3 Research Methodology

3.1 Research Process 21

3.2 Primary Research 22

3.3 Secondary Research 23

3.4 Market Size Estimation 24

4 Market Dynamics

4.1 Introduction 26

4.2 Drivers 26

4.2.1 Growing biotechnology sector followed by rising investments in the CAS9 technology supports

the market growth 26

4.2.2 Diversified applicability of the CAS9 technology enhances the potential for the market to expand 27

4.2.3 Rising acceptance of gene therapy-based treatments boosts the entry of Cas9 technology into

the medical sector 27

4.2.4 Drivers Impact Analysis 28

4.3 Restraints 28

4.3.1 Undefined regulatory framework creates a confusion in the adoption of the technology 28

4.3.2 Lack of awareness along with associated risk factors and the high cost of implementation restrain

the growth of the Cas9 technology market 28

4.3.3 Restraints Impact Analysis 29

4.4 Opportunity 29

4.4.1 Growing biotechnology sector in developing economies such as India 29

5 Market Factor Analysis

5.1 Value Chain Analysis 31

5.1.1 R&D and Designing 31

5.1.2 Manufacturing 31

5.1.3 Distribution & Sales 32

5.1.4 Post-Sales Review 32

5.2 Porter’s Five Forces Model 33

5.2.1 Threat of New Entrants 33

5.2.2 Bargaining Power of Suppliers 33

5.2.3 Threat of Substitutes 34

5.2.4 Bargaining Power of Buyers 34

5.2.5 Intensity of Rivalry 34

5.3 Industry Trends 35

5.3.1 The CAS9 technology is revolutionizing genome engineering 35

5.3.2 Funding Scenario 35

6 Global CAS9 Technology Market, by Product Type

6.1 Introduction 37

6.2 Consumables 38

6.3 Vectors 38

7 Global CAS9 Technology Market, by Application

7.1 Introduction 40

7.2 Genome engineering 41

7.3 Disease Models 41

7.4 In vitro genetic depletion 42

8 Global CAS9 Technology Market, by Delivery Method

8.1 Introduction 44

8.2 Physical Delivery Methods 45

8.3 Viral Delivery Methods 45

8.4 Non-Viral Delivery Methods 45

9 Global CAS9 Technology Market, by End User

9.1 Introduction 47

9.2 Biotechnology & Pharmaceutical Companies 48

9.3 Academic & Research Institutes 48

10 Global CAS9 Technology Market, by Regions

10.1 Introduction 50

10.2 Americas 51

10.2.1 North America 54

10.2.1.1 U.S 56

10.2.1.2 Canada 59

10.2.2 South America 61

10.3 Europe 64

10.3.1 Western Europe 67

10.3.1.1 Germany 70

10.3.1.2 U.K 72

10.3.1.3 France 75

10.3.1.4 Italy 77

10.3.1.5 Spain 80

10.3.1.6 Rest of Western Europe 82

10.3.2 Eastern Europe 85

10.4 Asia Pacific 88

10.4.1 Japan 91

10.4.2 China 93

10.4.3 India 96

10.4.4 Australia 98

10.4.5 South Korea 101

10.4.6 Rest of Asia Pacific 103

10.5 Middle East & Africa 106

10.5.1 Middle East 109

10.5.2 Africa 111

11 Competitive Landscape

11.1 Introduction 115

12 Company Profiles

12.1 abm Inc. 117

12.1.1 Financial Overview 117

12.1.2 Products Offering 117

12.1.3 Key Developments 117

12.1.4 SWOT Analysis 118

12.1.5 Key Strategy 118

12.2 Cellecta, Inc. 119

12.2.1 Company Overview 119

12.2.2 Financial Overview 119

12.2.3 Products Offering 119

12.2.4 Key Developments 120

12.2.5 SWOT Analysis 120

12.2.6 Key Strategy 120

12.3 CRISPR Therapeutics 121

12.3.1 Company Overview 121

12.3.2 Financial Overview 121

12.3.3 Key Developments 121

12.3.4 SWOT Analysis 122

12.3.5 Key Strategy 122

12.4 GenScript 123

12.4.1 Company Overview 123

12.4.2 Financial Overview 123

12.4.3 Products Offering 124

12.4.4 Key Developments 124

12.4.5 SWOT Analysis 125

12.4.6 Key Strategy 125

12.5 Danaher Corporation (Integrated DNA Technologies, Inc.) 126

12.5.1 Company Overview 126

12.5.2 Financial Overview 126

12.5.3 Products Offering 127

12.5.4 Key Developments 127

12.5.5 SWOT Analysis 128

12.5.6 Key Strategy 128

12.6 Intellia Therapeutics, Inc. 129

12.6.1 Company Overview 129

12.6.2 Financial Overview 129

12.6.3 Pipeline Products 129

12.6.4 Key Developments 130

12.6.5 SWOT Analysis 130

12.6.6 Key Strategy 130

12.7 New England Biolabs 131

12.7.1 Company Overview 131

12.7.2 Financial Overview: 131

12.7.3 Products Offering 131

12.7.4 Key Developments 131

12.7.5 SWOT Analysis 132

12.7.6 Key Strategy 132

12.8 GE Healthcare 133

12.8.1 Company Overview 133

12.8.2 Financial Overview 133

12.8.3 Products Offering 134

12.8.4 Key Developments 134

12.8.5 SWOT Analysis 134

12.8.6 Key Strategy 134

12.9 OriGene Technologies, Inc. 135

12.9.1 Company Overview 135

12.9.2 Financial Overview 135

12.9.3 Products Offering 135

12.9.4 Key Developments 135

12.9.5 SWOT Analysis 136

12.9.6 Key Strategy 136

12.10 Takara Bio, Inc. 137

12.10.1 Company Overview 137

12.10.2 Financial Overview 137

12.10.3 Products Offering 138

12.10.4 Key Developments 138

12.10.5 SWOT Analysis 138

12.10.6 Key Strategy 138

12.11 Lonza Group 139

12.11.1 Company Overview 139

12.11.2 Financial Overview 139

12.11.3 Products Offering 140

12.11.4 Key Developments 140

12.11.5 SWOT Analysis 140

12.11.6 Key Strategy 140

12.12 Thermo Fisher Scientific 141

12.12.1 Company Overview 141

12.12.2 Financial Overview 141

12.12.3 Products Offering 142

12.12.4 Key Developments 142

12.12.5 SWOT Analysis 142

12.12.6 Key Strategy 143

12.13 AstraZeneca, PLC 144

12.13.1 Company Overview 144

12.13.2 Financial Overview 144

12.13.3 Products Offering 145

12.13.4 Key Developments 145

12.13.5 SWOT Analysis 145

12.13.6 Key Strategy 145

12.14 Merck KGaA 146

12.14.1 Company Overview 146

12.14.2 Financial Overview 146

12.14.3 Products Offering 147

12.14.4 Key Developments 147

12.14.5 SWOT Analysis 147

12.14.6 Key Strategy 147

12.15 Bio-Rad Laboratories, Inc. 148

12.15.1 Company Overview 148

12.15.2 Financial Overview 148

12.15.3 Products Offering 149

12.15.4 Key Developments 149

12.15.5 SWOT Analysis 149

12.15.6 Key Strategy 149

13 Appendix

13.1 Discussion Blue Print 151

14 List of Tables

TABLE 1 LIST OF ASSUMPTIONS 18

TABLE 2 PRIMARY INTERVIEWS 21

TABLE 3 GLOBAL CAS9 TECHNOLOGY MARKET BY PRODUCT TYPE 2020-2027 (USD MILLION) 37

TABLE 4 GLOBAL CAS9 TECHNOLOGY MARKET FOR CONSUMABLES 2020-2027 (USD MILLION) 38

TABLE 5 GLOBAL CAS9 TECHNOLOGY MARKET FOR VECTORS 2020-2027 (USD MILLION) 38

TABLE 6 GLOBAL CAS9 TECHNOLOGY MARKET BY APPLICATION 2020-2027 (USD MILLION) 40

TABLE 7 GLOBAL CAS9 TECHNOLOGY MARKET FOR GENOME ENGINEERING 2020-2027 (USD MILLION) 41

TABLE 8 GLOBAL CAS9 TECHNOLOGY MARKET FOR DISEASE MODELS 2020-2027 (USD MILLION) 41

TABLE 9 GLOBAL CAS9 TECHNOLOGY MARKET FOR IN VITRO GENETIC DEPLETION 2020-2027 (USD MILLION) 42

TABLE 10 GLOBAL CAS9 TECHNOLOGY MARKET BY DELIVERY METHOD 2020-2027 (USD MILLION) 44

TABLE 11 GLOBAL CAS9 TECHNOLOGY MARKET FOR PHYSICAL DELIVERY METHODS 2020-2027 (USD MILLION) 45

TABLE 12 GLOBAL CAS9 TECHNOLOGY MARKET FOR VIRAL DELIVERY METHODS 2020-2027 (USD MILLION) 45

TABLE 13 GLOBAL CAS9 TECHNOLOGY MARKET FOR NON-VIRAL DELIVERY METHODS 2020-2027 (USD MILLION) 45

TABLE 14 GLOBAL CAS9 TECHNOLOGY MARKET BY END USER 2020-2027 (USD MILLION) 47

TABLE 15 GLOBAL CAS9 TECHNOLOGY MARKET FOR BIOTECHNOLOGY & PHARMACEUTICAL COMPANIES 2020-2027 (USD MILLION) 48

TABLE 16 GLOBAL CAS9 TECHNOLOGY MARKET FOR ACADEMIC & RESEARCH INSTITUTES 2020-2027 (USD MILLION) 48

TABLE 17 GLOBAL CAS9 TECHNOLOGY MARKET BY REGIONS 2020-2027 (USD MILLION) 50

TABLE 18 AMERICAS CAS9 TECHNOLOGY MARKET BY REGIONS 2020-2027 (USD MILLION) 51

TABLE 19 AMERICAS CAS9 TECHNOLOGY MARKET BY PRODUCT TYPE 2020-2027 (USD MILLION) 52

TABLE 20 AMERICAS CAS9 TECHNOLOGY MARKET BY APPLICATION 2020-2027 (USD MILLION) 52

TABLE 21 AMERICAS CAS9 TECHNOLOGY MARKET BY DELIVERY METHOD 2020-2027 (USD MILLION) 52

TABLE 22 AMERICAS CAS9 TECHNOLOGY MARKET BY PHYSICAL DELIVERY METHODS 2020-2027 (USD MILLION) 52

TABLE 23 AMERICAS CAS9 TECHNOLOGY MARKET BY VIRAL DELIVERY METHOD 2020-2027 (USD MILLION) 53

TABLE 24 AMERICAS CAS9 TECHNOLOGY MARKET BY NON-VIRAL DELIVERY METHOD 2020-2027 (USD MILLION) 53

TABLE 25 AMERICAS CAS9 TECHNOLOGY MARKET BY END USER 2020-2027 (USD MILLION) 53

TABLE 26 AMERICAS CAS9 TECHNOLOGY MARKET BY COUNTRY 2020-2027 (USD MILLION) 54

TABLE 27 NORTH AMERICA CAS9 TECHNOLOGY MARKET BY PRODUCT TYPE 2020-2027 (USD MILLION) 54

TABLE 28 NORTH AMERICA CAS9 TECHNOLOGY MARKET BY APPLICATION 2020-2027 (USD MILLION) 54

TABLE 29 NORTH AMERICA CAS9 TECHNOLOGY MARKET BY DELIVERY METHOD 2020-2027 (USD MILLION) 54

TABLE 30 NORTH AMERICA CAS9 TECHNOLOGY MARKET BY PHYSICAL DELIVERY METHODS 2020-2027 (USD MILLION) 55

TABLE 31 NORTH AMERICA CAS9 TECHNOLOGY MARKET BY VIRAL DELIVERY METHOD 2020-2027 (USD MILLION) 55

TABLE 32 NORTH AMERICA CAS9 TECHNOLOGY MARKET BY NON-VIRAL DELIVERY METHOD 2020-2027 (USD MILLION) 55

TABLE 33 NORTH AMERICA CAS9 TECHNOLOGY MARKET BY END USER 2020-2027 (USD MILLION) 56

TABLE 34 U.S CAS9 TECHNOLOGY MARKET BY PRODUCT TYPE 2020-2027 (USD MILLION) 56

TABLE 35 U.S CAS9 TECHNOLOGY MARKET BY APPLICATION 2020-2027 (USD MILLION) 56

TABLE 36 U.S CAS9 TECHNOLOGY MARKET BY DELIVERY METHOD 2020-2027 (USD MILLION) 57

TABLE 37 U.S CAS9 TECHNOLOGY MARKET BY PHYSICAL DELIVERY METHODS 2020-2027 (USD MILLION) 57

TABLE 38 U.S CAS9 TECHNOLOGY MARKET BY VIRAL DELIVERY METHOD 2020-2027 (USD MILLION) 57

TABLE 39 U.S CAS9 TECHNOLOGY MARKET BY NON-VIRAL DELIVERY METHOD 2020-2027 (USD MILLION) 58

TABLE 40 U.S CAS9 TECHNOLOGY MARKET BY END USER 2020-2027 (USD MILLION) 58

TABLE 41 CANADA CAS9 TECHNOLOGY MARKET BY PRODUCT TYPE 2020-2027 (USD MILLION) 59

TABLE 42 CANADA CAS9 TECHNOLOGY MARKET BY APPLICATION 2020-2027 (USD MILLION) 59

TABLE 43 CANADA CAS9 TECHNOLOGY MARKET BY DELIVERY METHOD 2020-2027 (USD MILLION) 59

TABLE 44 CANADA CAS9 TECHNOLOGY MARKET BY PHYSICAL DELIVERY METHODS 2020-2027 (USD MILLION) 60

TABLE 45 CANADA CAS9 TECHNOLOGY MARKET BY VIRAL DELIVERY METHOD 2020-2027 (USD MILLION) 60

TABLE 46 CANADA CAS9 TECHNOLOGY MARKET BY NON-VIRAL DELIVERY METHOD 2020-2027 (USD MILLION) 60

TABLE 47 CANADA CAS9 TECHNOLOGY MARKET BY END USER 2020-2027 (USD MILLION) 61

TABLE 48 SOUTH AMERICA CAS9 TECHNOLOGY MARKET BY PRODUCT TYPE 2020-2027 (USD MILLION) 61

TABLE 49 SOUTH AMERICA CAS9 TECHNOLOGY MARKET BY APPLICATION 2020-2027 (USD MILLION) 61

TABLE 50 SOUTH AMERICA CAS9 TECHNOLOGY MARKET BY DELIVERY METHOD 2020-2027 (USD MILLION) 62

TABLE 51 SOUTH AMERICA CAS9 TECHNOLOGY MARKET BY PHYSICAL DELIVERY METHODS 2020-2027 (USD MILLION) 62

TABLE 52 SOUTH AMERICA CAS9 TECHNOLOGY MARKET BY VIRAL DELIVERY METHOD 2020-2027 (USD MILLION) 62

TABLE 53 SOUTH AMERICA CAS9 TECHNOLOGY MARKET BY NON-VIRAL DELIVERY METHOD 2020-2027 (USD MILLION) 63

TABLE 54 SOUTH AMERICA CAS9 TECHNOLOGY MARKET BY END USER 2020-2027 (USD MILLION) 63

TABLE 55 EUROPE CAS9 TECHNOLOGY MARKET BY REGIONS 2020-2027 (USD MILLION) 64

TABLE 56 EUROPE CAS9 TECHNOLOGY MARKET BY PRODUCT TYPE 2020-2027 (USD MILLION) 64

TABLE 57 EUROPE CAS9 TECHNOLOGY MARKET BY APPLICATION 2020-2027 (USD MILLION) 65

TABLE 58 EUROPE CAS9 TECHNOLOGY MARKET BY DELIVERY METHOD 2020-2027 (USD MILLION) 65

TABLE 59 EUROPE CAS9 TECHNOLOGY MARKET BY PHYSICAL DELIVERY METHODS 2020-2027 (USD MILLION) 65

TABLE 60 EUROPE CAS9 TECHNOLOGY MARKET BY VIRAL DELIVERY METHOD 2020-2027 (USD MILLION) 66

TABLE 61 EUROPE CAS9 TECHNOLOGY MARKET BY NON-VIRAL DELIVERY METHOD 2020-2027 (USD MILLION) 66

TABLE 62 EUROPE CAS9 TECHNOLOGY MARKET BY END USER 2020-2027 (USD MILLION) 66

TABLE 63 WESTERN EUROPE CAS9 TECHNOLOGY MARKET BY COUNTRY 2020-2027 (USD MILLION) 67

TABLE 64 WESTERN EUROPE CAS9 TECHNOLOGY MARKET BY PRODUCT TYPE 2020-2027 (USD MILLION) 67

TABLE 65 WESTERN EUROPE CAS9 TECHNOLOGY MARKET BY APPLICATION 2020-2027 (USD MILLION) 67

TABLE 66 WESTERN EUROPE CAS9 TECHNOLOGY MARKET BY DELIVERY METHOD 2020-2027 (USD MILLION) 68

TABLE 67 WESTERN EUROPE CAS9 TECHNOLOGY MARKET BY PHYSICAL DELIVERY METHODS 2020-2027 (USD MILLION) 68

TABLE 68 WESTERN EUROPE CAS9 TECHNOLOGY MARKET BY VIRAL DELIVERY METHOD 2020-2027 (USD MILLION) 68

TABLE 69 WESTERN EUROPE CAS9 TECHNOLOGY MARKET BY NON-VIRAL DELIVERY METHOD 2020-2027 (USD MILLION) 69

TABLE 70 WESTERN EUROPE CAS9 TECHNOLOGY MARKET BY END USER 2020-2027 (USD MILLION) 69

TABLE 71 GERMANY CAS9 TECHNOLOGY MARKET BY PRODUCT TYPE 2020-2027 (USD MILLION) 70

TABLE 72 GERMANY CAS9 TECHNOLOGY MARKET BY APPLICATION 2020-2027 (USD MILLION) 70

TABLE 73 GERMANY CAS9 TECHNOLOGY MARKET BY DELIVERY METHOD 2020-2027 (USD MILLION) 70

TABLE 74 GERMANY CAS9 TECHNOLOGY MARKET BY PHYSICAL DELIVERY METHODS 2020-2027 (USD MILLION) 71

TABLE 75 GERMANY CAS9 TECHNOLOGY MARKET BY VIRAL DELIVERY METHOD 2020-2027 (USD MILLION) 71

TABLE 76 GERMANY CAS9 TECHNOLOGY MARKET BY NON-VIRAL DELIVERY METHOD 2020-2027 (USD MILLION) 71

TABLE 77 GERMANY CAS9 TECHNOLOGY MARKET BY END USER 2020-2027 (USD MILLION) 72

TABLE 78 U.K CAS9 TECHNOLOGY MARKET BY PRODUCT TYPE 2020-2027 (USD MILLION) 72

TABLE 79 U.K CAS9 TECHNOLOGY MARKET BY APPLICATION 2020-2027 (USD MILLION) 72

TABLE 80 U.K CAS9 TECHNOLOGY MARKET BY DELIVERY METHOD 2020-2027 (USD MILLION) 73

TABLE 81 U.K CAS9 TECHNOLOGY MARKET BY PHYSICAL DELIVERY METHODS 2020-2027 (USD MILLION) 73

TABLE 82 U.K CAS9 TECHNOLOGY MARKET BY VIRAL DELIVERY METHOD 2020-2027 (USD MILLION) 73

TABLE 83 U.K CAS9 TECHNOLOGY MARKET BY NON-VIRAL DELIVERY METHOD 2020-2027 (USD MILLION) 74

TABLE 84 U.K CAS9 TECHNOLOGY MARKET BY END USER 2020-2027 (USD MILLION) 74

TABLE 85 FRANCE CAS9 TECHNOLOGY MARKET BY PRODUCT TYPE 2020-2027 (USD MILLION) 75

TABLE 86 FRANCE CAS9 TECHNOLOGY MARKET BY APPLICATION 2020-2027 (USD MILLION) 75

TABLE 87 FRANCE CAS9 TECHNOLOGY MARKET BY DELIVERY METHOD 2020-2027 (USD MILLION) 75

TABLE 88 FRANCE CAS9 TECHNOLOGY MARKET BY PHYSICAL DELIVERY METHODS 2020-2027 (USD MILLION) 76

TABLE 89 FRANCE CAS9 TECHNOLOGY MARKET BY VIRAL DELIVERY METHOD 2020-2027 (USD MILLION) 76

TABLE 90 FRANCE CAS9 TECHNOLOGY MARKET BY NON-VIRAL DELIVERY METHOD 2020-2027 (USD MILLION) 76

TABLE 91 FRANCE CAS9 TECHNOLOGY MARKET BY END USER 2020-2027 (USD MILLION) 77

TABLE 92 ITALY CAS9 TECHNOLOGY MARKET BY PRODUCT TYPE 2020-2027 (USD MILLION) 77

TABLE 93 ITALY CAS9 TECHNOLOGY MARKET BY APPLICATION 2020-2027 (USD MILLION) 77

TABLE 94 ITALY CAS9 TECHNOLOGY MARKET BY DELIVERY METHOD 2020-2027 (USD MILLION) 78

TABLE 95 ITALY CAS9 TECHNOLOGY MARKET BY PHYSICAL DELIVERY METHODS 2020-2027 (USD MILLION) 78

TABLE 96 ITALY CAS9 TECHNOLOGY MARKET BY VIRAL DELIVERY METHOD 2020-2027 (USD MILLION) 78

TABLE 97 ITALY CAS9 TECHNOLOGY MARKET BY NON-VIRAL DELIVERY METHOD 2020-2027 (USD MILLION) 79

TABLE 98 ITALY CAS9 TECHNOLOGY MARKET BY END USER 2020-2027 (USD MILLION) 79

TABLE 99 SPAIN CAS9 TECHNOLOGY MARKET BY PRODUCT TYPE 2020-2027 (USD MILLION) 80

TABLE 100 SPAIN CAS9 TECHNOLOGY MARKET BY APPLICATION 2020-2027 (USD MILLION) 80

TABLE 101 SPAIN CAS9 TECHNOLOGY MARKET BY DELIVERY METHOD 2020-2027 (USD MILLION) 80

TABLE 102 SPAIN CAS9 TECHNOLOGY MARKET BY PHYSICAL DELIVERY METHODS 2020-2027 (USD MILLION) 81

TABLE 103 SPAIN CAS9 TECHNOLOGY MARKET BY VIRAL DELIVERY METHOD 2020-2027 (USD MILLION) 81

TABLE 104 SPAIN CAS9 TECHNOLOGY MARKET BY NON-VIRAL DELIVERY METHOD 2020-2027 (USD MILLION) 81

TABLE 105 SPAIN CAS9 TECHNOLOGY MARKET BY END USER 2020-2027 (USD MILLION) 82

TABLE 106 REST OF WESTERN EUROPE CAS9 TECHNOLOGY MARKET BY PRODUCT TYPE 2020-2027 (USD MILLION) 82

TABLE 107 REST OF WESTERN EUROPE CAS9 TECHNOLOGY MARKET BY APPLICATION 2020-2027 (USD MILLION) 82

TABLE 108 REST OF WESTERN EUROPE CAS9 TECHNOLOGY MARKET BY DELIVERY METHOD 2020-2027 (USD MILLION) 83

TABLE 109 REST OF WESTERN EUROPE CAS9 TECHNOLOGY MARKET BY PHYSICAL DELIVERY METHODS 2020-2027 (USD MILLION) 83

TABLE 110 REST OF WESTERN EUROPE CAS9 TECHNOLOGY MARKET BY VIRAL DELIVERY METHOD 2020-2027 (USD MILLION) 83

TABLE 111 REST OF WESTERN EUROPE CAS9 TECHNOLOGY MARKET BY NON-VIRAL DELIVERY METHOD 2020-2027 (USD MILLION) 84

TABLE 112 REST OF WESTERN EUROPE CAS9 TECHNOLOGY MARKET BY END USER 2020-2027 (USD MILLION) 84

TABLE 113 EASTERN EUROPE CAS9 TECHNOLOGY MARKET BY PRODUCT TYPE 2020-2027 (USD MILLION) 85

TABLE 114 EASTERN EUROPE CAS9 TECHNOLOGY MARKET BY APPLICATION 2020-2027 (USD MILLION) 85

TABLE 115 EASTERN EUROPE CAS9 TECHNOLOGY MARKET BY DELIVERY METHOD 2020-2027 (USD MILLION) 85

TABLE 116 EASTERN EUROPE CAS9 TECHNOLOGY MARKET BY PHYSICAL DELIVERY METHODS 2020-2027 (USD MILLION) 86

TABLE 117 EASTERN EUROPE CAS9 TECHNOLOGY MARKET BY VIRAL DELIVERY METHOD 2020-2027 (USD MILLION) 86

TABLE 118 EASTERN EUROPE CAS9 TECHNOLOGY MARKET BY NON-VIRAL DELIVERY METHOD 2020-2027 (USD MILLION) 86

TABLE 119 EASTERN EUROPE CAS9 TECHNOLOGY MARKET BY END USER 2020-2027 (USD MILLION) 87

TABLE 120 ASIA PACIFIC CAS9 TECHNOLOGY MARKET BY REGIONS 2020-2027 (USD MILLION) 88

TABLE 121 ASIA PACIFIC CAS9 TECHNOLOGY MARKET BY PRODUCT TYPE 2020-2027 (USD MILLION) 88

TABLE 122 ASIA PACIFIC CAS9 TECHNOLOGY MARKET BY APPLICATION 2020-2027 (USD MILLION) 89

TABLE 123 ASIA PACIFIC CAS9 TECHNOLOGY MARKET BY DELIVERY METHOD 2020-2027 (USD MILLION) 89

TABLE 124 ASIA PACIFIC CAS9 TECHNOLOGY MARKET BY PHYSICAL DELIVERY METHODS 2020-2027 (USD MILLION) 89

TABLE 125 ASIA PACIFIC CAS9 TECHNOLOGY MARKET BY VIRAL DELIVERY METHOD 2020-2027 (USD MILLION) 90

TABLE 126 ASIA PACIFIC CAS9 TECHNOLOGY MARKET BY NON-VIRAL DELIVERY METHOD 2020-2027 (USD MILLION) 90

TABLE 127 ASIA PACIFIC CAS9 TECHNOLOGY MARKET BY END USER 2020-2027 (USD MILLION) 90

TABLE 128 JAPAN CAS9 TECHNOLOGY MARKET BY PRODUCT TYPE 2020-2027 (USD MILLION) 91

TABLE 129 JAPAN CAS9 TECHNOLOGY MARKET BY APPLICATION 2020-2027 (USD MILLION) 91

TABLE 130 JAPAN CAS9 TECHNOLOGY MARKET BY DELIVERY METHOD 2020-2027 (USD MILLION) 91

TABLE 131 JAPAN CAS9 TECHNOLOGY MARKET BY PHYSICAL DELIVERY METHODS 2020-2027 (USD MILLION) 92

TABLE 132 JAPAN CAS9 TECHNOLOGY MARKET BY VIRAL DELIVERY METHOD 2020-2027 (USD MILLION) 92

TABLE 133 JAPAN CAS9 TECHNOLOGY MARKET BY NON-VIRAL DELIVERY METHOD 2020-2027 (USD MILLION) 92

TABLE 134 JAPAN CAS9 TECHNOLOGY MARKET BY END USER 2020-2027 (USD MILLION) 93

TABLE 135 CHINA CAS9 TECHNOLOGY MARKET BY PRODUCT TYPE 2020-2027 (USD MILLION) 93

TABLE 136 CHINA CAS9 TECHNOLOGY MARKET BY APPLICATION 2020-2027 (USD MILLION) 93

TABLE 137 CHINA CAS9 TECHNOLOGY MARKET BY DELIVERY METHOD 2020-2027 (USD MILLION) 94

TABLE 138 CHINA CAS9 TECHNOLOGY MARKET BY PHYSICAL DELIVERY METHODS 2020-2027 (USD MILLION) 94

TABLE 139 CHINA CAS9 TECHNOLOGY MARKET BY VIRAL DELIVERY METHOD 2020-2027 (USD MILLION) 94

TABLE 140 CHINA CAS9 TECHNOLOGY MARKET BY NON-VIRAL DELIVERY METHOD 2020-2027 (USD MILLION) 95

TABLE 141 CHINA CAS9 TECHNOLOGY MARKET BY END USER 2020-2027 (USD MILLION) 95

TABLE 142 INDIA CAS9 TECHNOLOGY MARKET BY PRODUCT TYPE 2020-2027 (USD MILLION) 96

TABLE 143 INDIA CAS9 TECHNOLOGY MARKET BY APPLICATION 2020-2027 (USD MILLION) 96

TABLE 144 INDIA CAS9 TECHNOLOGY MARKET BY DELIVERY METHOD 2020-2027 (USD MILLION) 96

TABLE 145 INDIA CAS9 TECHNOLOGY MARKET BY PHYSICAL DELIVERY METHODS 2020-2027 (USD MILLION) 97

TABLE 146 INDIA CAS9 TECHNOLOGY MARKET BY VIRAL DELIVERY METHOD 2020-2027 (USD MILLION) 97

TABLE 147 INDIA CAS9 TECHNOLOGY MARKET BY NON-VIRAL DELIVERY METHOD 2020-2027 (USD MILLION) 97

TABLE 148 INDIA CAS9 TECHNOLOGY MARKET BY END USER 2020-2027 (USD MILLION) 98

TABLE 149 AUSTRALIA CAS9 TECHNOLOGY MARKET BY PRODUCT TYPE 2020-2027 (USD MILLION) 98

TABLE 150 AUSTRALIA CAS9 TECHNOLOGY MARKET BY APPLICATION 2020-2027 (USD MILLION) 98

TABLE 151 AUSTRALIA CAS9 TECHNOLOGY MARKET BY DELIVERY METHOD 2020-2027 (USD MILLION) 99

TABLE 152 AUSTRALIA CAS9 TECHNOLOGY MARKET BY PHYSICAL DELIVERY METHODS 2020-2027 (USD MILLION) 99

TABLE 153 AUSTRALIA CAS9 TECHNOLOGY MARKET BY VIRAL DELIVERY METHOD 2020-2027 (USD MILLION) 99

TABLE 154 AUSTRALIA CAS9 TECHNOLOGY MARKET BY NON-VIRAL DELIVERY METHOD 2020-2027 (USD MILLION) 100

TABLE 155 AUSTRALIA CAS9 TECHNOLOGY MARKET BY END USER 2020-2027 (USD MILLION) 100

TABLE 156 SOUTH KOREA CAS9 TECHNOLOGY MARKET BY PRODUCT TYPE 2020-2027 (USD MILLION) 101

TABLE 157 SOUTH KOREA CAS9 TECHNOLOGY MARKET BY APPLICATION 2020-2027 (USD MILLION) 101

TABLE 158 SOUTH KOREA CAS9 TECHNOLOGY MARKET BY DELIVERY METHOD 2020-2027 (USD MILLION) 101

TABLE 159 SOUTH KOREA CAS9 TECHNOLOGY MARKET BY PHYSICAL DELIVERY METHODS 2020-2027 (USD MILLION) 102

TABLE 160 SOUTH KOREA CAS9 TECHNOLOGY MARKET BY VIRAL DELIVERY METHOD 2020-2027 (USD MILLION) 102

TABLE 161 SOUTH KOREA CAS9 TECHNOLOGY MARKET BY NON-VIRAL DELIVERY METHOD 2020-2027 (USD MILLION) 102

TABLE 162 SOUTH KOREA CAS9 TECHNOLOGY MARKET BY END USER 2020-2027 (USD MILLION) 103

TABLE 163 REST OF ASIA PACIFIC CAS9 TECHNOLOGY MARKET BY PRODUCT TYPE 2020-2027 (USD MILLION) 103

TABLE 164 REST OF ASIA PACIFIC CAS9 TECHNOLOGY MARKET BY APPLICATION 2020-2027 (USD MILLION) 103

TABLE 165 REST OF ASIA PACIFIC CAS9 TECHNOLOGY MARKET BY DELIVERY METHOD 2020-2027 (USD MILLION) 104

TABLE 166 REST OF ASIA PACIFIC CAS9 TECHNOLOGY MARKET BY PHYSICAL DELIVERY METHODS 2020-2027 (USD MILLION) 104

TABLE 167 REST OF ASIA PACIFIC CAS9 TECHNOLOGY MARKET BY VIRAL DELIVERY METHOD 2020-2027 (USD MILLION) 104

TABLE 168 REST OF ASIA PACIFIC CAS9 TECHNOLOGY MARKET BY NON-VIRAL DELIVERY METHOD 2020-2027 (USD MILLION) 105

TABLE 169 REST OF ASIA PACIFIC CAS9 TECHNOLOGY MARKET BY END USER 2020-2027 (USD MILLION) 105

TABLE 170 MIDDLE EAST & AFRICA CAS9 TECHNOLOGY MARKET BY REGIONS 2020-2027 (USD MILLION) 106

TABLE 171 MIDDLE EAST & AFRICA CAS9 TECHNOLOGY MARKET BY PRODUCT TYPE 2020-2027 (USD MILLION) 106

TABLE 172 MIDDLE EAST & AFRICA CAS9 TECHNOLOGY MARKET BY APPLICATION 2020-2027 (USD MILLION) 107

TABLE 173 MIDDLE EAST & AFRICA CAS9 TECHNOLOGY MARKET BY DELIVERY METHOD 2020-2027 (USD MILLION) 107

TABLE 174 MIDDLE EAST & AFRICA CAS9 TECHNOLOGY MARKET BY PHYSICAL DELIVERY METHODS 2020-2027 (USD MILLION) 107

TABLE 175 MIDDLE EAST & AFRICA CAS9 TECHNOLOGY MARKET BY VIRAL DELIVERY METHOD 2020-2027 (USD MILLION) 108

TABLE 176 MIDDLE EAST & AFRICA CAS9 TECHNOLOGY MARKET BY NON-VIRAL DELIVERY METHOD 2020-2027 (USD MILLION) 108

TABLE 177 MIDDLE EAST & AFRICA CAS9 TECHNOLOGY MARKET BY END USER 2020-2027 (USD MILLION) 108

TABLE 178 MIDDLE EAST CAS9 TECHNOLOGY MARKET BY PRODUCT TYPE 2020-2027 (USD MILLION) 109

TABLE 179 MIDDLE EAST CAS9 TECHNOLOGY MARKET BY APPLICATION 2020-2027 (USD MILLION) 109

TABLE 180 MIDDLE EAST CAS9 TECHNOLOGY MARKET BY DELIVERY METHOD 2020-2027 (USD MILLION) 109

TABLE 181 MIDDLE EAST CAS9 TECHNOLOGY MARKET BY PHYSICAL DELIVERY METHODS 2020-2027 (USD MILLION) 110

TABLE 182 MIDDLE EAST CAS9 TECHNOLOGY MARKET BY VIRAL DELIVERY METHOD 2020-2027 (USD MILLION) 110

TABLE 183 MIDDLE EAST CAS9 TECHNOLOGY MARKET BY NON-VIRAL DELIVERY METHOD 2020-2027 (USD MILLION) 110

TABLE 184 MIDDLE EAST CAS9 TECHNOLOGY MARKET BY END USER 2020-2027 (USD MILLION) 111

TABLE 185 AFRICA CAS9 TECHNOLOGY MARKET BY PRODUCT TYPE 2020-2027 (USD MILLION) 111

TABLE 186 AFRICA CAS9 TECHNOLOGY MARKET BY APPLICATION 2020-2027 (USD MILLION) 111

TABLE 187 AFRICA CAS9 TECHNOLOGY MARKET BY DELIVERY METHOD 2020-2027 (USD MILLION) 112

TABLE 188 AFRICA CAS9 TECHNOLOGY MARKET BY PHYSICAL DELIVERY METHODS 2020-2027 (USD MILLION) 112

TABLE 189 AFRICA CAS9 TECHNOLOGY MARKET BY VIRAL DELIVERY METHOD 2020-2027 (USD MILLION) 112

TABLE 190 AFRICA CAS9 TECHNOLOGY MARKET BY NON-VIRAL DELIVERY METHOD 2020-2027 (USD MILLION) 113

TABLE 191 AFRICA CAS9 TECHNOLOGY MARKET BY END USER 2020-2027 (USD MILLION) 113

TABLE 192 MAJOR PLAYERS IN THE GLOBAL CAS9 TECHNOLOGY MARKET 115

15 List of Figures

FIGURE 1 GLOBAL CAS9 TECHNOLOGY MARKET: MARKET STRUCTURE 19

FIGURE 2 RESEARCH PROCESS 21

FIGURE 3 TOP-DOWN & BOTTOM-UP APPROACH 24

FIGURE 4 MARKET DYNAMICS ANALYSIS OF THE GLOBAL CAS9 TECHNOLOGY MARKET 26

FIGURE 5 DRIVERS IMPACT ANALYSIS: GLOBAL CAS9 TECHNOLOGY MARKET 28

FIGURE 6 RESTRAINTS IMPACT ANALYSIS: GLOBAL CAS9 TECHNOLOGY MARKET 29

FIGURE 7 VALUE CHAIN: GLOBAL CAS9 TECHNOLOGY MARKET 31

FIGURE 8 PORTER’S FIVE FORCES MODEL: GLOBAL CAS9 TECHNOLOGY MARKET 33

FIGURE 9 GLOBAL CAS9 TECHNOLOGY MARKET BY PRODUCT TYPE 2020&2027 (USD MILLION) 37

FIGURE 10 GLOBAL CAS9 TECHNOLOGY MARKET BY APPLICATION 2020&2027 (USD MILLION) 41

FIGURE 11 GLOBAL CAS9 TECHNOLOGY MARKET BY DELIVERY METHOD 2020&2027 (USD MILLION) 44

FIGURE 12 GLOBAL CAS9 TECHNOLOGY MARKET BY END USER 2020&2027 (USD MILLION) 47

FIGURE 13 GLOBAL CAS9 TECHNOLOGY MARKET SHARE BY REGIONS 2020 (%) 51

FIGURE 14 AMERICAS CAS9 TECHNOLOGY MARKET SHARE BY REGIONS 2020 (%) 51

FIGURE 15 EUROPE CAS9 TECHNOLOGY MARKET SHARE BY REGIONS 2020 (%) 64

FIGURE 16 ASIA PACIFIC CAS9 TECHNOLOGY MARKET SHARE BY REGIONS 2020 (%) 88

FIGURE 17 MIDDLE EAST & AFRICA CAS9 TECHNOLOGY MARKET SHARE BY REGIONS 2020 (%) 106

Purchase Option
Single User $ 4,950
Multiuser License $ 5,950
Enterprise User $ 7,250
Compare Licenses
Tailored for You
  • Dedicated Research on any specifics segment or region.
  • Focused Research on specific players in the market.
  • Custom Report based only on your requirements.
  • Flexibility to add or subtract any chapter in the study.
  • Historic data from 2014 and forecasts outlook till 2040.
  • Flexibility of providing data/insights in formats (PDF, PPT, Excel).
  • Provide cross segmentation in applicable scenario/markets.