Carpet And Rugs Market Summary
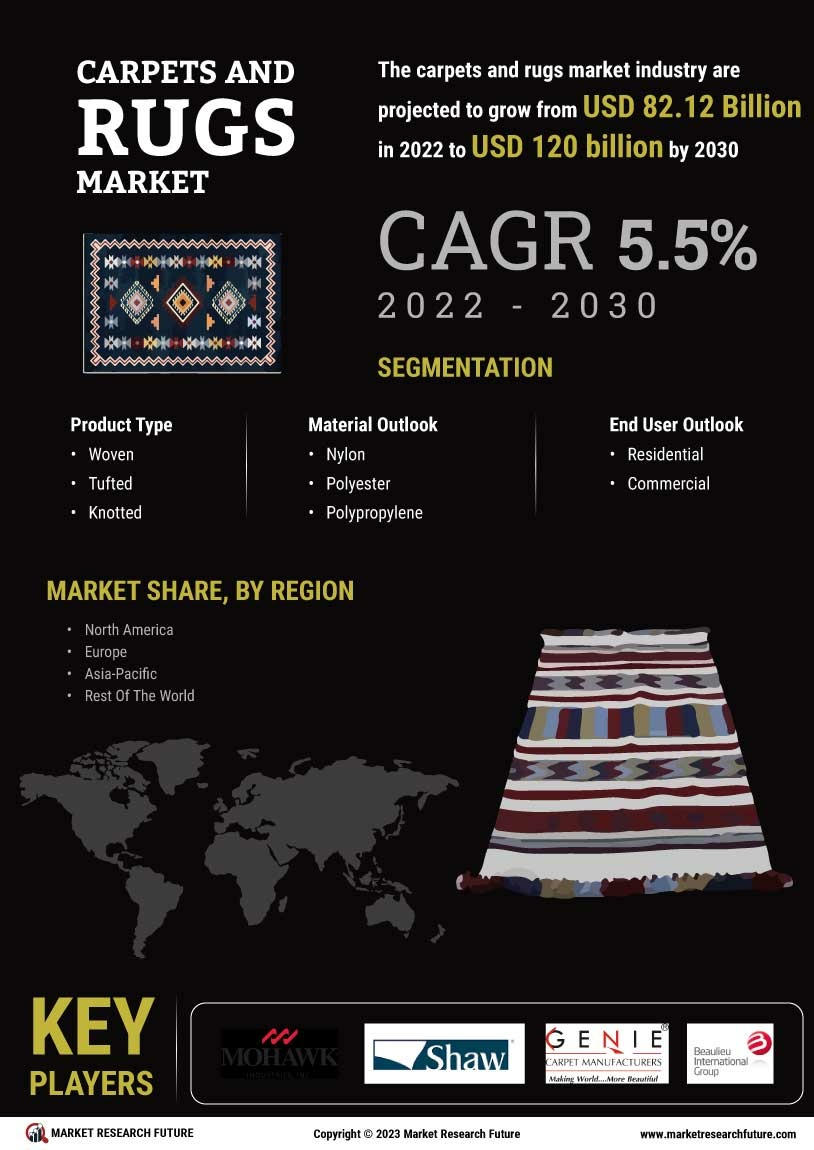
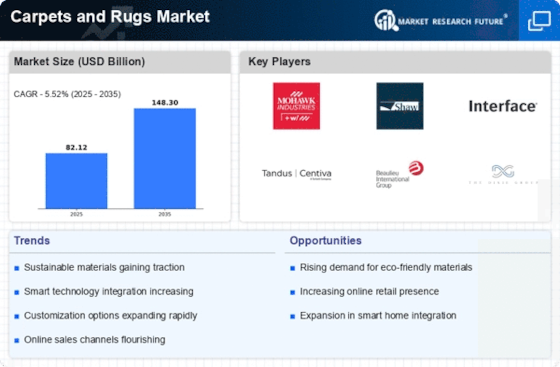
As per Market Research Future Analysis, the Global Carpets and Rugs Market was valued at USD 78.12 billion in 2023 and is projected to grow to USD 120 billion by 2032, with a CAGR of 5.5% from 2024 to 2032. The growth is driven by rising demand for home decoration and new housing facilities, alongside a shift towards eco-friendly materials. The tufted segment dominated the market in 2021, accounting for approximately 30-35% of revenue, while nylon is expected to be the fastest-growing material segment during the forecast period. The residential sector held the largest market share in 2020, driven by aesthetic appeal and insulation needs.
Key Market Trends & Highlights
The carpets and rugs market is witnessing significant trends driven by consumer preferences and innovation.
- Tufted carpets and rugs accounted for ~30-35% of market revenue in 2021.
- Nylon dominated the material segment in 2021 and is projected to grow faster during 2024-2030.
- Residential demand for carpets and rugs is increasing, driven by aesthetic appeal and insulation needs.
Market Size & Forecast
2023 Market Size: USD 78.12 Billion
2024 Market Size: USD 82.12 Billion
2032 Market Size: USD 120 Billion
CAGR (2024-2032): 5.5%
Largest Regional Market Share in 2021: North America
Major Players
Key companies include Mohawk Industries, Inc., Shaw Industries Group Inc., Genie Carpet Manufacturers, Beaulieu International Group, Lowe's, Taekett, Interface, Inc., Dixie Group, Inc., and Orientals Weavers.

Source: Secondary Research, Primary Research, Market Research Future Database, and Analyst Review
Carpets and Rugs Market Trends
- Growing demand for different styles of carpets and rugs to boost the market growth
The demand for different styles of carpets and rugs is increasing, companies are increasing their supply that is specifically suitable for various floor types and in different styles like tile flooring, wooden parquet flooring, laminate flooring, area rugs, kitchen rugs, cheap rugs, runner rugs, Berber carpet, carpet flooring, stair runner, grey carpet, carpet squares, stair carpet, grass carpet, custom rugs, oriental rugs, carpet runner, Ikea carpet, carpet padding, carpet company, bedroom rug, wool carpet, shaggy rug, black carpet, carpets for living room, stair runner carpet, artificial grass carpet, white carpet, Christmas rugs, kitchen carpet, round carpet, green grass carpet, and floor runner.
For instance, in August 2020 Ikea Systems launched a Thai street-style collection, they are affordable and multifunctional those are inspired by recycling, reusing, and creative repurposing. The collection of a mix of Thai street style and home furnishing expertise which includes cushions, and rugs made from PET bottles.
Furthermore, the increasing demand for rugs and carpets in between people assigns to the increasing urbanization rate also the increasing standard of living. Also, the shift in consumer demands on the usage of eco-friendly floor carpets which are made up of materials such as bamboo, wool, and others drives the growth of the market.
Carpets and Rugs Market Segment Insights
Carpets and Rugs Product Type Insights
The carpets and rugs market segmentation, based on product type, includes Woven, Tufted, Knotted, Needle-Punched, and others. The Tufted segment held the majority share in 2021 contributing to around ~30-35 % with respect to the Carpets and Rugs market revenue. This is primarily owing to the rising demand for carpets & rugs, which led to the rise in demand for tufted products in the overall market. Tufted rugs are manufactured with a hand-held tufting gun that can closely match the handmade oriental rugs. Furthermore, the key benefits are these rugs can be produced in any size and shape, it is free from seams, and they are durable that are built to long last. The tufted carpets and rugs are available in two types that are hand-tufted, and machine-tufted.
April 2022: The hand-tufted rug line by Gossamer and artist Alex Proba was introduced with the ideas of creative awareness and tactility. The rug contrasts Proba's colourful designs with Gossamer's textured colour palettes. These colourful shades of pink with red, shades of blue and mint green, dabs of rustic brown with white lines, lavender dots, and other designs are used in these multicoloured, custom-made carpets, which are naturally dyed and offered in four main colours. The textured canvases of these carpets include dramatic patterns, curving lines, and Proba's trademark forms.
Carpets and Rugs Material Insights
The carpets and rugs industry segmentation, based on material, includes nylon, polyester, polypropylene, cotton, wool, silk, jute, and others. Nylon dominated the market in 2021 and is projected to be the faster-growing segment during the forecast period, 2024-2030. The key players are also launching products and driving market growth. For instance, in September 2021, Mohawk Industries, Inc. launched a new carpet collection under the SmartStrand brand, which covers a blend of nylon, wool, polyester, and fiber, the new launch assists the company covers all the prices and end-user preferences and target new as well as potential consumers to increase the business sales, therefore, this factor can anticipate supporting segment growth over the forecast year market growth.
Figure 2: Carpets and Rugs Market, by Material, 2021 & 2030 (USD Billion)
Source: Secondary Research, Primary Research, Market Research Future Database, and Analyst Review
Carpets and Rugs End User Insights
Based on End Users, the carpets and rugs industry has been segmented into residential and commercial. Residential held the largest segment share in 2020, owing to the rapid increase of decorative and stylish carpets and rugs across the globe. It has been estimated that 50% of the residential is increasing demand for the aesthetic appeal of the room and sound and thermal insulation. Carpets and Rugs are available in different colors, styles, and textures, for a finishing touch to the decoration.
Carpets and Rugs Regional Insights
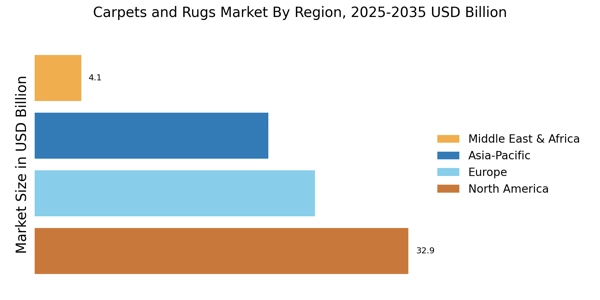
By Region, the study segments the market into North America, Europe, Asia-Pacific, and the Rest of the World. The North American carpets and rugs market accounted for USD 32.81 billion in 2021 and is expected to exhibit an 4.25% CAGR during the study period. The key players are working on launching new products with different styles, colors, textures, and so on. For instance, in January 2023, Mannington Commercial launched its new Dwellings Collection, a curated suite of broadloom carpet offerings that provide harmony and comfort to all types of living areas, including multi-family and senior living rooms. The gentle, neutral colours in this new collection seamlessly combine minimalist style with controlled patterning for a cosy effect. There are 10 broadloom designs available in the Dwellings Collection. There are four neutral hues for Adison, Alcove, Creekside, and Haven while there are six neutral colours for Dream, Frame, Harmony, Sonnet, Twist, and Wish. Styles like textured cut pile, level cut loop, and textured level loop add to the design flexibility.
Further, the major countries studied are The U.S., Canada, Germany, France, the UK, Italy, Spain, China, Japan, India, Australia, South Korea, and Brazil.
Figure 3: CARPETS AND RUGS MARKET SHARE BY REGION 2021 (%)

Source: Secondary Research, Primary Research, Market Research Future Database, and Analyst Review
Asia-Pacific carpets and rugs market accounts for the second-largest market share due to the increasing construction activities and growing demand for different types of carpets and rugs in the residential and commercial sectors in the region. For instance, in August 2020, IKEA launched the ‘Made in India’ collection using rice straw that is FORANDRING. It is a collection of eco-friendly products that includes rugs, lamp shades, and other decorative items. The company’s main focus is to encourage eco-friendly agriculture and lessen pollution.
Carpets & Rugs Key Market Players & Competitive Insights
Major market players are spending a lot of money on R&D to increase their product lines, which will help the cervical fusion market grow even more. Market participants are also taking a range of strategic initiatives to grow their worldwide footprint, including new product launches, contractual agreements, mergers and acquisitions, increased investments, and collaboration with other organizations. Competitors in the carpets & rugs industry must offer cost-effective items to expand and survive in an increasingly competitive and rising market environment.
One of the primary business strategies adopted by manufacturers in the carpets & rugs industry to benefit clients and expand the carpets & rugs market sector is to manufacture locally to reduce operating costs. In recent years, carpets & rugs have provided products with some of the most significant benefits.
Key Companies in the carpets and rugs market include
- Shaw Industries Group Inc., (US)
- Genie Carpet Manufacturers (India)
- Beaulieu International Group (Belgium)
- Orientals Weavers (Egypt), among others
Carpets and Rugs Industry Developments
January 2022: The partnership between Tarkett and Reader's Wholesale Distributors is announced. For both commercial and residential clients in the areas of southern Texas, southern Louisiana, and central and south Mississippi, Reader's will represent the company's robust product range. By extending its distribution network, Tarkett will be better able to meet the demands of both residential and business clients in these important regions. With Tarkett and Reader's joining forces, we can continue to drive long-term, sustainable development via a strong and broad distribution network while also delivering top-notch customer service across all markets.
June 2022: Today, Mannington Commercial revealed that all new and updated carpet, luxury vinyl tile (LVT), rubber, and resilient sheet products being introduced in 2022 would be 105 percent carbon offset. Customers will thus be able to shop with confidence knowing that the things they choose will be carbon-negative, or at the very least carbon-neutral. The items won't contribute to the release of carbon dioxide into the environment, a major factor in greenhouse gas emissions, from the extraction of raw materials through manufacture. In order for the firm to accelerate the decarbonization of its operations and supply chain, the effort is a crucial step. Additionally, it tackles the three most pressing environmental issues confronting the floor covering industry: greenhouse gas emissions, sustainable energy, and waste diversion.
Carpets and Rugs Market Segmentation
Carpets and Rugs Product Type Outlook
- Woven
- Tufted
- Knotted
- Needle-Punched
- Others
Carpets and Rugs Material Outlook
- Nylon
- Polyester
- Polypropylene
- Cotton
- Wool
- Silk
- Jute
- Others
Carpets and Rugs End User Outlook
Carpets and Rugs Regional Outlook
North America
Europe
Asia-Pacific
- Australia
- Rest of Asia-Pacific
Rest of the World
Attribute/Metric |
Details |
Market Size 2023 |
USD 78.12 billion |
Market Size 2024 |
USD 82.12 billion |
Market Size 2032 |
USD 120 billion |
Compound Annual Growth Rate (CAGR) |
5.5 % (2024-2032) |
Base Year |
2023 |
Forecast Period |
2024-2032 |
Historical Data |
2018 & 2022 |
Forecast Units |
Value (USD Billion) |
Report Coverage |
Revenue Forecast, Competitive Landscape, Growth Factors, and Trends |
Segments Covered |
Product Type, Material, End-Users, and Region |
Geographies Covered |
North America, Europe, Asia Pacific, and the Rest of the World |
Countries Covered |
The U.S, Canada, Mexico, Germany, France, the UK, Italy, Spain, the Rest of Europe, China, Japan, India, Australia & New Zealand, the Rest of Asia Pacific, South America, the Middle East, and Africa |
Key Companies Profiled |
Mohawk Industries, Inc. (US), Shaw Industries Group Inc. (US), Genie Carpet Manufacturers (India), Beaulieu International Group (Belgium), Lowe's (US), Taekett (France), Interface, Inc. (US), Dixie Group, Inc. (US), Tai Ping (China), and Victoria PLC (UK). |
Key Market Opportunities |
Implementation of Strategies and Growth in the importance of Organized Retailing |
Key Market Dynamics |
Increased Renovation and Remodeling Activities Surge in Disposable Income Increasing at a High Pace in Residential Areas as Well |
Frequently Asked Questions (FAQ):
The Carpet and Rugs Market size has been estimated at USD 82.12 billion in 2024 and USD 120 billion in 2032.
North American market size has been estimated at USD 32.81 billion.
The growth rate for the carpets and rugs market has recorded 5.5% CARG.
North America is dominating the market.
Mohawk Industries, Inc. (US), Shaw Industries Group Inc., (US), Genie Carpet Manufacturers (India), Beaulieu International Group (Belgium), and Lowe's (US) are some of the key players in the carpets and rugs market.
The tufted product type is leading the market.
In material segment Nylon is leading the market share in the carpets and rugs market.
Table of Contents
1 Executive Summary
2 Scope of the Report
2.1 Industry Definition
2.2 Scope of the Study
2.2.1 Research Objectives
2.2.2 Assumptions & Limitations
2.3 Industry Structure
3 Industry Research Methodology
3.1 Research Process
3.2 Secondary Research
3.3 Primary Research
3.4 Forecast Model
4 Industry Landscape
4.1 Supply Chain Analysis
4.1.1 Raw Material Suppliers
4.1.2 Manufacturers/Producers
4.1.3 Distributors/Retailers/Wholesalers/E-Commerce
4.1.4 Product Types
4.2 Porter’s Five Forces Analysis
4.2.1 Threat of New Entrants
4.2.2 Bargaining Power of Buyers
4.2.3 Bargaining Power of Suppliers
4.2.4 Threat of Substitutes
4.2.5 Internal Rivalry
5 Industry Dynamics of the Global Carpet & Rugs Industry
5.1 Introduction
5.2 Drivers
5.3 Restraints
5.4 Opportunities
5.5 Challenges
6. Global Carpet & Rugs Industry , by Material Type
6.1 Introduction
6.2 Nylon
6.2.1 Industry Estimates & Forecast, 2024–2032
6.2.2 Industry Estimates & Forecast, by Region, 2024–2032
6.3 Polyester
6.3.1 Industry Estimates & Forecast, 2024–2032
6.3.2 Industry Estimates & Forecast, by Region, 2024–2032
6.4 Polypropylene
6.4.1 Industry Estimates & Forecast, 2024–2032
6.4.2 Industry Estimates & Forecast, by Region, 2024–2032
6.5 Cotton
6.5.1 Industry Estimates & Forecast, 2024–2032
6.5.2 Industry Estimates & Forecast, by Region, 2024–2032
6.6 Wool
6.6.1 Industry Estimates & Forecast, 2024–2032
6.6.2 Industry Estimates & Forecast, by Region, 2024–2032
6.7 Silk
6.7.1 Industry Estimates & Forecast, 2024–2032
6.7.2 Industry Estimates & Forecast, by Region, 2024–2032
6.8 Jute
6.8.1 Industry Estimates & Forecast, 2024–2032
6.8.2 Industry Estimates & Forecast, by Region, 2024–2032
6.9 Others
6.9.1 Industry Estimates & Forecast, 2024–2032
6.9.2 Industry Estimates & Forecast, by Region, 2024–2032
7. Global Carpet & Rugs Industry , by Product Type
7.1 Introduction
7.2 Woven
7.2.1 Industry Estimates & Forecast, 2024–2032
7.2.2 Industry Estimates & Forecast, by Region, 2024–2032
7.3 Tufted
7.3.1 Industry Estimates & Forecast, 2024–2032
7.3.2 Industry Estimates & Forecast, by Region, 2024–2032
7.4 Knotted
7.4.1 Industry Estimates & Forecast, 2024–2032
7.4.2 Industry Estimates & Forecast, by Region, 2024–2032
7.5 Needle-Punched
7.5.1 Industry Estimates & Forecast, 2024–2032
7.5.2 Industry Estimates & Forecast, by Region, 2024–2032
7.6 Others
7.6.1 Industry Estimates & Forecast, 2024–2032
7.6.2 Industry Estimates & Forecast, by Region, 2024–2032
8. Global Carpet & Rugs Industry , by End Use
8.1 Introduction
8.2 Residential
8.2.1 Industry Estimates & Forecast, 2024–2032
8.2.2 Industry Estimates & Forecast, by Region, 2024–2032
8.3 Commercial
8.3.1 Industry Estimates & Forecast, 2024–2032
8.3.2 Industry Estimates & Forecast, by Region, 2024–2032
9. Global Carpet & Rugs Industry , by Region
9.1 Introduction
9.2 North America
9.2.1 Industry Estimates & Forecast, 2024–2032
9.2.2 Industry Estimates & Forecast, by Material Type, 2024–2032
9.2.3 Industry Estimates & Forecast, by Product Type, 2024–2032
9.2.4 Industry Estimates & Forecast, by End Use, 2024–2032
9.2.5 US
9.2.5.1 Industry Estimates & Forecast, 2024–2032
9.2.5.2 Industry Estimates & Forecast, by Material Type, 2024–2032
9.2.5.3 Industry Estimates & Forecast, by Product Type, 2024–2032
9.2.5.4 Industry Estimates & Forecast, by End Use, 2024–2032
9.2.6 Canada
9.2.6.1 Industry Estimates & Forecast, 2024–2032
9.2.6.2 Industry Estimates & Forecast, by Material Type, 2024–2032
9.2.6.3 Industry Estimates & Forecast, by Product Type, 2024–2032
9.2.6.4 Industry Estimates & Forecast, by End Use, 2024–2032
9.2.7 Mexico
9.2.7.1 Industry Estimates & Forecast, 2024–2032
9.2.7.2 Industry Estimates & Forecast, by Material Type, 2024–2032
9.2.7.3 Industry Estimates & Forecast, by Product Type, 2024–2032
9.2.7.4 Industry Estimates & Forecast, by End Use, 2024–2032
9.3 Europe
9.3.1 Industry Estimates & Forecast, 2024–2032
9.3.2 Industry Estimates & Forecast, by Material Type, 2024–2032
9.2.3 Industry Estimates & Forecast, by Product Type, 2024–2032
9.3.4 Industry Estimates & Forecast, by End Use, 2024–2032
9.3.5 Germany
9.3.5.1 Industry Estimates & Forecast, 2024–2032
9.3.5.2 Industry Estimates & Forecast, by Material Type, 2024–2032
9.2.5.3 Industry Estimates & Forecast, by Product Type, 2024–2032
9.3.5.4 Industry Estimates & Forecast, by End Use, 2024–2032
9.3.6. France
9.3.6.1 Industry Estimates & Forecast, 2024–2032
9.3.6.2 Industry Estimates & Forecast, by Material Type, 2024–2032
9.3.6.3 Industry Estimates & Forecast, by Product Type, 2024–2032
9.3.6.4 Industry Estimates & Forecast, by End Use, 2024–2032
9.3.7 Italy
9.3.7.1 Industry Estimates & Forecast, 2024–2032
9.3.7.2 Industry Estimates & Forecast, by Material Type, 2024–2032
9.3.7.3 Industry Estimates & Forecast, by Product Type, 2024–2032
9.3.7.4 Industry Estimates & Forecast, by End Use, 2024–2032
9.3.8 Spain
9.3.8.1 Industry Estimates & Forecast, 2024–2032
9.3.8.2 Industry Estimates & Forecast, by Material Type, 2024–2032
9.3.8.3 Industry Estimates & Forecast, by Product Type, 2024–2032
9.3.8.4 Industry Estimates & Forecast, by End Use, 2024–2032
9.3.9 UK
9.3.9.1 Industry Estimates & Forecast, 2024–2032
9.3.9.2 Industry Estimates & Forecast, by Material Type, 2024–2032
9.3.9.3 Industry Estimates & Forecast, by Product Type, 2024–2032
9.3.9.4 Industry Estimates & Forecast, by End Use, 2024–2032
9.3.10 Rest of Europe
9.3.10.1 Industry Estimates & Forecast, 2024–2032
9.3.10.2 Industry Estimates & Forecast, by Material Type, 2024–2032
9.3.10.3 Industry Estimates & Forecast, by Product Type, 2024–2032
9.3.10.4 Industry Estimates & Forecast, by End Use, 2024–2032
9.4 Asia-Pacific
9.4.1 Industry Estimates & Forecast, 2024–2032
9.4.2 Industry Estimates & Forecast, by Material Type, 2024–2032
9.4.3 Industry Estimates & Forecast, by Product Type, 2024–2032
9.4.4 Industry Estimates & Forecast, by End Use, 2024–2032
9.4.5 China
9.4.5.1 Industry Estimates & Forecast, 2024–2032
9.4.5.2 Industry Estimates & Forecast, by Material Type, 2024–2032
9.4.5.3 Industry Estimates & Forecast, by Product Type, 2024–2032
9.4.5.4 Industry Estimates & Forecast, by End Use, 2024–2032
9.4.6 India
9.4.6.1 Industry Estimates & Forecast, 2024–2032
9.4.6.2 Industry Estimates & Forecast, by Material Type, 2024–2032
9.4.6.3 Industry Estimates & Forecast, by Product Type, 2024–2032
9.4.6.4 Industry Estimates & Forecast, by End Use, 2024–2032
9.4.7 Japan
9.4.7.1 Industry Estimates & Forecast, 2024–2032
9.4.7.2 Industry Estimates & Forecast, by Material Type, 2024–2032
9.4.7.3 Industry Estimates & Forecast, by Product Type, 2024–2032
9.4.7.3 Industry Estimates & Forecast, by End Use, 2024–2032
9.4.8 Australia & New Zealand
9.4.8.1 Industry Estimates & Forecast, 2024–2032
9.4.8.2 Industry Estimates & Forecast, by Material Type, 2024–2032
9.4.8.4 Industry Estimates & Forecast, by Product Type, 2024–2032
9.4.8.3 Industry Estimates & Forecast, by End Use, 2024–2032
9.4.9 Rest of Asia-Pacific
9.4.9.1 Industry Estimates & Forecast, 2024–2032
9.4.9.2 Industry Estimates & Forecast, by Material Type, 2024–2032
9.4.9.3 Industry Estimates & Forecast, by Product Type, 2024–2032
9.4.9.4 Industry Estimates & Forecast, by End Use, 2024–2032
9.5 Rest of the World (RoW)
9.5.1 Industry Estimates & Forecast, 2024–2032
9.5.2 Industry Estimates & Forecast, by Material Type, 2024–2032
9.5.3 Industry Estimates & Forecast, by Product Type, 2024–2032
9.5.4 Industry Estimates & Forecast, by End Use, 2024–2032
9.5.5 South America
9.5.5.1 Industry Estimates & Forecast, 2024–2032
9.5.5.2 Industry Estimates & Forecast, by Material Type, 2024–2032
9.5.5.3 Industry Estimates & Forecast, by Product Type, 2024–2032
9.5.5.4 Industry Estimates & Forecast, by End Use, 2024–2032
9.5.6 Middle East
9.5.6.1 Industry Estimates & Forecast, 2024–2032
9.5.6.2 Industry Estimates & Forecast, by Material Type, 2024–2032
9.5.6.3 Industry Estimates & Forecast, by Product Type, 2024–2032
9.5.6.4 Industry Estimates & Forecast, by End Use, 2024–2032
9.5.7 Africa
9.5.7.1 Industry Estimates & Forecast, 2024–2032
9.5.7.2 Industry Estimates & Forecast, by Material Type, 2024–2032
9.5.7.3 Industry Estimates & Forecast, by Product Type, 2024–2032
9.5.7.4 Industry Estimates & Forecast, by End Use, 2024–2032
10. Company Landscape
10.1 Introduction
10.2 Industry Strategies
10.3 Key Development Analysis
(Expansions/Mergers & Acquisitions/Joint Ventures/New Product Developments/Agreements/Investments)
11. Company Profiles
11.1 Mohawk Industries, Inc. (US)
11.1.1 Company Overview
11.1.2 Financial Updates
11.1.3 Product/Business Segment Overview
11.1.4 Strategies
11.1.5 Key Developments
11.1.6 SWOT Analysis
11.2 Shaw Industries Group, Inc. (US)
11.2.1 Company Overview
11.2.2 Financial Updates
11.2.3 Product/Business Segment Overview
11.2.4 Strategies
11.2.5 Key Developments
11.2.6 SWOT Analysis
11.3 Tarkett S.A (France)
11.3.1 Company Overview
11.3.2 Financial Updates
11.3.3 Product/Business Segment Overview
11.3.4 Strategies
11.3.5 Key Developments
11.3.6 SWOT Analysis
11.4 Lowe’s Companies, Inc. (US)
11.4.1 Company Overview
11.4.2 Financial Updates
11.4.3 Product/Business Segment Overview
11.4.4 Strategies
11.4.5 Key Developments
11.4.6 SWOT Analysis
11.5 Dixie Group, Inc. (US)
11.5.1 Company Overview
11.5.2 Financial Updates
11.5.3 Product/Business Segment Overview
11.5.4 Strategies
11.5.5 Key Developments
11.5.6 SWOT Analysis
11.6 Genie Carpet Manufacturers (India)
11.6.1 Company Overview
11.6.2 Financial Updates
11.6.3 Product/Business Segment Overview
11.6.4 Strategies
11.6.5 Key Developments
11.6.6 SWOT Analysis
11.7 Tai Ping Carpets International Limited (Hong Kong)
11.7.1 Company Overview
11.7.2 Financial Updates
11.7.3 Product/Business Segment Overview
11.7.4 Strategies
11.7.5 Key Developments
11.7.6 SWOT Analysis
11.8 Victoria PLC (UK)
11.8.1 Company Overview
11.8.2 Financial Updates
11.8.3 Product/Business Segment Overview
11.8.4 Strategies
11.8.5 Key Developments
11.8.6 SWOT Analysis
11.9 Oriental Weavers Carpet Co. (Egypt)
11.9.1 Company Overview
11.9.2 Financial Updates
11.9.3 Product/Business Segment Overview
11.9.4 Strategies
11.9.5 Key Developments
11.9.6 SWOT Analysis
11.10 Interface, Inc. (US)
11.10.1 Company Overview
11.10.2 Financial Updates
11.10.3 Product/Business Segment Overview
11.10.4 Strategies
11.10.5 Key Developments
11.10.6 SWOT Analysis
11.11 Ikea Group (Netherlands)
11.11.1 Company Overview
11.11.2 Financial Updates
11.11.3 Product/Business Segment Overview
11.11.4 Strategies
11.11.5 Key Developments
11.11.6 SWOT Analysis
11.12 Royalty Carpet Mills, Inc. (US)
11.12.1 Company Overview
11.12.2 Financial Updates
11.12.3 Product/Business Segment Overview
11.12.4 Strategies
11.12.5 Key Developments
11.12.6 SWOT Analysis
11.13 Engineered Floors LLC (US)
11.13.1 Company Overview
11.13.2 Financial Updates
11.13.3 Product/Business Segment Overview
11.13.4 Strategies
11.13.5 Key Developments
11.13.6 SWOT Analysis
11.14 Beaulieu International Group (Belgium)
11.14.1 Company Overview
11.14.2 Financial Updates
11.14.3 Product/Business Segment Overview
11.14.4 Strategies
11.14.5 Key Developments
11.14.6 SWOT Analysis
11.15 Milliken & Company (US)
11.15.1 Company Overview
11.15.2 Financial Updates
11.15.3 Product/Business Segment Overview
11.15.4 Strategies
11.15.5 Key Developments
11.15.6 SWOT Analysis
12. Conclusion
LIST OF TABLES
TABLE 1 Global Carpet & Rugs Industry , by Region, 2024–2032 (USD Million)
TABLE 2 Global Carpet & Rugs Industry , by Material Type, 2024–2032 (USD Million)
TABLE 3 Global Carpet & Rugs Industry , by Product Type, 2024–2032 (USD Million)
TABLE 4 Global Carpet & Rugs Industry , by End Use, 2024–2032 (USD Million)
TABLE 5 North America: Carpet & Rugs Industry , by Country, 2024–2032 (USD Million)
TABLE 6 North America: Carpet & Rugs Industry , by Material Type, 2024–2032 (USD Million)
TABLE 7 North America: Carpet & Rugs Industry , by Product Type, 2024–2032 (USD Million)
TABLE 8 North America: Carpet & Rugs Industry , by End Use, 2024–2032 (USD Million)
TABLE 9 US: Carpet & Rugs Industry , by Material Type, 2024–2032 (USD Million)
TABLE 10 US: Carpet & Rugs Industry , by Product Type, 2024–2032 (USD Million)
TABLE 11 US: Carpet & Rugs Industry , by End Use, 2024–2032 (USD Million)
TABLE 12 Canada: Carpet & Rugs Industry , by Material Type, 2024–2032 (USD Million)
TABLE 13 Canada: Carpet & Rugs Industry , by Product Type, 2024–2032 (USD Million)
TABLE 14 Canada: Carpet & Rugs Industry , by End Use, 2024–2032 (USD Million)
TABLE 15 Mexico: Carpet & Rugs Industry , by Material Type, 2024–2032 (USD Million)
TABLE 16 Mexico: Carpet & Rugs Industry , by Product Type, 2024–2032 (USD Million)
TABLE 17 Mexico: Carpet & Rugs Industry , by End Use, 2024–2032 (USD Million)
TABLE 18 Europe: Carpet & Rugs Industry , by Country, 2024–2032 (USD Million)
TABLE 19 Europe: Carpet & Rugs Industry , by Material Type, 2024–2032 (USD Million)
TABLE 20 Europe: Carpet & Rugs Industry , by Product Type, 2024–2032 (USD Million)
TABLE 21 Europe: Carpet & Rugs Industry , by End Use, 2024–2032 (USD Million)
TABLE 22 Germany: Carpet & Rugs Industry , by Material Type, 2024–2032 (USD Million)
TABLE 23 Germany: Carpet & Rugs Industry , by Product Type, 2024–2032 (USD Million)
TABLE 24 Germany: Carpet & Rugs Industry , by End Use, 2024–2032 (USD Million)
TABLE 25 France: Carpet & Rugs Industry , by Material Type, 2024–2032 (USD Million)
TABLE 26 France: Carpet & Rugs Industry , by Product Type, 2024–2032 (USD Million)
TABLE 27 France: Carpet & Rugs Industry , by End Use, 2024–2032 (USD Million)
TABLE 28 Italy: Carpet & Rugs Industry , by Material Type, 2024–2032 (USD Million)
TABLE 29 Italy: Carpet & Rugs Industry , by Product Type, 2024–2032 (USD Million)
TABLE 30 Italy: Carpet & Rugs Industry , by End Use, 2024–2032 (USD Million)
TABLE 31 Spain: Carpet & Rugs Industry , by Material Type, 2024–2032 (USD Million)
TABLE 32 Spain: Carpet & Rugs Industry , by Product Type, 2024–2032 (USD Million)
TABLE 33 Spain: Carpet & Rugs Industry , by End Use, 2024–2032 (USD Million)
TABLE 34 UK: Carpet & Rugs Industry , by Material Type, 2024–2032 (USD Million)
TABLE 35 UK: Carpet & Rugs Industry , by Product Type, 2024–2032 (USD Million)
TABLE 36 UK: Carpet & Rugs Industry , by End Use, 2024–2032 (USD Million)
TABLE 37 Rest of Europe: Carpet & Rugs Industry , by Material Type, 2024–2032 (USD Million)
TABLE 38 Rest of Europe: Carpet & Rugs Industry , by Product Type, 2024–2032 (USD Million)
TABLE 39 Rest of Europe: Carpet & Rugs Industry , by End Use, 2024–2032 (USD Million)
TABLE 40 Asia-Pacific: Carpet & Rugs Industry , by Country, 2024–2032 (USD Million)
TABLE 41 Asia-Pacific: Carpet & Rugs Industry , by Material Type, 2024–2032 (USD Million)
TABLE 42 Asia-Pacific: Carpet & Rugs Industry , by Product Type, 2024–2032 (USD Million)
TABLE 43 Asia-Pacific: Carpet & Rugs Industry , by End Use, 2024–2032 (USD Million)
TABLE 44 China: Carpet & Rugs Industry , by Material Type, 2024–2032 (USD Million)
TABLE 45 China: Carpet & Rugs Industry , by Product Type, 2024–2032 (USD Million)
TABLE 46 China: Carpet & Rugs Industry , by End Use, 2024–2032 (USD Million)
TABLE 47 India: Carpet & Rugs Industry , by Material Type, 2024–2032 (USD Million)
TABLE 48 India: Carpet & Rugs Industry , by Product Type, 2024–2032 (USD Million)
TABLE 49 India: Carpet & Rugs Industry , by End Use, 2024–2032 (USD Million)
TABLE 50 Japan: Carpet & Rugs Industry , by Material Type, 2024–2032 (USD Million)
TABLE 51 Japan: Carpet & Rugs Industry , by Product Type, 2024–2032 (USD Million)
TABLE 52 Japan: Carpet & Rugs Industry , by End Use, 2024–2032 (USD Million)
TABLE 53 Rest of Asia-Pacific: Carpet & Rugs Industry , by Material Type, 2024–2032 (USD Million)
TABLE 54 Rest of Asia-Pacific: Carpet & Rugs Industry , by Product Type, 2024–2032 (USD Million)
TABLE 55 Rest of Asia-Pacific: Carpet & Rugs Industry , by End Use, 2024–2032 (USD Million)
TABLE 56 Rest of the World (RoW): Carpet & Rugs Industry , by Country, 2024–2032 (USD Million)
TABLE 57 Rest of the World (RoW): Carpet & Rugs Industry , by Material Type, 2024–2032 (USD Million)
TABLE 58 Rest of the World (RoW): Carpet & Rugs Industry , by Product Type, 2024–2032 (USD Million)
TABLE 59 Rest of the World (RoW): Carpet & Rugs Industry , by End Use, 2024–2032 (USD Million)
TABLE 60 South America: Carpet & Rugs Industry , by Material Type, 2024–2032 (USD Million)
TABLE 61 South America: Carpet & Rugs Industry , by Product Type, 2024–2032 (USD Million)
TABLE 62 South America: Carpet & Rugs Industry , by End Use, 2024–2032 (USD Million)
TABLE 63 Middle East: Carpet & Rugs Industry , by Material Type, 2024–2032 (USD Million)
TABLE 64 Middle East: Carpet & Rugs Industry , by Product Type, 2024–2032 (USD Million)
TABLE 65 Middle East: Carpet & Rugs Industry , by End Use, 2024–2032 (USD Million)
TABLE 66 Africa: Carpet & Rugs Industry , by Material Type, 2024–2032 (USD Million)
TABLE 67 Africa: Carpet & Rugs Industry , by Product Type, 2024–2032 (USD Million)
TABLE 68 Africa: Carpet & Rugs Industry , by End Use, 2024–2032 (USD Million)
LIST OF FIGURES
FIGURE 1 Global Carpet & Rugs Industry Segmentation
FIGURE 2 Forecast Research Methodology
FIGURE 3 Five Forces Analysis of the Global Carpet & Rugs Industry
FIGURE 4 Value Chain of the Global Carpet & Rugs Industry
FIGURE 5 Share of the Global Carpet & Rugs Industry in 2024, by Country (%)
FIGURE 6 Global Carpet & Rugs Industry , 2024–2032
FIGURE 7 Global Carpet & Rugs Industry Size, by Material Type, 2024
FIGURE 8 Share of the Global Carpet & Rugs Industry , by Material Type, 2024–2032
FIGURE 9 Global Carpet & Rugs Industry Size, by Product Type, 2024
FIGURE 10 Share of the Global Carpet & Rugs Industry , by Product Type, 2024–2032
FIGURE 11 Global Carpet & Rugs Industry Size, by End Use, 2024
FIGURE 12 Share of the Global Carpet & Rugs Industry , by End Use, 2024–2032