Cardiac Biomarkers Market (2026 - 2035)

ID: MRFR/HC/7122-CR 117 Pages Satyendra Maurya Last Updated: September 15, 2026
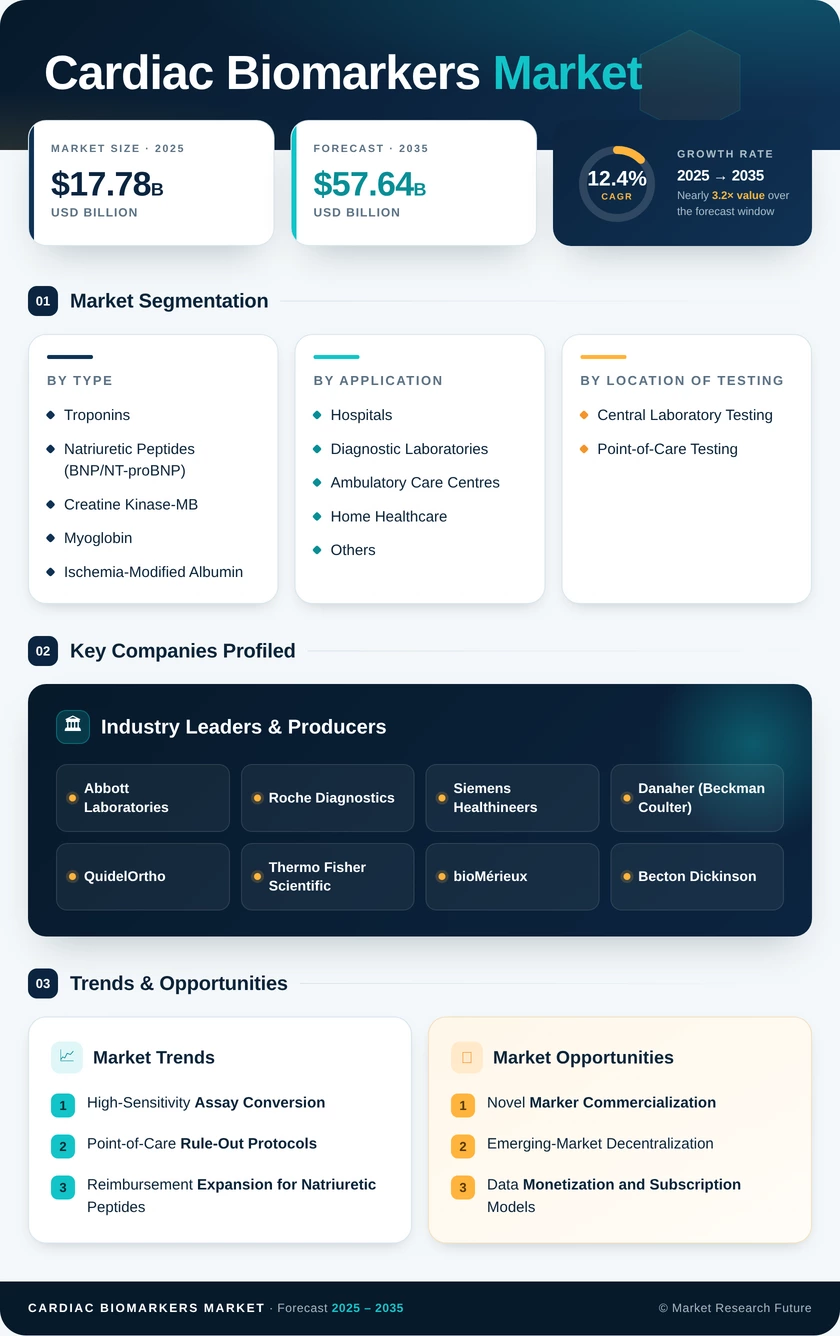
Cardiac Biomarkers Market Research Report Information By Type (Creatine Kinase (CK-MB), Troponins T and Imyoglobin, BNPs, IMA and Others), By Location of Testing (Point of Care and Laboratory Testing), By Application (Myocardial Infarction, Congestive Heart Failure, Acute Coronary Syndrome and Atherosclerosis), And By Region (North America, Europe, Asia-Pacific, And Rest Of The World) –Market Forecast Till 2035
Cardiac Biomarkers Market
Market Size
Forecast Period2026-2035
CAGR (2026-2035)12.4%
2025 Market SizeUSD 17.78 Billion
2035 Market SizeUSD 57.64 Billion
Key Players
Abbott Laboratories
Roche Diagnostics
Siemens Healthineers
Danaher
QuidelOrtho
Thermo Fisher Scientific
Opportunities
  • Novel Marker Commercialization
  • Emerging-Market Decentralization
  • Data Monetization and Subscription Models
  1. 1 Market Summary |
    1. 1.1 Study Assumptions & Market Definition |
    2. 1.2 Scope of the Study |
    3. 1.3 Research Methodology
  2. 2 Key Report Takeaways |
    1. 2.1 By Biomarker Type |
    2. 2.2 By Application and Testing Location |
    3. 2.3 By Geography
  3. 3 Market Size & Forecast (2021–2035) |
    1. 3.1 Historical Market Size (2021–2025) |
    2. 3.2 Current & Forecast Market Size (2026–2035) |
    3. 3.3 Market Size by Revenue (USD Billion) |
    4. 3.4 Year-over-Year Growth Analysis
  4. 4 Driver Impact Analysis |
    1. 4.1 High-Sensitivity Assay Conversion |
    2. 4.2 Point-of-Care Rule-Out Protocols |
    3. 4.3 Reimbursement Expansion for Natriuretic Peptides |
    4. 4.4 AI-Enabled Decision Support
  5. 5 Restraints Impact Analysis |
    1. 5.1 Assay Standardization |
    2. 5.2 Laboratory Price Compression |
    3. 5.3 IVDR Compliance Burden
  6. 6 Opportunities |
    1. 6.1 Novel Marker Commercialization |
    2. 6.2 Emerging-Market Decentralization |
    3. 6.3 Data Monetization and Subscription Models |
    4. 6.4 Home Heart-Failure Monitoring |
    5. 6.5 Perioperative and Oncology Cardiotoxicity Screening
  7. 7 Regional Market Share & Country-Level Analysis |
    1. 7.1 North America | |
      1. 7.1.1 US | |
      2. 7.1.2 Canada | |
      3. 7.1.3 Mexico |
    2. 7.2 Europe | |
      1. 7.2.1 Germany | |
      2. 7.2.2 UK | |
      3. 7.2.3 France | |
      4. 7.2.4 Italy | |
      5. 7.2.5 Spain | |
      6. 7.2.6 Nordic Countries | |
      7. 7.2.7 Russia | |
      8. 7.2.8 Rest of Europe |
    3. 7.3 Asia-Pacific | |
      1. 7.3.1 China | |
      2. 7.3.2 India | |
      3. 7.3.3 Japan | |
      4. 7.3.4 South Korea | |
      5. 7.3.5 ASEAN | |
      6. 7.3.6 Rest of Asia-Pacific |
    4. 7.4 South America | |
      1. 7.4.1 Brazil | |
      2. 7.4.2 Argentina | |
      3. 7.4.3 Rest of South America |
    5. 7.5 Middle East & Africa | |
      1. 7.5.1 Saudi Arabia | |
      2. 7.5.2 UAE | |
      3. 7.5.3 South Africa | |
      4. 7.5.4 Egypt | |
      5. 7.5.5 Rest of Middle East & Africa
  8. 8 Future Outlook (2026–2035) |
    1. 8.1 Algorithmic Triage Becomes Standard of Care |
    2. 8.2 Platform Economics Shift Toward Consumables-as-a-Service |
    3. 8.3 Prevention Displaces Reaction |
    4. 8.4 Supply Chain and Sustainability Reporting
  9. 9 Market Segmentation Analysis |
    1. 9.1 By Biomarker Type | |
      1. 9.1.1 Troponins | |
      2. 9.1.2 Creatine Kinase-MB | |
      3. 9.1.3 Natriuretic Peptides (BNP/NT-proBNP) | |
      4. 9.1.4 Myoglobin | |
      5. 9.1.5 Ischemia-Modified Albumin | |
      6. 9.1.6 Others |
    2. 9.2 By Application | |
      1. 9.2.1 Acute Coronary Syndrome | |
      2. 9.2.2 Myocardial Infarction | |
      3. 9.2.3 Congestive Heart Failure | |
      4. 9.2.4 Atherosclerosis | |
      5. 9.2.5 Others |
    3. 9.3 By Location of Testing | |
      1. 9.3.1 Central Laboratory Testing | |
      2. 9.3.2 Point-of-Care Testing |
    4. 9.4 By End User | |
      1. 9.4.1 Hospitals | |
      2. 9.4.2 Diagnostic Laboratories | |
      3. 9.4.3 Ambulatory Care Centres | |
      4. 9.4.4 Home Healthcare | |
      5. 9.4.5 Others
  10. 10 Competitive Landscape |
    1. 10.1 Market Share Analysis (2026) |
    2. 10.2 Competitive Benchmarking Matrix |
    3. 10.3 Company Profiles
  11. 11 Recent News & Developments
  12. 12 Report Scope & Methodology
  13. 13 Detailed Sources & Citations
  14. 14 Frequently Asked Questions
  15. 15 LIST OF TABLES |
  16. TABLE 1 Global Cardiac Biomarkers Market Size & Forecast, by Revenue (USD Billion), 2021–2035 |
  17. TABLE 2 Global Cardiac Biomarkers Market — Year-over-Year Growth Analysis, 2021–2035 |
  18. TABLE 3 Driver Impact Analysis Matrix, 2026–2035 |
  19. TABLE 4 Restraint Impact Analysis Matrix, 2026–2035 |
  20. TABLE 5 Global Cardiac Biomarkers Market Size, by Region, 2021–2035 (USD Billion) |
  21. TABLE 6 North America Cardiac Biomarkers Market Size, by Country, 2021–2035 (USD Billion) |
  22. TABLE 7 Europe Cardiac Biomarkers Market Size, by Country, 2021–2035 (USD Billion) |
  23. TABLE 8 Asia-Pacific Cardiac Biomarkers Market Size, by Country, 2021–2035 (USD Billion) |
  24. TABLE 9 South America Cardiac Biomarkers Market Size, by Country, 2021–2035 (USD Billion) |
  25. TABLE 10 Middle East & Africa Cardiac Biomarkers Market Size, by Country, 2021–2035 (USD Billion) |
  26. TABLE 11 Global Market Size, by Biomarker Type, 2021–2035 (USD Billion) |
  27. TABLE 12 Global Market Size, by Application, 2021–2035 (USD Billion) |
  28. TABLE 13 Global Market Size, by Location of Testing, 2021–2035 (USD Billion) |
  29. TABLE 14 Global Market Size, by End User, 2021–2035 (USD Billion) |
  30. TABLE 15 Competitive Benchmarking Matrix, 2026 |
  31. TABLE 16 Company Profiles — Key Players |
  32. TABLE 17 Recent Developments & Strategic Announcements, 2023–2025 |
  33. TABLE 18 Report Scope & Methodology Summary |
  34. TABLE 19 Detailed Sources & Citations Index |
  35. TABLE 20 Segmentation Quick Reference Matrix
  36. 16 LIST OF FIGURES |
  37. FIGURE 1 Market Dynamics — Drivers, Restraints and Opportunities Map |
  38. FIGURE 2 Industry Value Chain Analysis |
  39. FIGURE 3 Porter's Five Forces Analysis |
  40. FIGURE 4 Global Market Size Trend, 2021–2035 (USD Billion) |
  41. FIGURE 5 Year-over-Year Growth Trajectory, 2022–2035 |
  42. FIGURE 6 Market Share by Biomarker Type, 2025 vs 2035 |
  43. FIGURE 7 Market Share by Application, 2025 vs 2035 |
  44. FIGURE 8 Market Share by Location of Testing, 2025 vs 2035 |
  45. FIGURE 9 Market Share by End User, 2025 vs 2035 |
  46. FIGURE 10 Regional Share Distribution, 2025 |
  47. FIGURE 11 Regional CAGR Comparison, 2026–2035 |
  48. FIGURE 12 Competitive Landscape Positioning Matrix, 2026 |
  49. FIGURE 13 Top-5 Supplier Concentration Trend, 2021–2026 |
  50. FIGURE 14 Reimbursement Milestone Timeline, 2023–2035

Segmentation Quick Reference

DimensionSub-SegmentsDominant SegmentFastest Growing Segment
By Biomarker TypeTroponins; Creatine Kinase-MB; Natriuretic Peptides (BNP/NT-proBNP); Myoglobin; Ischemia-Modified Albumin; OthersTroponinsIschemia-Modified Albumin
By ApplicationAcute Coronary Syndrome; Myocardial Infarction; Congestive Heart Failure; Atherosclerosis; OthersMyocardial InfarctionAcute Coronary Syndrome
By Location of TestingCentral Laboratory Testing; Point-of-Care TestingCentral Laboratory TestingPoint-of-Care Testing
By End UserHospitals; Diagnostic Laboratories; Ambulatory Care Centres; Home Healthcare; OthersHospitalsHome Healthcare
By GeographyNorth America; Europe; Asia-Pacific; South America; Middle East & AfricaNorth AmericaAsia-Pacific


Market Segmentation Overview

By Biomarker Type

Sub-SegmentKey Trend
TroponinsHigh-sensitivity conversion raises reagent value per patient episode
Creatine Kinase-MBDeclining as standalone test; retained for reinfarction assessment.
Natriuretic Peptides (BNP/NT-proBNP)Expanding coverage for treatment titration and outpatient management
MyoglobinNarrowing role as early-window adjunct in combination panels
Ischemia-Modified AlbuminGaining traction where troponin-negative ischemia is suspected
OthersPrognostic markers entering specialist and research menus


Assay chemistry, not clinical indication, is where competitive advantage is being created in this dimension. Vendors that pair sensitivity with tight lot-to-lot consistency win long-cycle laboratory contracts.

By Application

Sub-SegmentKey Trend
Acute Coronary SyndromeAccelerated 0/1-hour protocols drive serial sampling volume
Myocardial InfarctionStable core demand tied to emergency presentation rates
Congestive Heart FailurePeptide-guided therapy extends testing into outpatient follow-up.
AtherosclerosisRisk-stratification programmes create scheduled screening volume.
OthersCardiotoxicity and perioperative screening emerging as growth channels


Application mix is shifting from diagnosis toward exclusion and monitoring. That change favours suppliers with high-throughput consumables and predictable delivery schedules.

By Location of Testing

Sub-SegmentKey Trend
Central Laboratory TestingRetains cost advantage at scale; automation deepens integration
Point-of-Care TestingCartridge platforms expand into ambulance, urgent care and clinic settings.


Decentralization does not displace core laboratories so much as extend the addressable footprint. Most health systems now run hybrid models with harmonised reporting.

By End User

Sub-SegmentKey Trend
HospitalsLargest buyer; procurement centralised through group purchasing
Diagnostic LaboratoriesReferral consolidation concentrates volume among fewer networks.
Ambulatory Care CentresOutpatient cardiology growth pulls testing out of inpatient settings.
Home HealthcareRemote monitoring reimbursement unlocks recurring test demand.
OthersResearch, occupational health and clinical trial sampling


Buyer sophistication is rising across every end-user category. Contract structures increasingly bundle instruments, reagents, connectivity and service into single multi-year agreements.




Download PDF ×

We do not share your information with anyone. However, we may send you emails based on your report interest from time to time. You may contact us at any time to opt-out.