Card-Based Access Control Market (2026 – 2035)

ID: MRFR/ICT/34377-HCR 100 Pages Aarti Dhapte Last Updated: October 17, 2026
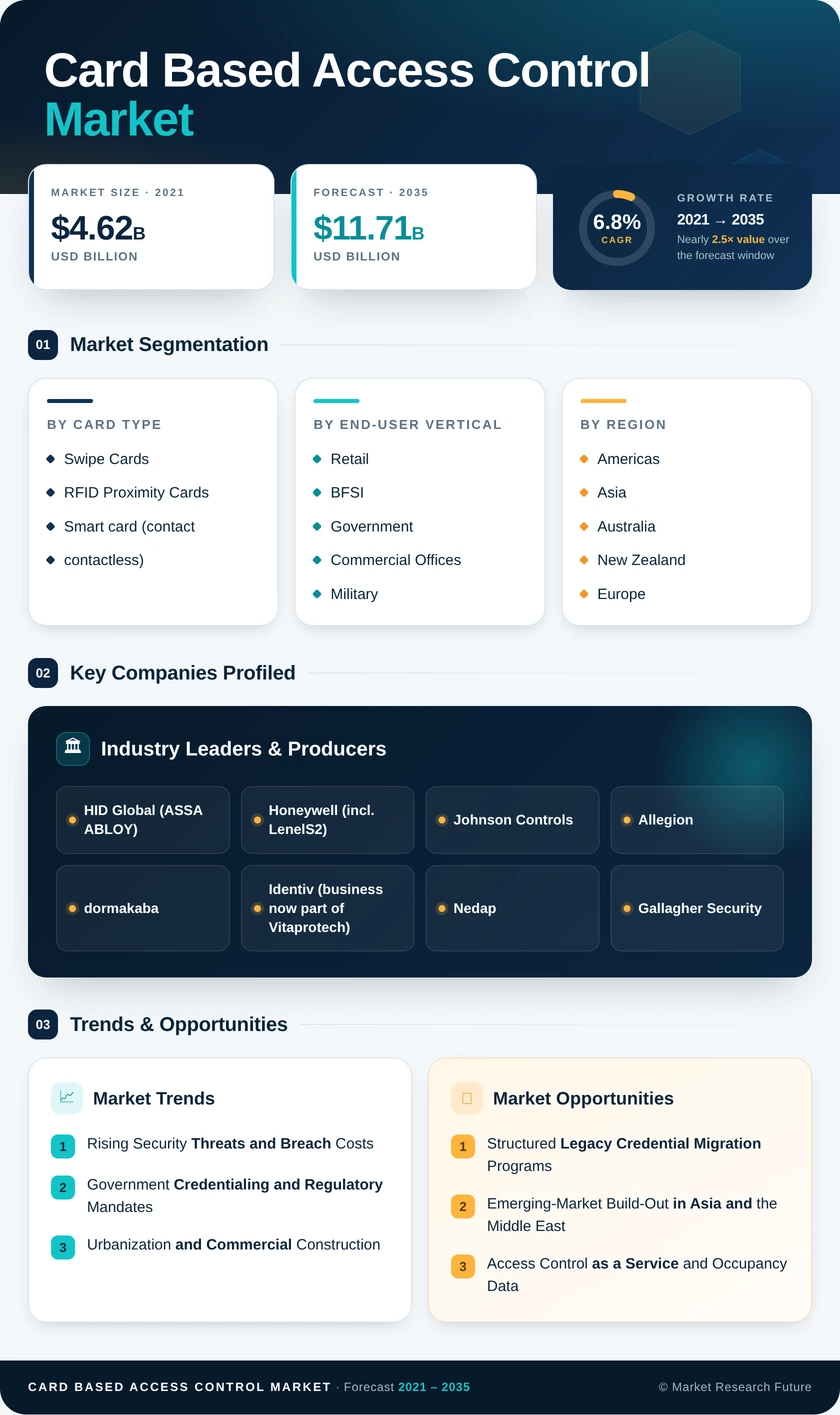
Card-Based Access Control Market Size, Share and Research Report By Card Type (Swipe Cards, RFID Proximity Cards, and Smart Cards Contact and Contactless), By End-User Vertical (Retail, BFSI, Government and Commercial Offices, Military and Defense, Entertainment and Media, Healthcare, and Others), And By Region (North America, Europe, Asia-Pacific, And Rest Of The World) – Industry Forecast Till 2035
Card-Based Access Control Market
Market Size
Forecast Period2026-2035
CAGR (2026-2035)6.8%
2025 Market SizeUSD 6.07 Billion
2035 Market SizeUSD 11.71 Billion
Key Players
HID Global
Honeywell
Johnson Controls
Allegion
dormakaba
Identiv
Opportunities
  • Structured Legacy Credential Migration Programs
  • Emerging-Market Build-Out in Asia and the Middle East
  • Access Control as a Service and Occupancy Data
  1. 1 Market Summary | |
  2. 2 Key Report Takeaways | |
    1. 2.1 By Card Type | |
    2. 2.2 By End-user Vertical | |
    3. 2.3 By Region | |
  3. 3 Market Size and Forecast (2021–2035) | |
  4. 4 Driver Impact Analysis | |
    1. 4.1 Rising Security Threats and Breach Costs | |
    2. 4.2 Government Credentialing and Regulatory Mandates | |
    3. 4.3 Urbanization and Commercial Construction | |
    4. 4.4 Preference for Contactless Credentials | |
    5. 4.5 Migration from Legacy Proximity to Smart Cards | |
    6. 4.6 Industrial and Critical Infrastructure Investment | |
  5. 5 Restraints Impact Analysis | |
    1. 5.1 Credential Cloning Vulnerabilities in Low-Frequency Cards | |
    2. 5.2 High Retrofit and Lifecycle Costs | |
    3. 5.3 Substitution by Mobile and Biometric Credentials | |
    4. 5.4 Interoperability and Integration Gaps | |
    5. 5.5 Data Protection Compliance Burden | |
  6. 6 Opportunities | |
    1. 6.1 Structured Legacy Credential Migration Programs | |
    2. 6.2 Emerging-Market Build-Out in Asia and the Middle East | |
    3. 6.3 Access Control as a Service and Occupancy Data | |
    4. 6.4 Multi-Application Credentials in Healthcare and Campuses | |
    5. 6.5 High-Assurance Credentials for Critical Infrastructure | |
  7. 7 Regional Market Share and Country-Level Analysis | |
    1. 7.1 Americas | |
    2. 7.2 Asia | |
    3. 7.3 Australia | |
    4. 7.4 New Zealand | |
    5. 7.5 Europe | |
    6. 7.6 Middle East and Africa | |
  8. 8 Future Outlook (2026–2035) | |
    1. 8.1 Hybrid Card-and-Mobile Credential Estates | |
    2. 8.2 Recurring-Revenue Platform Economics | |
    3. 8.3 Cyber-Physical Convergence and Zero Trust | |
    4. 8.4 Multi-Factor Authentication at High-Security Doors | |
  9. 9 Segmentation Analysis | |
    1. 9.1 By Card Type | | |
      1. 9.1.1 Swipe Cards | | |
      2. 9.1.2 RFID Proximity Cards | | |
      3. 9.1.3 Smart card (contact and contactless) | |
    2. 9.2 By End-user Vertical | | |
      1. 9.2.1 Retail | | |
      2. 9.2.2 BFSI | | |
      3. 9.2.3 Government and Commercial Offices | | |
      4. 9.2.4 Military and Defense | | |
      5. 9.2.5 Entertainment and Media | | |
      6. 9.2.6 Healthcare | | |
      7. 9.2.7 Others | |
  10. 10 Competitive Landscape | |
  11. 11 Recent News & Developments | |
  12. 12 Report Scope and Methodology | |
  13. 13 Detailed Sources and Citations | |
  14. 14 Frequently Asked Questions (FAQs) | | LIST OF TABLES | |
  15. TABLE 1 Global Market Size & Forecast, by Revenue (USD Billion), 2021–2035 | |
  16. TABLE 2 Driver Impact Analysis on CAGR, 2026–2035 | |
  17. TABLE 3 Restraints Impact Analysis on CAGR, 2026–2035 | |
  18. TABLE 4 Regional Summary, by Region, 2025–2035 (USD Billion) | |
  19. TABLE 5 Americas Market Size, by Country, 2021–2035 (USD Billion) | |
  20. TABLE 6 Asia Market Size, by Country, 2021–2035 (USD Billion) | |
  21. TABLE 7 Australia Market Size, by State/Territory, 2021–2035 (USD Billion) | |
  22. TABLE 8 New Zealand Market Size, by Area, 2021–2035 (USD Billion) | |
  23. TABLE 9 Europe Market Size, by Country, 2021–2035 (USD Billion) | |
  24. TABLE 10 Middle East and Africa Market Size, by Country, 2021–2035 (USD Billion) | |
  25. TABLE 11 Global Market Size, by Card Type, 2021–2035 (USD Billion) | |
  26. TABLE 12 Global Market Size, by End-user Vertical, 2021–2035 (USD Billion) | |
  27. TABLE 13 Competitive Benchmarking Matrix, 2025 | |
  28. TABLE 14 Report Scope and Methodology | |
  29. TABLE 15 Detailed Sources and Citations | | LIST OF FIGURES | |
  30. FIGURE 1 Market Dynamics Overview — Drivers, Restraints, and Opportunities | |
  31. FIGURE 2 Industry Value Chain Analysis | |
  32. FIGURE 3 Porter's Five Forces Analysis | |
  33. FIGURE 4 Global Market Size Trend, 2021–2035 (USD Billion) | |
  34. FIGURE 5 Year-over-Year Growth Trend, 2021–2035 | |
  35. FIGURE 6 Market Share, by Card Type, 2025 | |
  36. FIGURE 7 Market Share, by End-user Vertical, 2025 | |
  37. FIGURE 8 Regional Market Share, 2025 | |
  38. FIGURE 9 Regional CAGR Comparison, 2026–2035 | |
  39. FIGURE 10 Competitive Landscape — Estimated Revenue Share Ranges, 2025 | |
  40. FIGURE 11 Company Positioning Matrix

Segmentation Quick Reference

DimensionSub-SegmentsDominant SegmentFastest Growing Segment
By Card TypeSwipe Cards; RFID Proximity Cards; Smart card (contact and contactless)Smart card (contact and contactless) — 51.5% shareContactless smart cards — 8.6% CAGR
By End-user VerticalRetail; BFSI; Government and Commercial Offices; Military and Defense; Entertainment and Media; Healthcare; OthersGovernment and Commercial Offices — 31.0% shareHealthcare — 8.4% CAGR
By RegionAmericas; Asia; Australia; New Zealand; Europe; Middle East and AfricaAmericas — 37.5% shareAsia — 8.9% CAGR


Market Segmentation Overview

By Card Type

Sub-SegmentKey Trend
Swipe CardsGradual retirement outside low-cost hospitality use
RFID Proximity CardsPhased replacement driven by cloning risk
Smart card (contact and contactless)Encrypted, multi-application credentials becoming the default specification


Smart card (contact and contactless) leads this dimension with a 51.5% share, because its secure elements support mutual authentication that RFID Proximity Cards cannot provide. Contactless smart cards grow fastest at an 8.6% CAGR as buyers standardize on ISO/IEC 14443 readers. Swipe Cards continue to lose ground as magnetic-stripe slots are removed during reader refreshes.

By End-user Vertical

Sub-SegmentKey Trend
RetailProtection of stockrooms and cash offices
BFSIPhysical controls aligned with PCI DSS v4.0
Government and Commercial OfficesPIV credentialing and multi-tenant office upgrades
Military and DefenseHigh-assurance, certified credentials
Entertainment and MediaVenue entry control under new legislation
HealthcareRestricted zones for pharmacies, records, and neonatal units
OthersEducation, manufacturing, and logistics campuses


Government and Commercial Offices lead with a 31.0% share, supported by federal PIV mandates and the high door counts of multi-tenant towers. Healthcare grows fastest at an 8.4% CAGR because HIPAA physical safeguards require controlled access to areas holding protected health information. BFSI and Military and Defense add steady, compliance-driven demand for higher-security smart credentials.




Download PDF ×

We do not share your information with anyone. However, we may send you emails based on your report interest from time to time. You may contact us at any time to opt-out.