Segmentation Quick Reference
| Dimension | Sub-Segments | Dominant Segment | Fastest Growing Segment |
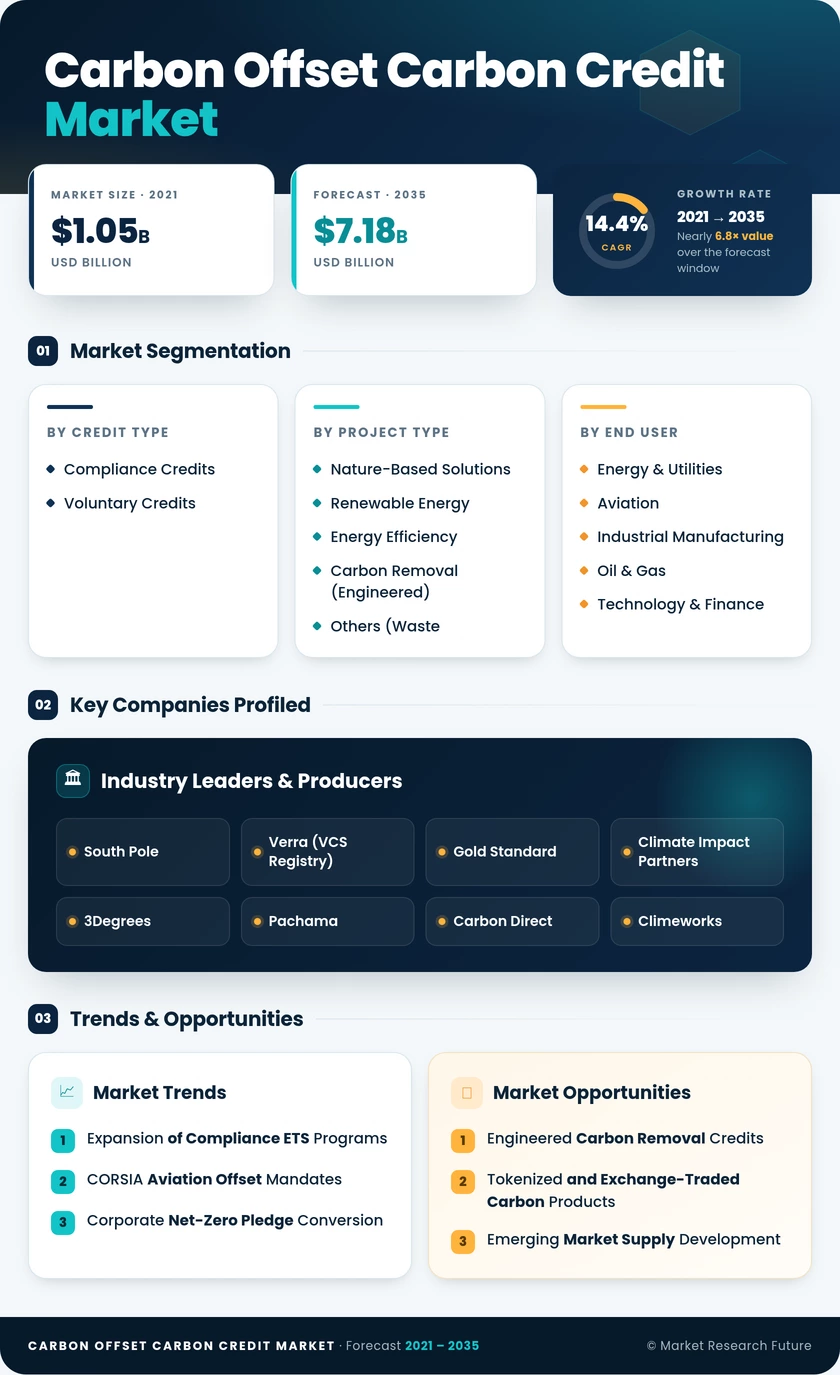
| By Credit Type | Compliance Credits; Voluntary Credits | Compliance Credits (62% share, 2025) | Voluntary Credits (18.6% CAGR) |
| By Project Type | Nature-Based Solutions; Renewable Energy; Energy Efficiency; Carbon Removal (Engineered); Others (Waste, Methane) | Nature-Based Solutions (USD 0.58 B, 2025) | Carbon Removal — Engineered (28.3% CAGR) |
| By End User | Energy & Utilities; Aviation; Industrial Manufacturing; Oil & Gas; Technology & Finance; Others | Energy & Utilities (34% share, 2025) | Aviation (19.8% CAGR) |
Market Segmentation Overview
By Credit Type
| Sub-Segment | Key Trend |
| Compliance Credits | EU ETS Phase IV tightening and China ETS sectoral expansion driving allowance price appreciation |
| Voluntary Credits | ICVCM Core Carbon Principles raising quality bar and restoring institutional buyer confidence |
Compliance credits account for the majority of transacted value, reflecting the regulatory certainty and price premium embedded in government-mandated cap-and-trade systems. Voluntary credits are growing faster as corporate decarbonization timelines compress and standardized quality frameworks reduce buyer risk.
By Project Type
| Sub-Segment | Key Trend |
| Nature-Based Solutions | Jurisdictional REDD+ nesting and satellite MRV integration improving credibility |
| Renewable Energy | Tightening additionality standards reducing issuance from grid-connected projects in OECD markets |
| Energy Efficiency | Clean-cooking and industrial retrofit projects expanding in Sub-Saharan Africa and South Asia |
| Carbon Removal (Engineered) | DAC, enhanced weathering, and biochar attracting advance purchase commitments at premium pricing |
| Others (Waste, Methane) | Landfill methane capture and agricultural methane destruction projects scaling in South America |
Nature-based solutions remain the volume leader but face increasing scrutiny on permanence and baseline-setting accuracy. Engineered carbon removal is attracting disproportionate capital inflows relative to its current market share, positioning it as the segment most likely to reshape the competitive landscape by 2030.
By End User
| Sub-Segment | Key Trend |
| Energy & Utilities | Power-sector compliance obligations under EU ETS, K-ETS, and China ETS anchoring demand |
| Aviation | CORSIA Phase 2 creating a large, predictable new demand channel from 2027 onward |
| Industrial Manufacturing | CBAM driving European importers to seek offset-linked compliance solutions |
| Oil & Gas | Supermajor transition strategies incorporating voluntary offset portfolios for Scope 3 mitigation |
| Technology & Finance | Big Tech advance-purchase commitments for carbon removal credits setting market price benchmarks |
| Others | Real estate, agriculture, and consumer goods firms entering offset procurement as disclosure mandates expand |
Energy and utilities lead by volume due to captive compliance demand, while technology and aviation represent the fastest-growing buyer cohorts. Aviation's growth trajectory is structurally locked in by CORSIA timelines, making it the most predictable source of incremental demand through 2035.