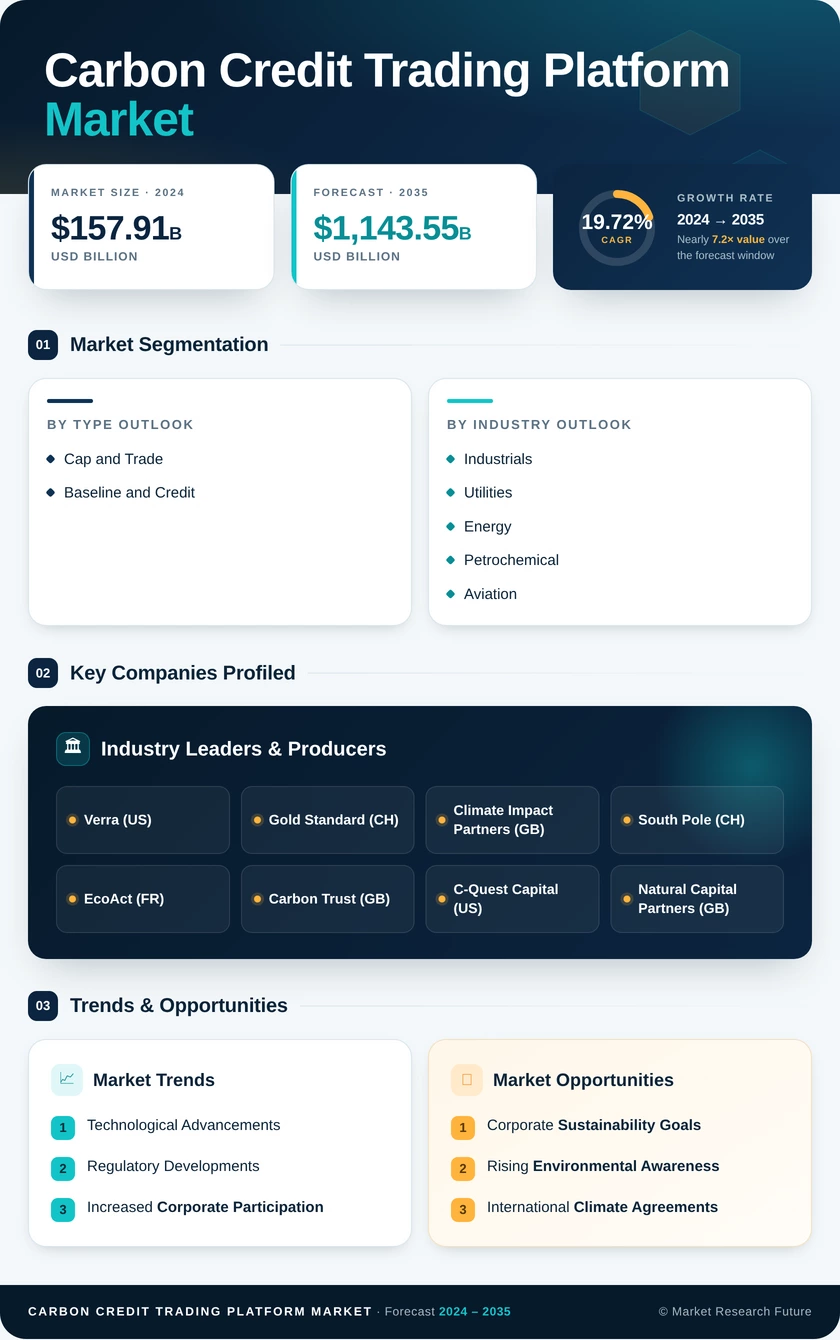
Carbon Credit Trading Platform Market (2026 - 2035)

ID: MRFR/EnP/12368-HCR 116 Pages Anshula Mandaokar Last Updated: October 16, 2026
Carbon Credit Trading Platform Market Research Report By Type (Voluntary, Compliance), By Application (Renewable Energy, Reforestation/Afforestation, Carbon Capture and Storage, Other Applications), By End-User (Corporates, Governments, Individuals) and By Regional (North America, Europe, South America, Asia Pacific, Middle East and Africa) - Forecast to 2035
Carbon Credit Trading Platform Market
Market Size
Forecast Period2026-2035
CAGR (2026-2035)16.0%
2025 Market SizeUSD 159.89 Million
2035 Market SizeUSD 716.91 Million
Key Players
Xpansiv
Intercontinental Exchange
AirCarbon Exchange
European Energy Exchange
Climate Impact X
Carbonplace
Opportunities
  • Sovereign Article 6 Infrastructure Contracts
  • Emerging-Market Origination Partnerships
  • Data and Analytics Monetization
  1. 1 Market Overview | |
    1. 1.1 Study Assumptions & Market Definition | |
    2. 1.2 Scope of the Study | |
    3. 1.3 Research Methodology | |
  2. 2 Market Summary & Key Report Takeaways | |
    1. 2.1 By Type | |
    2. 2.2 By Application | |
    3. 2.3 By End User | |
  3. 24 By Geography | |
  4. 3 Market Size & Forecast (2021–2035) | |
    1. 3.1 Historical Market Size (2021–2024) | |
    2. 3.2 Base Year Assessment (2025) | |
    3. 3.3 Forecast Market Size (2026–2035) | |
    4. 3.4 Year-over-Year Growth Analysis | |
  5. 4 Market Dynamics — Driver Impact Analysis | |
    1. 4.1 Article 6 Operationalization and ITMO Transfers | |
    2. 4.2 China ETS Expansion and Asian Liquidity | |
    3. 4.3 CORSIA Aviation Offset Obligations | |
    4. 4.4 Credit Quality Ratings and Removal Premium | |
    5. 4.5 Driver Impact Matrix | |
  6. 5 Market Dynamics — Restraints Impact Analysis | |
    1. 5.1 Credit Integrity Scandals and Buyer Hesitancy | |
    2. 5.2 Registry Fragmentation and Double-Counting Risk | |
    3. 5.3 Thin Secondary-Market Liquidity | |
    4. 5.4 Restraint Impact Matrix | |
  7. 6 Market Opportunity Analysis | |
    1. 6.1 Sovereign Article 6 Infrastructure Contracts | |
    2. 6.2 Emerging-Market Origination Partnerships | |
    3. 6.3 Data and Analytics Monetization | |
    4. 6.4 Insurance and Structured Product Wrappers | |
    5. 6.5 Compliance–Voluntary Convergence | |
    6. 6.6 Industry Value Chain Analysis | |
    7. 6.7 Porter's Five Forces Analysis | |
  8. 7 Regional Analysis | |
    1. 7.1 North America | | |
      1. 7.1.1 US | | |
      2. 7.1.2 Canada | | |
      3. 7.1.3 Mexico | |
    2. 7.2 Europe | | |
      1. 7.2.1 Germany | | |
      2. 7.2.2 UK | | |
      3. 7.2.3 France | | |
      4. 7.2.4 Italy | | |
      5. 7.2.5 Spain | | |
      6. 7.2.6 Nordic Countries | | |
      7. 7.2.7 Russia | | |
      8. 7.2.8 Rest of Europe | |
    3. 7.3 Asia-Pacific | | |
      1. 7.3.1 China | | |
      2. 7.3.2 India | | |
      3. 7.3.3 Japan | | |
      4. 7.3.4 South Korea | | |
      5. 7.3.5 ASEAN | | |
      6. 7.3.6 Rest of Asia-Pacific | |
    4. 7.4 South America | | |
      1. 7.4.1 Brazil | | |
      2. 7.4.2 Argentina | | |
      3. 7.4.3 Rest of South America | |
    5. 7.5 Middle East & Africa | | |
      1. 7.5.1 Saudi Arabia | | |
      2. 7.5.2 UAE | | |
      3. 7.5.3 South Africa | | |
      4. 7.5.4 Egypt | | |
      5. 7.5.5 Rest of Middle East & Africa | |
  9. 8 Future Outlook (2026–2035) | |
    1. 8.1 Autonomous Verification and Digital MRV | |
    2. 8.2 Platform Economics and Infrastructure Pivot | |
    3. 8.3 Removal of Supply Constraints | |
    4. 8.4 Disclosure Rules and Auditable Trails | |
  10. 9 Segmentation Analysis | |
    1. 9.1 By Type | | |
      1. 9.1.1 Voluntary | | |
      2. 9.1.2 Compliance | |
    2. 9.2 By Application | | |
      1. 9.2.1 Renewable Energy | | |
      2. 9.2.2 Reforestation/Afforestation | | |
      3. 9.2.3 Carbon Capture and Storage | | |
      4. 9.2.4 Other Applications | |
    3. 9.3 By End-User | | |
      1. 9.3.1 Corporates | | |
      2. 9.3.2 Governments | | |
      3. 9.3.3 Individuals | |
    4. 9.4 By Geography | |
  11. 10 Competitive Landscape | |
    1. 10.1 Market Concentration Analysis (2026) | |
    2. 10.2 Competitive Benchmarking Matrix | |
    3. 10.3 Company Profiles | | |
      1. 10.3.1 Xpansiv (CBL Markets) | | |
      2. 10.3.2 Intercontinental Exchange | | |
      3. 10.3.3 AirCarbon Exchange | | |
      4. 10.3.4 European Energy Exchange | | |
      5. 10.3.5 Climate Impact X | | |
      6. 10.3.6 Carbonplace | | |
      7. 10.3.7 Nasdaq / Puro.earth | | |
      8. 10.3.8 Shanghai Environment & Energy Exchange | | |
      9. 10.3.9 South Pole | | |
      10. 10.3.10 Patch | | |
      11. 10.3.11 Cloverly | | |
      12. 10.3.12 Flowcarbon | |
  12. 11 Recent News & Developments (2023–2025) | |
  13. 12 Report Scope & Methodology | |
    1. 12.1 Study Period & Base Year | |
    2. 12.2 Data Sources & Citations | |
    3. 12.3 Abbreviations | |
  14. 13 Detailed Sources and Citations | |
  15. 14 Frequently Asked Questions | | LIST OF TABLES | |
  16. TABLE 1 Global Carbon Credit Trading Platform Market Size & Forecast, by Revenue (USD Million), 2021–2035 | |
  17. TABLE 2 Global Carbon Credit Trading Platform Market — Year-over-Year Growth Analysis, 2021–2035 | |
  18. TABLE 3 Driver Impact Matrix — Impact on CAGR, Geographic Relevance and Timeline | |
  19. TABLE 4 Restraint Impact Matrix — Drag on CAGR, Geographic Relevance and Timeline | |
  20. TABLE 5 Global Market Size, by Region, 2021–2035 (USD Million) | |
  21. TABLE 6 North America Market Size, by Country, 2021–2035 (USD Million) | |
  22. TABLE 7 Europe Market Size, by Country, 2021–2035 (USD Million) | |
  23. TABLE 8 Asia-Pacific Market Size, by Country, 2021–2035 (USD Million) | |
  24. TABLE 9 South America Market Size, by Country, 2021–2035 (USD Million) | |
  25. TABLE 10 Middle East & Africa Market Size, by Country, 2021–2035 (USD Million) | |
  26. TABLE 11 Global Market Size, by Type, 2021–2035 (USD Million) | |
  27. TABLE 12 Global Market Size, by Application, 2021–2035 (USD Million) | |
  28. TABLE 13 Global Market Size, by End-User, 2021–2035 (USD Million) | |
  29. TABLE 14 North America Market Size, by Type, Application and End-User, 2021–2035 (USD Million) | |
  30. TABLE 15 Europe Market Size, by Type, Application and End-User, 2021–2035 (USD Million) | |
  31. TABLE 16 Asia-Pacific Market Size, by Type, Application and End-User, 2021–2035 (USD Million) | |
  32. TABLE 17 South America Market Size, by Type, Application and End-User, 2021–2035 (USD Million) | |
  33. TABLE 18 Middle East & Africa Market Size, by Type, Application and End-User, 2021–2035 (USD Million) | |
  34. TABLE 19 Competitive Benchmarking Matrix, 2026 | |
  35. TABLE 20 Company Profiles — Key Platform Operators and Exchanges | |
  36. TABLE 21 Recent Developments & Strategic Announcements, 2023–2025 | |
  37. TABLE 22 Report Scope & Methodology Summary | |
  38. TABLE 23 Detailed Sources and Citations Index | | LIST OF FIGURES | |
  39. FIGURE 1 Market Dynamics — Drivers, Restraints and Opportunities Snapshot | |
  40. FIGURE 2 Industry Value Chain Analysis — Origination to Retirement | |
  41. FIGURE 3 Porter's Five Forces Analysis | |
  42. FIGURE 4 Global Market Size Trend and Forecast, 2021–2035 (USD Million) | |
  43. FIGURE 5 Year-over-Year Growth Trajectory, 2022–2035 (%) | |
  44. FIGURE 6 Market Share by Type, 2025 vs 2035 (%) | |
  45. FIGURE 7 Market Share by Application, 2025 vs 2035 (%) | |
  46. FIGURE 8 Market Share by End-User, 2025 vs 2035 (%) | |
  47. FIGURE 9 Regional Market Share Distribution, 2025 (%) | |
  48. FIGURE 10 Regional CAGR Comparison, 2026–2035 (%) | |
  49. FIGURE 11 North America Country-Level Share Breakdown, 2025 (%) | |
  50. FIGURE 12 Asia-Pacific Country-Level Growth Comparison, 2026–2035 (%) | |
  51. FIGURE 13 Competitive Landscape — Revenue Share Positioning Map, 2026 | |
  52. FIGURE 14 Platform Take-Rate Compression Trend, 2021–2035 (%) | |
  53. FIGURE 15 Credit Price Differential — Avoidance vs Durable Removal, 2021–2035 (USD/tonne)

Segmentation Quick Reference

DimensionSub-SegmentsDominant SegmentFastest Growing Segment
By TypeVoluntary; ComplianceComplianceVoluntary
By ApplicationRenewable Energy; Reforestation/Afforestation; Carbon Capture and Storage; Other ApplicationsRenewable EnergyCarbon Capture and Storage
By End-UserCorporates; Governments; IndividualsCorporatesGovernments
By GeographyNorth America; Europe; Asia-Pacific; South America; Middle East and AfricaNorth AmericaAsia-Pacific


Market Segmentation Overview

By Type

Sub-SegmentKey Trend
VoluntaryShift from bulk avoidance inventory to curated, ratings-screened portfolios with durability weighting.
ComplianceAllowance turnover rising as China, India, Japan and Brazil bring new obligated sectors into scope.


Obligation drives volume, ambition drives price. Compliance flow gives platforms predictable calendar-anchored revenue, while voluntary flow supplies the margin and the product innovation. The most resilient operators now run both books on shared clearing infrastructure.

By Application

Sub-SegmentKey Trend
Renewable EnergyMethodology retirements and additionality scrutiny gradually shrink share despite deep legacy inventory.
Reforestation/AfforestationJurisdictional programmes in Brazil and Indonesia replace fragmented project-by-project issuance.
Carbon Capture and StorageDurability premium and 45Q incentives pull engineered removals into forward-contracted supply.
Other ApplicationsCookstoves, soil carbon and waste methane gain traction as measurement technology improves


Project type is now a proxy for price tier. Buyers segment their portfolios deliberately — cheap volume for interim targets, expensive durability for terminal net-zero claims — and platforms that cannot serve both tiers lose the relationship.

By End-User

Sub-SegmentKey Trend
CorporatesMulti-year forward offtakes replace spot retirement as disclosure standards harden.
GovernmentsArticle 6 bilateral agreements convert states into recurring institutional buyers.
IndividualsEmbedded checkout offsetting supplies steady high-frequency, low-ticket order flow


Buyer sophistication has risen sharply since 2023. Treasury and procurement functions, rather than sustainability teams, increasingly own carbon purchasing — which means credit rating, counterparty risk, and contractual recourse now outrank narrative appeal in vendor selection.

By Region

Sub-SegmentKey Trend
North AmericaCap-and-trade reauthorization and concentrated corporate removal demand sustain leadership.
EuropeCBAM and maritime ETS inclusion extend obligation into non-EU supply chains
Asia-PacificChina, India and Japan bring mandatory schemes online within a single 24-month window.
South AmericaBrazil's regulated system converts forest assets into compliance-grade instruments.
Middle East & AfricaGulf sovereign auctions meet African origination capacity build-out


Regulatory calendars, not economic growth rates, set the regional pecking order here. Every jurisdiction that moves from voluntary guidance to statutory obligation produces a step-change in platform onboarding within roughly eighteen months.




Download PDF ×

We do not share your information with anyone. However, we may send you emails based on your report interest from time to time. You may contact us at any time to opt-out.