Certified Global Research Member
Isomar fd.webp Wcrc 57.webp
Key Questions Answered
  • Global Market Outlook
  • In-depth analysis of global and regional trends
  • Analyze and identify the major players in the market, their market share, key developments, etc.
  • To understand the capability of the major players based on products offered, financials, and strategies.
  • Identify disrupting products, companies, and trends.
  • To identify opportunities in the market.
  • Analyze the key challenges in the market.
  • Analyze the regional penetration of players, products, and services in the market.
  • Comparison of major players’ financial performance.
  • Evaluate strategies adopted by major players.
  • Recommendations
Why Choose Market Research Future?
  • Vigorous research methodologies for specific market.
  • Knowledge partners across the globe
  • Large network of partner consultants.
  • Ever-increasing/ Escalating data base with quarterly monitoring of various markets
  • Trusted by fortune 500 companies/startups/ universities/organizations
  • Large database of 5000+ markets reports.
  • Effective and prompt pre- and post-sales support.

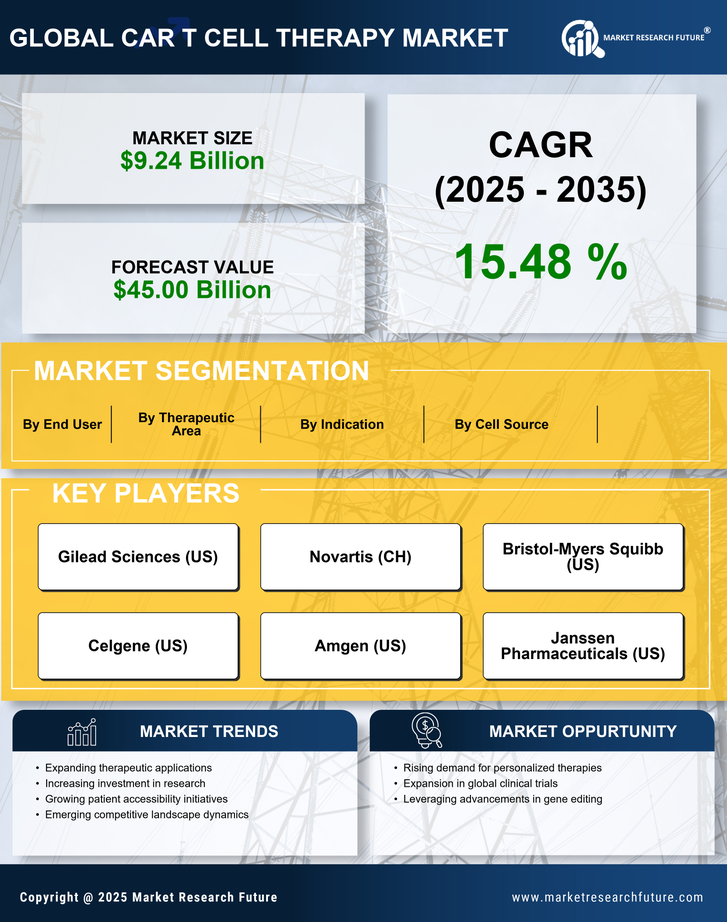
CAR T Cell Therapy Market Research Report Information By Target Antigen (CD19, CD22), By Application (Diffuse Large B-cell Lymphoma, Acute Lymphoblastic Leukemia) and Region (US, Europe, China and Rest of World) - Forecast till 2032


ID: MRFR/HC/6630-CR | 88 Pages | Author: Rahul Gotadki| February 2021

Research Methodology on Car T Cell Therapy Market


This study is conducted to explore the Global Car-T Cell Therapy Market. The research methodology used in this research report is qualitative and quantitative research. Qualitative research is used to gain an understanding of the overall dynamics of the market and the factors driving its growth.


Primary Data Sources:


The primary data for this study is obtained from interviews conducted with leading industry experts, key opinion leaders, and executives from key players in the Car-T Cell Therapy Market.


Secondary Data Sources:


Secondary data for this report is collected from various published articles, industry reports, national databases, and other sources. Market data is also collected from published journals, books, industry white papers, and trusted third-party databases.


Market Sizing and Forecasting


The market size of the Global Car-T Cell Therapy Market is estimated by using a bottom-up approach, wherein data for various applications and regional segments are collected and validated through primary interviews. The market size of each segment is obtained by deriving their production and consumption volumes. The market size of each segment is derived by taking into consideration the revenue generated and the sales volume of each product.


Market Segmentation:


The Global Car-T Cell Therapy Market is segmented on the basis of type, technology, end user and geography. On the basis of type, the market is sub-segmented into chimeric antigen receptor T-cell (CAR-T) and T-cell receptor (TCR-T) therapy.


Based on technology, the market is sub-segmented into off-the-shelf and autologous. On the basis of end users, the market is sub-segmented into hospitals and clinics, research and academic laboratories, and others. On the basis of geography, the market was sub-segmented into North America, Europe, Asia-Pacific, and the Rest of the World.


Data Triangulation:


After a comprehensive analysis of data collected from primary and secondary sources, market sizing is carried out using the triangulation method. To validate the data collected and to forecast the market size, an iterative process is employed and various assumptions are made to get an estimate of the Global Car-T Cell Therapy Market. The market size is estimated by subtracting the production volume from the consumption volume.


Data Collection and Validation


A data collection sheet is formulated to collect and validate the data for the Global Car-T Cell Therapy Market. Data collected from primary and secondary sources is validated through interviews with industry experts and key opinion leaders. The data is cross-checked to ensure the accuracy of the information.


Research Assumptions


Research assumptions and limitations are given in the report in order to give a better understanding of the findings. Assumptions were made based on historic trends, related markets, regional dynamics, and macro- and macroeconomic indicators. Data collected from primary and secondary sources is validated by conducting interviews with industry experts. A certain level of uncertainty is applied while making certain assumptions and validating the data.


Overall, the research report provides a comprehensive understanding of the Global Car-T Cell Therapy Market. The research was conducted considering various factors affecting the growth of the market.

Leading companies partner with us for data-driven Insights
client_1 client_2 client_3 client_4 client_5 client_6 client_7 client_8 client_9 client_10
Please fill in Business Email for Quick Response

1 EXECUTIVE SUMMARY

1.1 OVERVIEW 11

1.1.1 MARKET SYNOPSIS 11

2 MARKET INTRODUCTION

2.1 DEFINITION 12

2.2 SCOPE OF THE STUDY 12

2.3 RESEARCH OBJECTIVE 12

2.4 LIST OF ASSUMPTIONS & LIMITATIONS 13

3 RESEARCH METHODOLOGY

3.1 DATA MINING 14

3.2 SECONDARY RESEARCH 15

3.3 PRIMARY RESEARCH 16

3.3.1 PRIMARY INTERVIEWS AND INFORMATION GATHERING PROCESS 16

3.3.2 BREAKDOWN OF PRIMARY RESPONDENTS 17

3.4 FORECASTING TECHNIQUES 18

3.5 RESEARCH METHODOLOGY FOR MARKET SIZE ESTIMATION 19

3.5.1 BOTTOM-UP APPROACH 20

3.5.2 TOP-DOWN APPROACH 20

3.6 DATA TRIANGULATION 21

3.7 VALIDATION 21

4 MARKET DYNAMICS

4.1 OVERVIEW 22

4.2 DRIVERS 23

4.2.1 INCREASING PREVALENCE OF CANCER ACROSS THE GLOBE 23

4.2.2 TECHNOLOGICAL ADVANCEMENTS IN THE TREATMENT THERAPIES FOR CANCER 23

4.2.3 GROWING PHARMACEUTICAL INDUSTRY 23

4.2.4 INCREASE IN THE NUMBER OF CLINICAL STUDIES FOR CELL THERAPY 24

4.3 RESTRAINTS 25

4.3.1 SIDE EFFECTS OF CAR T-CELL THERAPY 25

4.3.2 HIGH COST OF TREATMENT 25

4.4 OPPORTUNITY 26

4.4.1 INVESTIGATION ON CAR-T THERAPY FOR THE TREATMENT OF SEVERAL HEMATOLOGIC AND SOLID

TUMOR TYPES 26

5 MARKET FACTOR ANALYSIS

5.1 PORTER’S FIVE FORCES ANALYSIS 27

5.1.1 THREAT OF NEW ENTRANTS 27

5.1.2 BARGAINING POWER OF SUPPLIERS 28

5.1.3 BARGAINING POWER OF BUYERS 28

5.1.4 THREAT OF SUBSTITUTES 28

5.1.5 INTENSITY OF RIVALRY 28

5.2 CLINICAL TRIALS ANALYSIS 29

5.3 COVID-19 IMPACT ANALYSIS 36

5.3.1 IMPACT ON GDP GROWTH 36

5.3.2 IMPACT ON SUPPLY CHAIN 37

5.3.3 IMPACT ON PRODUCTION 37

5.3.4 IMPACT ON KEY PLAYERS 37

6 GLOBAL CAR T CELL THERAPY MARKET, BY TARGET ANTIGEN

6.1 OVERVIEW 38

6.1.1 CD19 39

6.1.2 CD22 40

6.1.3 OTHERS 40

7 GLOBAL CAR T CELL THERAPY MARKET, BY APPLICATION

7.1 OVERVIEW 41

7.1.1 DIFFUSE LARGE B-CELL LYMPHOMA 43

7.1.2 ACUTE LYMPHOBLASTIC LEUKEMIA 44

7.1.3 OTHERS 44

8 GLOBAL CAR T CELL THERAPY MARKET, BY REGION

8.1 OVERVIEW 45

8.2 US 46

8.3 EUROPE 48

8.4 CHINA 49

8.5 REST OF THE WORLD (ROW) 50

9 COMPETITIVE LANDSCAPE

9.1 OVERVIEW 51

9.2 MAJOR PLAYERS IN THE GLOBAL CAR T CELL THERAPY MARKET 51

9.3 COMPETITIVE BENCHMARKING 52

9.4 COMPETITOR DASHBOARD 53

9.5 DEVELOPMENTS IN THE GLOBAL CAR TCELL THERAPY MARKET 53

9.5.1 ACQUISITION 53

9.5.2 JOINT VENTURES 54

9.5.3 EXPANSION 55

9.5.4 REGULATORY APPROVALS 56

9.5.5 IND CLEARANCES 56

9.5.6 PRODUCT LAUNCH/PRODUCT APPROVAL 57

10 COMPANY PROFILES

10.1 NOVARTIS AG 58

10.1.1 COMPANY OVERVIEW 58

10.1.2 FINANCIAL OVERVIEW 58

10.1.3 PRODUCTS/SERVICES OFFERED 59

10.1.4 KEY DEVELOPMENTS 59

10.1.5 SWOT ANALYSIS 60

10.1.6 KEY STRATEGIES 60

10.2 PFIZER, INC. 61

10.2.1 COMPANY OVERVIEW 61

10.2.2 FINANCIAL OVERVIEW 61

10.2.3 PRODUCTS/SERVICES OFFERED 62

10.2.4 KEY DEVELOPMENTS 62

10.2.5 SWOT ANALYSIS 63

10.2.6 KEY STRATEGIES 63

10.3 KITE PHARMA 64

10.3.1 COMPANY OVERVIEW 64

10.3.2 FINANCIAL OVERVIEW 64

10.3.3 PRODUCTS/SERVICES OFFERED 65

10.3.4 KEY DEVELOPMENTS 65

10.3.5 SWOT ANALYSIS 66

10.3.6 KEY STRATEGIES 66

10.4 CELLECTIS 67

10.4.1 COMPANY OVERVIEW 67

10.4.2 FINANCIAL OVERVIEW 67

10.4.3 PRODUCTS/SERVICES OFFERED 68

10.4.4 KEY DEVELOPMENTS 68

10.4.5 SWOT ANALYSIS 69

10.4.6 KEY STRATEGIES 69

10.5 AUTOLUS THERAPEUTICS PLC 70

10.5.1 COMPANY OVERVIEW 70

10.5.2 FINANCIAL OVERVIEW 70

10.5.3 PRODUCTS/SERVICES OFFERED 70

10.5.4 KEY DEVELOPMENTS 71

10.5.5 SWOT ANALYSIS 71

10.5.6 KEY STRATEGIES 71

10.6 CARSGEN THERAPEUTICS 72

10.6.1 COMPANY OVERVIEW 72

10.6.2 FINANCIAL OVERVIEW 72

10.6.3 PRODUCTS/SERVICES OFFERED 72

10.6.4 KEY DEVELOPMENTS 72

10.6.5 SWOT ANALYSIS 73

10.6.6 KEY STRATEGIES 73

10.7 JUNO THERAPEUTICS 74

10.7.1 COMPANY OVERVIEW 74

10.7.2 FINANCIAL OVERVIEW 74

10.7.3 PRODUCTS/SERVICES OFFERED 75

10.7.4 KEY DEVELOPMENTS 75

10.7.5 SWOT ANALYSIS 75

10.7.6 KEY STRATEGIES 76

10.8 SORRENTO THERAPEUTICS, INC. 77

10.8.1 COMPANY OVERVIEW 77

10.8.2 FINANCIAL OVERVIEW 77

10.8.3 PRODUCTS OFFERING 77

10.8.4 KEY DEVELOPMENTS 78

10.8.5 SWOT ANALYSIS 78

10.8.6 KEY STRATEGY 78

10.9 LEGEND BIOTECH 79

10.9.1 COMPANY OVERVIEW 79

10.9.2 FINANCIAL OVERVIEW 79

10.9.3 PRODUCTS/SERVICES OFFERED 80

10.9.4 KEY DEVELOPMENTS 80

10.9.5 SWOT ANALYSIS 81

10.9.6 KEY STRATEGIES 81

10.10 MUSTANG BIO 82

10.10.1 COMPANY OVERVIEW 82

10.10.2 FINANCIAL OVERVIEW 82

10.10.3 PRODUCTS/SERVICES OFFERED 83

10.10.4 KEY DEVELOPMENTS 83

10.10.5 SWOT ANALYSIS 84

10.10.6 KEY STRATEGIES 84

11 APPENDIX

11.1 REFERENCES 85

11.2 RELATED REPORTS 85

12 LIST OF TABLES

TABLE 1 LIST OF ASSUMPTIONS & LIMITATIONS 13

TABLE 2 CLINICAL TRIALS OVERVIEW 29

TABLE 3 KEY COMPANIES AND NUMBER OF CLINICAL TRIALS 36

TABLE 4 GLOBAL CAR T CELL THERAPY MARKET BY TARGET ANTIGEN, 2023-2032 (USD MILLION) 39

TABLE 5 GLOBAL CAR T CELL THERAPY MARKET FOR CD19, BY REGION, 2023-2032 (USD MILLION) 39

TABLE 6 GLOBAL CAR T CELL THERAPY MARKET FOR CD22, BY REGION, 2023-2032 (USD MILLION) 40

TABLE 7 GLOBAL CAR T CELL THERAPY MARKET BY APPLICATION, 2023-2032 (USD MILLION) 42

TABLE 8 GLOBAL CAR T CELL THERAPY MARKET FOR DIFFUSE LARGE B-CELL LYMPHOMA, BY REGION, 2023-2032 (USD MILLION) 43

TABLE 9 GLOBAL CAR T CELL THERAPY MARKET FOR ACUTE LYMPHOBLASTIC LEUKEMIA, BY REGION, 2023-2032 (USD MILLION) 44

TABLE 10 GLOBAL CAR T CELL THERAPY MARKET, BY REGION, 2023-2032 (USD MILLION) 46

TABLE 11 US CAR T CELL THERAPY MARKET, BY TARGET ANTIGEN, 2023-2032 (USD MILLION) 46

TABLE 12 US CAR T CELL THERAPY MARKET, BY APPLICATION, 2023-2032 (USD MILLION) 47

TABLE 13 EUROPE CAR T CELL THERAPY MARKET, BY TARGET ANTIGEN, 2023-2032 (USD MILLION) 48

TABLE 14 EUROPE CAR T CELL THERAPY MARKET, BY APPLICATION, 2023-2032 (USD MILLION) 48

TABLE 15 CHINA CAR T CELL THERAPY MARKET, BY TARGET ANTIGEN, 2023-2032 (USD MILLION) 49

TABLE 16 CHINA CAR T CELL THERAPY MARKET, BY APPLICATION, 2023-2032 (USD MILLION) 49

TABLE 17 REST OF THE WORLD (ROW) CAR T CELL THERAPY MARKET, BY TARGET ANTIGEN, 2023-2032 (USD MILLION) 50

TABLE 18 REST OF THE WORLD (ROW) CAR T CELL THERAPY MARKET, BY APPLICATION, 2023-2032 (USD MILLION) 50

TABLE 19 MAJOR PLAYERS IN THE GLOBAL CAR T CELL THERAPY MARKET 51

TABLE 20 COMPETITOR DASHBOARD: GLOBAL CAR T SCELL THERAPY MARKET 53

TABLE 21 ACQUISITION 53

TABLE 22 JOINT VENTURES 54

TABLE 23 EXPANSION 55

TABLE 24 REGULATORY APPROVALS 56

TABLE 25 IND CLEARANCES 56

TABLE 26 PRODUCT LAUNCH/PRODUCT APPROVAL 57

13 LIST OF FIGURES

FIGURE 1 GLOBAL CAR T CELL THERAPY MARKET STRUCTURE 13

FIGURE 2 BOTTOM-UP AND TOP-DOWN APPROACHES 19

FIGURE 3 MARKET DYNAMICS: ANALYSIS OF THE GLOBAL CAR T-CELL THERAPY MARKET 22

FIGURE 4 DRIVERS: IMPACT ANALYSIS 24

FIGURE 5 RESTRAINTS: IMPACT ANALYSIS 25

FIGURE 6 PORTER'S FIVE FORCES ANALYSIS OF THE GLOBAL CAR T CELL THERAPY MARKET 27

FIGURE 7 ONGOING CLINICAL TRIAL PHASES (%) 35

FIGURE 8 KEY COMPANIES’ CLINICAL TRIALS, (%) 36

FIGURE 9 GLOBAL CAR T CELL THERAPY MARKET, BY TARGET ANTIGEN, 2023 (%) 38

FIGURE 10 GLOBAL CAR T CELL THERAPY MARKET, BY TARGET ANTIGEN, 2023 & 2032 (USD MILLION) 38

FIGURE 11 GLOBAL CAR T CELL THERAPY MARKET, BY APPLICATION, 2023 (%) 41

FIGURE 12 GLOBAL CAR T CELL THERAPY MARKET, BY APPLICATION, 2023 & 2032 42

FIGURE 13 GLOBAL CAR T CELL THERAPY MARKET, BY REGION, 2023 (%) 45

FIGURE 14 GLOBAL CAR T CELL THERAPY MARKET, BY REGION, 2023 & 2032 (USD MILLION) 45

FIGURE 15 BENCHMARKING OF MAJOR COMPETITORS 52

Purchase Option
Single User $ 4,950
Multiuser License $ 5,950
Enterprise User $ 7,250
Compare Licenses
Tailored for You
  • Dedicated Research on any specifics segment or region.
  • Focused Research on specific players in the market.
  • Custom Report based only on your requirements.
  • Flexibility to add or subtract any chapter in the study.
  • Historic data from 2014 and forecasts outlook till 2040.
  • Flexibility of providing data/insights in formats (PDF, PPT, Excel).
  • Provide cross segmentation in applicable scenario/markets.