SEGMENTATION QUICK REFERENCE
| Dimension | Sub-Segments | Dominant Segment | Fastest Growing Segment |
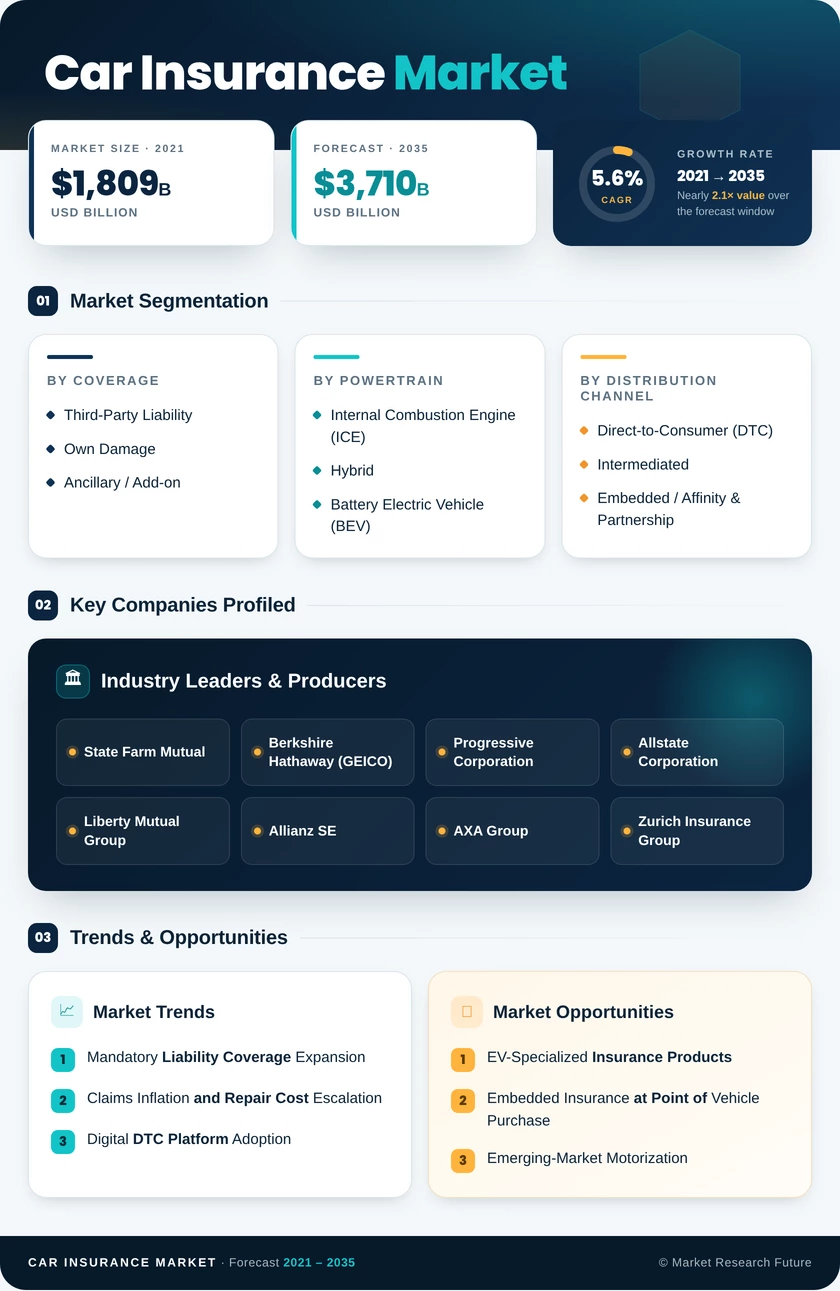
| Coverage | Third-Party Liability, Own Damage, Ancillary / Add-on | Own Damage | Ancillary / Add-on |
| Powertrain | Internal Combustion Engine (ICE), Hybrid, Battery Electric Vehicle (BEV) | ICE | BEV |
| Distribution Channel | Direct-to-Consumer (DTC), Intermediated, Embedded / Affinity & Partnership | Intermediated | Embedded / Affinity & Partnership |
| Region | North America, Europe, Asia-Pacific, South America, Middle East & Africa | North America | Asia-Pacific |
MARKET SEGMENTATION OVERVIEW
By Coverage
| Sub-Segment | Key Trend |
| Third-Party Liability | Mandatory minimums rising in multiple jurisdictions; stable premium growth |
| Own Damage | ADAS sensor-repair inflation sustaining rate hardening; dominant segment |
| Ancillary / Add-on | Zero-depreciation, engine-protect, and cyber endorsements gaining adoption |
Third-party liability remains the regulatory foundation of the car insurance market, while own damage coverage generates the largest premium pool due to consumer preference for comprehensive protection. Ancillary add-ons are the fastest-growing subsegment, driven by modular product design and higher consumer awareness of coverage gaps.
By Powertrain
| Sub-Segment | Key Trend |
| Internal Combustion Engine (ICE) | Dominant parc, electronics complexity sustaining per-policy premium growth |
| Hybrid | Transitional fleet segment; premium profiles bridging ICE and BEV |
| Battery Electric Vehicle (BEV) | Highest per-unit premium; specialist carriers and OEM programs emerging |
ICE vehicles continue to compose the overwhelming share of the insured global fleet, though their dominance is gradually eroding as hybrid and BEV registrations accelerate. BEV insurance carries the strongest growth trajectory, supported by higher average insured values and limited repair-shop capacity.
By Distribution Channel
| Sub-Segment | Key Trend |
| Direct-to-Consumer (DTC) | Mobile-first platforms compressing quote-to-bind times; growing share among younger demographics |
| Intermediated (Agents, Brokers, Bancassurance) | Advisory-driven; dominant for complex commercial and high-value policies |
| Embedded, Affinity & Partnership | OEM and fintech integration enabling point-of-sale coverage origination |
Intermediated channels remain the primary distribution path globally, though embedded and affinity partnerships are the fastest-growing model. DTC platforms continue to gain share by leveraging price transparency and digital convenience.